Protest Attitudes and Stated Preferences:
Evidence on Scale Usage Heterogeneity
Maria A. Cunha-e-Sá,
aLuis C. Nunes,
aVladimir Otrachshenko
aa
Nova School of Business and Economics, Universidade Nova de Lisboa,
Campus de Campolide 1099-032 Lisboa, Portugal
Abstract
We contribute to the stated preference literature by addressing scale usage heterogeneity regarding how individuals answer attitudinal questions capturing lack of trust in institutions and fairness issues. Using a latent class model, we conduct a contingent valuation study to elicit the willingness-to-pay to preserve a recreational site. We …nd evidence that respondents within the same class, that is, with similar preferences and attitudes, interpret the Likert scale di¤erently when answering the attitudinal questions. We identify di¤erent patterns of scale usage heterogeneity within and across classes and associate them with individual characteristics. Our approach contributes to better a understanding of individual behavior in the presence of protest attitudes.
Keywords: Scale usage heterogeneity; Likert scale; protest attitudes; con-tingent valuation; latent class model.
JEL Classi…cation Numbers: C35, Q51
Corresponding author: Vladimir Otrachshenko; Address: Faculdade de Economia, Campus de Campolide, 1099-32 Lisbon, Portugal; Phone: (351)914814617; Email: [email protected]
1
Introduction
Survey based techniques, such as Contingent Valuation (CV) and Choice Mod-elling, have been widely used in many research …elds, namely, economics, sociol-ogy, and political science, to elicit the willingness-to-pay (WTP) for non-market goods. These techniques rely on the neoclassical theory of preferences assum-ing that individuals behave rationally. However, elicited preferences are also a¤ected by other individual factors.1 Di¤erent individuals may have di¤erent
WTPs, not only because they di¤er in terms of preferences, but also in their beliefs or attitudes. A typical situation is when respondents state zero values to open-ended questions or refuse to accept any CV bids, even though they may value the good in question.2 This behavior is frequently attributed to protest
attitudes associated with the lack of trust in institutions, fairness issues, strate-gic acting, or respondents’ disagreement with some part of the survey.3 As a
result, the elicited WTP obtained from the use of standard SP techniques may not represent the “true” one if protest attitudes are ignored.
Latent Class Models (LCM) have been used in the literature to identify dis-tinct groups of people with di¤erent preferences, beliefs, or attitudes, where the individual class membership is unknown or latent. In this context, recent valu-ation studies include a set of follow-up questions in their surveys, representing an important source of additional information regarding individual attitudes. In general, attitudinal questions involve a discrete rating scale, such as the Lik-ert scale. In particular, the 5-point LikLik-ert scale (from “strongly disagree” to “strongly agree”) is often used. However, even individuals with similar
prefer-1For instance, Brown and Taylor [8] discuss gender di¤erences regarding hypothetical bias. Another example is Botzen and van der Bergh [6] on individual risk attitudes related to climate change. For a general discussion see Bateman et al.[2]:
2See Carson and Groves [10], Mitchell and Carson [19], among others.
3See Mitchell and Carson [19], Blamey [5], Meyerho¤ and Liebe [17] and [18], Polomé [20], among others.
ences and attitudes may interpret and use the same scale ratings (categories) di¤erently. For instance, some people answer only in the middle of the scale, while others may use the lower or upper end on the Likert scale. This phe-nomenon is known as scale usage heterogeneity and has been discussed in the context of consumer behavior literature by Rossi et al. [22], Wong et al. [23], and Jong et al. [15], among others.
This paper contributes to the CV literature by addressing scale use hetero-geneity in the context of latent class analysis. We identify the factors that may explain why respondents use the scale di¤erently, namely, by associating their answers with socioeconomic and preference variables.
The results are discussed in the context of a CV study regarding the preser-vation of a recreation site in the north of Portugal. After the standard CV question in the questionnaire, a set of attitudinal questions related to the bud-get issues and protest attitudes associated with the lack of trust in institutions and fairness issues is included.
The estimation results suggest three classes that di¤er with respect to the degree of protest attitudes as well as to the willingness-to-pay. We …nd evidence of the presence of scale usage heterogeneity, varying across classes, which is not related to WTP. Scale usage heterogeneity can also be associated with individual characteristics. For instance, respondents that visited the site more than once and belong to the classes that value the good use the upper end of the scale when answering the institutional attitudinal questions. Therefore, independently of being protestors or not, those that have visited the site more than once are more concerned with its preservation, and, hence, with the quality of the institutions that are responsible for it. Besides, among those that have higher protest atti-tudes, respondents that are employed and have visited the site more than once state the higher value when responding to institutional questions. Hence, these respondents are more critical with respect to the quality of institutions,
sug-gesting that misuse of …scal revenue is an especially sensitive issue for employed individuals. Finally, we …nd evidence of justi…cation bias, that is, the response to the CV question a¤ects the way people answer attitudinal questions.4
The remainder of the paper is organized as follows. The next section presents the theoretical methodology. Section 3 describes the data. Then, Section 4 presents and discusses the estimation results, while Section 5 concludes the paper. Tables and Figures are presented in the Appendix.
2
The Model
In this section we describe the proposed statistical methodology to estimate the underlying WTP for non-market-goods when using CV and attitudinal data. Our model is based on the LCM as described in McLachlan and Peel [16]. Indi-viduals are assumed to belong to one of several classes that di¤er in terms of the underlying WTP as well as unobserved behavioral, psychological, or attitudinal aspects. Even though individual class membership is not directly observed by the researcher, it can be inferred from the responses to the attitudinal and CV questions.
An important feature of our model is that it takes into account possible individual scale usage heterogeneity in the responses to the attitudinal questions. This unobservable heterogeneity is captured by a latent variable, designated as subjective scaling variable.5 As shown below, our model also allows to test for testing heterogeneity associated or not with the underlying WTP.
The general representation of the model is illustrated in Figure 1. Rectan-gles represent observed variables and ellipses represent unobserved variables, such as WTP, latent class, and subjective scaling. This approach is similar to
4This bias is widely discussed in di¤erent economic …elds, such as health, labor, trans-portation, and environment. See Au et al. [1], Bound [7], Ben-Akiva et al. [3], Cunha-e-Sá et al. [11], among others.
that of Ben-Akiva et al. [3], Provencher et al. [21], Cunha-e-Sá et al. [11]. The only di¤erence is that in this model we introduce the subjective scaling variable a¤ecting the responses to the CV and the attitudinal questions. The solid lines represent the CV model, where the CV question depends on the bid and underlying WTP. The subjective scaling is allowed to be the class speci…c. This relationship is presented by the dotted line from the latent class variable to the scaling variable. In addition, we explore the correlation between explana-tory variables and subjective scaling, which is highlighted by the dashed-dotted arrows from the explanatory variables to the subjective scaling variable. Fol-lowing Cunha-e-Sá et al. [11], the dashed arrows from the CV response to the attitudinal questions represent justi…cation bias.
In order to estimate the willingness-to-pay, we follow the random WTP approach as described in Bateman et al. [2], and Haab and McConnell [13]. The WTP for an individual n in class c can be written as follows:
WTPcn= V(Zn; Sn; #cn; c) (1) where Zn is a k 1 vector of explanatory variables that re‡ects
individual-speci…c socioeconomic characteristics, Snis the subjective scaling variable, #cnis a stochastic component capturing other unobservable individual heterogeneity, and c vectors of parameters for each class c = 1; :::; C. Assuming a
log-linear model we have that, conditional on an individual n belonging to class c , ln(WTPcn) can be written as follows:
ln(WTPcn)= c1Zn+ c2Sn+#cn (2)
In our application we adopt the usual logit model and assume that #cn= c
follows a logistic distribution where cis a scale parameter a¤ecting the variance
of the stochastic term in class c such that the cumulative distribution function of z #cn= c is given by F(z)=ez=(1 + ez):
In our application the dichotomous choice referendum was chosen as the format of the CV question. It follows that an individual responds to the CV question with “Pay” or “Not Pay” if his WTP is “larger” or “not larger” than the proposed bid amount, respectively. De…ning un = 1 when the response is
“Pay”, and un= 0 when it is “Not Pay”, we have that:
un=
1 if WTPcn > Bidn
0 otherwise (3)
where Bidn is the randomly proposed bid amount. Thus, the probability that
an individual n belonging to class c chooses to pay is given by:
Pu(un= 1jZn; Sn; Bidn; c) = F( c1Zn + c2Sn+ c3ln(Bidn)) (4)
where c1= c
1= c, c2= c2= c and c3= 1= c. The median WTP in class c
is given by Med(WTPcn) = exp
n c 1Zn+ c2Sn c 3 o :
The responses to the attitudinal questions are categorically ordered and are measured in a Likert scale taking values from 1 to T . These responses are denoted by a (p 1) vector In= (In1;:::;InJ)
0
: Each response j of an individual n can be represented as follows:
Inj= 8 > > > > > > > > < > > > > > > > > : Tj if cj;Tj 1<Inj Tj 1 if cj;Tj 2<Inj< c j;Tj 1 : : : 2 if c j;1<Inj< cj;2 1 if Inj< c j;1 (5) where c
j;k represents the threshold of switching from category k 1 to
cat-egory k when an individual belongs to class c, and Inj represents the corre-sponding latent unobserved response. We denote by the vector of all cj;k, j = 1; :::; p; k = 1; :::; T 1:
The responses to the attitudinal questions are denoted by a p 1 vector In; and are assumed to depend on the class c, the response to the CV, un, and the
subjective scaling Sn according to:
In= c+ cun+ cSn +"cn (6)
where c and c are p 1 vectors of parameters and c is a p m vector of
factor loadings for class c; respectively, and "c
nis a p 1 vector of measurement
errors that follow a distribution D(0; c"). In our application we use a logistic
distribution.
If all the elements of the vector of factor loadings c are equal to zero in a
given class c; then the model assumes that every individual in that class inter-prets the Likert scale similarly when responding to all the attitudinal questions. On the other hand, if some of the elements of care statistically di¤erent from
zero, it means that the individuals in that class interpret the Likert scale dif-ferently and, as a result, may provide di¤erent responses. Moreover, this model allows us to test if this scale usage heterogeneity in a given class is associated or not with di¤erent WTPs by checking the signi…cance of c2 in equation (4) : If c2 turns out not to be signi…cant, it means that although the individuals in class c may provide di¤erent responses to some of the attitudinal questions, they may still be considered as homogeneous in terms of the underlying WTP distribution.
From equations (5) and (6) we derive the probability of individual n answer-ing Inconditional on belonging to a particular class c; having responded un; and
the subjective scaling Sn, which is denoted as gI(Injun; Sn; c). The observed
explanatory variables, Zn, may also a¤ect the subjective scaling Sn: Thus, the
structural equation for this relationship is described by
Sn= cZn+ cn (7)
where c is a m l coe¢ cient matrix, and cn D(0; c) is a m 1 vector of i:i:d: random variables for each class c.
The combination of equations (4) and (7) gives the probability that an in-dividual n belongs to class c conditional on responses to In; un, explanatory
variables Zn, and subjective scaling Sn is:
P(cn= cjIn; un; Zn; Sn; Bidn; ) =
P(cn= c)P(un= ijZn; Sn; Bidn; c)gI(Injun; Sn; c) C
X
c=1
P(cn = c) P(un= ijZn; Sn; Bidn; c)gI(Inj; un; Sn; c)
(8) The joint probability of the responses to the CV and attitudinal questions, conditional on the exogenous explanatory variables, Zn and Bidn is given by
f(In; unjZn;Bidn; ) = C X c=1 Z S Y i=1;2
1(un= i)Pu(un= ijZn; Sn; c
; c) (9)
P(cn= c)gI(In jun; Sn; c; c; c")gS (Sn j c; c; c)dSn
where 1(:) is the indicator function, Pu is the probability that an individual
n pays (un= 1) or does not pay (un= 0), given by (4), gI is the probability
density function of the observed responses to attitudinal questions obtained by equations (5) and (6) ; gS is the probability density function of the subjective
scaling derived from equation (7) ; and
= ( c1; c2; c3; c; c; c; c"; "; ; c; c; c; c); c = 1; 2; :::; C (10)
is a vector of the parameters of the model. The integration takes place over the subjective scaling S .
Finally, the maximum likelihood estimator can be obtained by
max L( ) = max N Y n=1 f(In; unjZn;Bidn; ) ! (11) where N denotes the number of individuals in the sample.
3
Case Study
The data for the empirical application were collected in the summer of 2006, in the Alto Douro Wine Region located in the north of Portugal, to the east of the city of Oporto, in the north of Portugal. The Alto Douro Wine Region became part of UNESCO’s World Heritage cultural landscape in 2001. This landscape is comparable to the rice-growing terraces of Banaue in the Philippines. This site is one of the oldest historical winemaking regions in the world, where the famous Port Wine is produced. However, in the last three decades the old vineyards have indergone transformation in order to decrease costs and increase production e¢ ciency. This transformation causes the destruction of the original landscape.
To preserve the unique landscape of this region, which is an important recre-ation site, the winegrowers have to be compensated for the incurred cost. To evaluate the bene…ts from the preservation of the traditional attributes of the vineyard landscape in the Douro Valley, an onsite face-to-face survey of a ran-dom sample of visitors to the site was conducted. The money raised would go to a public institution that would compensate winegrowers for the incurred costs of keeping the traditional landscape. The payment mechanism that was proposed to respondents was an annual payment that would be collected in addition to the annual income tax.
In order to evaluate the willingness-to-pay for the landscape preservation, the questionnaire included a CV question in the form of referendum dichotomous choice. Each respondent was asked a CV question about an improvement in the level of preservation. The status-quo is the case of no preservation, and the bids vary among the respondents. After the CV question the respondents were asked several attitudinal questions related to the budget constraint (B1-B4) associated with rational behavior, the quality of institutions (I1-I4), and fairness issues
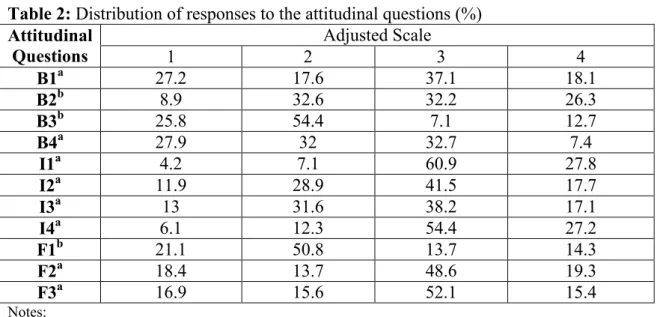
(F1-F3), representing protesting behavior (see Appendix for details). All attitudinal questions were measured on a 5-point Likert scale (from strongly disagree (1) to strongly agree (5)). As for some categories there were few responses, they were merged with the adjacent ones.
The sample used in this paper has 706 observations. Table 1 provides de-scriptive statistics for all the variables used in the estimations. In Table 2, the distribution of responses to the attitudinal questions with merged categories is presented. As can be seen from this table, many respondents answered 3 and 4 on a Likert scale, meaning that they agreed or strongly agreed with the corresponding statements.
4
Estimation Results
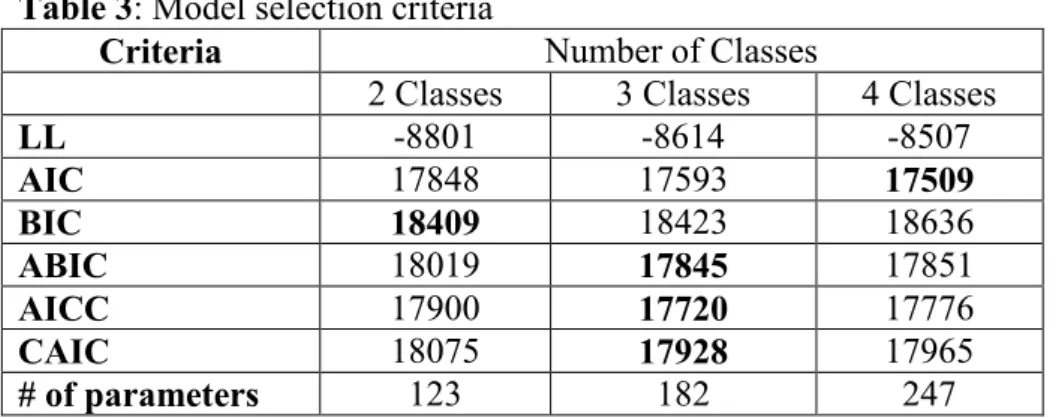
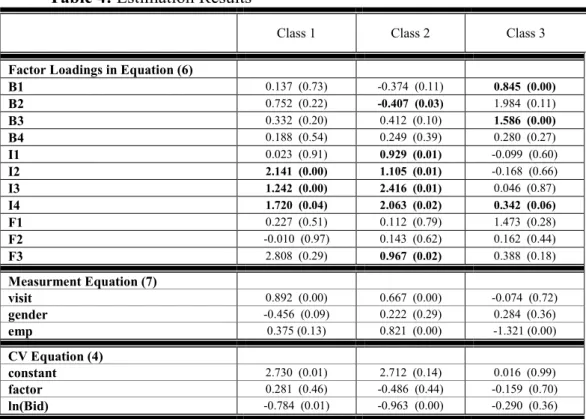
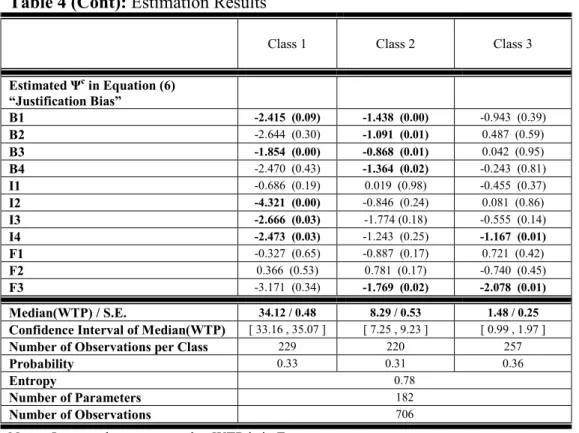
In order to identify the optimal number of classes for the model, we use …ve information criteria, namely AIC, BIC, ABIC, AICC, and CAIC. As seen in Table 3, the majority are in favor of the model with three classes. The results for this model are shown in Table 4. The …rst section of Table 4 corresponds to equation (6) where the factor loadings are presented. The next section cor-responds to equation (7) where the relationship between the subjective scaling and socioeconomic and preference variables is explored. In the third section we present the results for the CV equation (4);and in the fourth the justi…cation bias is presented. Finally, the last section shows the median WTP, the con…-dence interval for WTP, the number of parameters, probability of belonging to each class, and entropy.
We start by characterizing each class based on the corresponding estimated parameters. The estimation results of the CV equation (4) are presented in the third section of Table 4. The signi…cant estimates of ln(Bid) in classes 1 and 2 suggest that individuals in these classes value the good. We note that the
di¤erence found in the estimated WTPs is not negligible, and can be attributed to the di¤erent protest attitudes of individuals in those classes. In contrast to the other two classes, in class 3 ln(Bid) is not signi…cant, suggesting that individuals in this class do not value the good.
Following Cunha-e-Sá et al. [11], we allow individuals to justify the response to the CV question when responding to the set of attitudinal questions. This behavior is known as justi…cation bias. The estimated coe¢ cients for the budget constraint issues and justi…cation biases with respect to the lack of trust in institutions and fairness issues are presented in the second section of Table 4. The estimates on institutional (I2-I4) issues are signi…cant in class 1. When individuals refuse to pay because the bid is above their WTP it may be the case that they try to justify their negative CV response by looking like a protestor. Also, the individuals in classes 1 and 2 use the budget constraint attitudinal questions to justify the “Not Pay” CV answer by in‡ating the responses to those questions, representing rational behavior. Therefore, we may conclude that justi…cation biases with respect to institutions and fairness issues are a sensitive issue for those individuals.
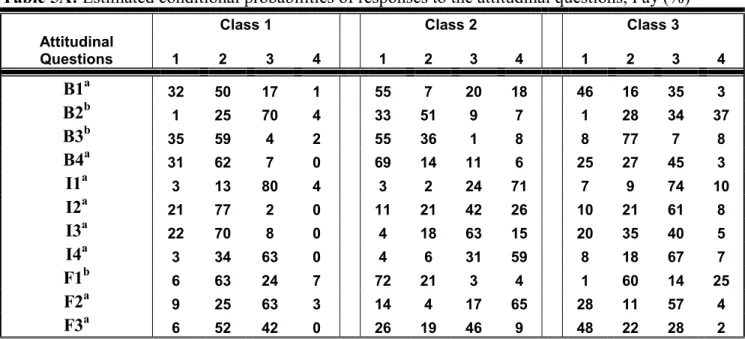
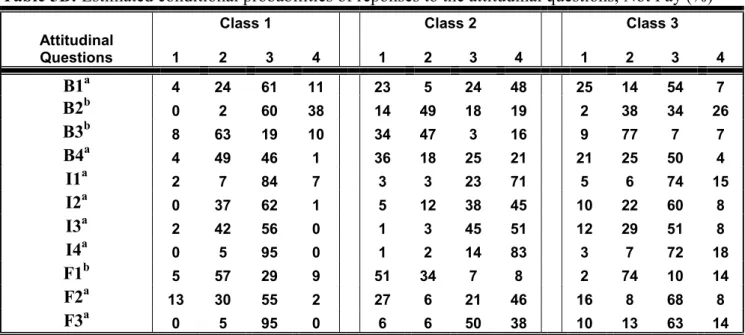
The presence of justi…cation implies that the probability distributions of the responses to some of the attitudinal questions are shifted to the right for the “Pay”answers compared to the “Not Pay”ones, as can be observed when com-paring the results in Tables 5A to 5B, respectively. In both tables we observe that the distributions of the responses to questions I1-I4 and F1-F3 for class 2 are shifted to the right relative to those in class 1, underlscoring the importance of the lack of trust in institutions and fairness issues for respondents in class 2. Therefore, we conclude that class 1 represents individuals with low protest atti-tudes (non-protestors), while class 2 represents those with high protest attiatti-tudes (protestors).
(B1-B4) in Table 5A, we …nd that the modes of the distributions in classes 1 and 2 are mostly disagree and strongly disagree (B1, B3, and B4), respectively. Comparing these classes with respect to the institutional and fairness issues for ”Pay” responses, we …nd that the mode in class 1 is either indi¤erent (I2 and I3) or agree (I1 and I4), while in class 2 the mode is either agree (I2 and I3) or strongly agree (I1 and I4). Concerning the fairness issues, in class 1, the mode ranges from disagree to agree, while in class 2 the mode is between strongly disagree and strongly agree (F1, F3, and F2, respectively).
Based on these results, we conclude that individuals in class 1 have lower protest attitudes compared to individuals in class 2. Therefore, the calculated median WTP (34.12 Euros) in class 1 is expected to be closer to the “true” one. Nevertheless, the individuals in class 2 that have a higher protest attitude are also willing to pay some positive amount even though the estimated median WTP (8.29 Euros) is substantially lower than in class 1.
4.1
Scale Usage Heterogeneity
We now discuss the estimation results regarding scale usage heterogeity. We …rst test for its presence, second, explore its causes, and third examine how the subjective scaling and socioeconomic and preferences variables a¤ect the responses to the attitudinal questions.
Since the estimated coe¢ cients of the subjective scaling variable are signi…-cant (…rst section of Table 4), the presence of scale usage heterogeneity among respondents within each class is con…rmed. For instance, in class 1, the factor loadings are signi…cant only for the institutional issues (I2-I4), while in classes 2 and 3 the factor loadings are signi…cant for budget constraint, institutional, and fairness issues (B2, I1-I4, and F3 in class 2 and B1, B3, and I4 in class 3). Given these results, we may conclude that the subjective scaling of individuals a¤ects the responses to some attitudinal questions, and varies across classes.
Moreover, we test whether the individual subjective scaling can be directly associated with the economic valuation of the good, in particular, if it is signif-icant in the CV question (third section of Table 4). As observed, the estimated coe¢ cients of this variable are not statistically signi…cant in all classes. This means that the estimated WTP is representative of all individuals within each class, and is unrelated to the individual subjective scaling.
As stated by Rossi et al. [22], scale usage heterogeneity is a well documented phenomenon. However, its causes are not well understood. In our model we explore the association between the subjective scaling and individual character-istics, such as gender, employment status, and the previous visits to the site. The results are shown in the second section of Table 4. While the estimated coe¢ cients on visit are positive and signi…cant in classes 1 and 2, the estimated coe¢ cient on gender is signi…cant only in class 1. Regarding the employment status (emp), we …nd that the coe¢ cients on this variable are signi…cant in classes 2 and 3, positive and negative, respectively.
Since in non-protestor class, class 1, we …nd positive and signi…cant factor loadings on the institutional issues (I2-I4), we may conclude that the individuals that previously visited the site use the higher values on the Likert scale to answer those questions. Also, when compared to males in this class, females use the lower values when responding to those questions.
In protestor class, that is, class 2, the signi…cant positive factor loadings on I1-I4 and F3, and coe¢ cients on visit and emp suggest that those that are employed and have previously visited the site state higher values when respond-ing those attitudinal questions. Therefore, as taxes represent a high burden on salaries, misuse of tax revenues by public institutions is a highly sensitive issue, especially for employed citizens. At the same time, the factor loading on B2 is negative, meaning that employed respondents who previously visited the site provide lower values when responding to this attitudinal question, suggesting
that they can a¤ord to pay for the good.
These results also show that individuals in classes 1 and 2 that have pre-viously visited the site use the upper end of the scale when responding the institutional attitudinal questions. Therefore, independently of the degree of protesting, e¢ ciency of institutions is an issue for those who show a preference for the valued good.
5
Conclusion
We contribute to the CV literature by addressing scale use heterogeneity in the context of LCM. Our approach enables us to better understand individual behavior when responding CV surveys that include attitudinal questions.
Our model is applied to a CV survey conducted in the Alto Douro Wine Region, Portugal, to elicit the WTP to maintain the traditional landscape in the presence of di¤erent sources of protest attitudes. We …nd evidence that respondents within the same class, that is, with similar preferences and atti-tudes, interpret the Likert scale di¤erently when responding to the attitudinal questions. We show that grouping individuals into classes with respect to their protest attitudes as well as to the economic valuation of the good allows for identifying di¤erent patterns of scale usage heterogeneity within a given sam-ple, thereby, highlighting the most sensitive issues for each particular group and across groups with di¤erent characteristics. This could not be captured without testing for the impact of the subjective scaling.
Finally, the methodology followed is ‡exible enough to be easily extended and applied to account for di¤erent behavioral and psychological attitudes. While in our application it is not possible to check how close the predicted WTP is to the actual unobserved one, it would be interesting to make this comparison in other contexts, such as when both revealed and stated preference data are
References
[1] Au, D., T. F. Crossley, and M. Schllhorn, “The E¤ect of Health Changes and Long-term Health on the Work Activity of Older Canadians”, Health Economics 10, 999-1018, 2005.
[2] Bateman I. , R. Day, B. Carson, M. Hanemann, N. Hanley, T. Hett, M. Jones-Lee M, G. Loomes, S. Mourato, E. Ozdemiroglu, D. Pearce, R. Sug-den, and J. Swanson, “Economic valuation with stated-preference tech-niques”, Edward Elgar, Cheltenham, 2002.
[3] Ben-Akiva, M., J. Walker, A. Bernardino, D. Gopinath, T. Morikawa, and A. Polydoropoulou, “Integration of Choice and Latent Variable Models”, in (H. Mahmassani, Ed.) In Perpetual Motion: Travel Behaviour Research Opportunities and Application Challenges, Elsevier Science, 431-470, 2002. [4] Bollen, P.M., “Structural Equations with Latent Variables”, Wiley Series
in Probability and Mathematical Statistics, John Wiley & Sons, 1989. [5] Blamey, R. K.,“Decisiveness, Attitude Expression and Symbolic Responses
in Contingent Valuation Surveys”, Journal of Economic Behavior & Orga-nization, Vol. 34, pp. 577-601, 1998.
[6] Botzen, W.J.W. and J.C.J.M. van den Bergh, “Risk attitudes to low-probability climate change risks: WTP for ‡ood”, Journal of Economic Behavior & Organization 82, 151 166, 2012.
[7] Bound, J., ”Self-Reported Versus Objective Measures of Health in Retire-ment Models”, Journal of Human Resources 26, 106-138, 1991.
[8] Brown, K., and L. Taylor, “Do as you say, say as you do: evidence on gender di¤erences in actual and stated contributions to public goods”, Journal of Economic Behavior & Organization 43, 127-139, 2000.
[9] Carson, R., R. Mitchell, M. Hanemann, R. Kopp, S. Presser, and P. Ruud, “Contingent Valuation and Lost Passive Use: Damages from the Exxon Valdez Oil Spill”, Environmental & Resource Economics 25, 257-86, 2003. [10] Carson, R., and T. Groves, “Incentive and Informational Properties of Preference Questions”, Environmental & Resource Economics 31, 181-210, 2007.
[11] Cunha-e-Sá, M. A., L. Madureira, L.C. Nunes, and V. Otrachshenko, “Protesting and Justifying: A Latent Class Model for Contingent Valu-ation with Attitudinal Data”, Environmental and Resource Economics 52, 531-548 , 2012.
[12] Dempster, A. P. , N. M. Laird, and D. B. Rubin, “Maximum Likelihood from Incomplete Data via the EM Algorithm”, Journal of the Royal Sta-tistical Society, Series B, 39: 1-38, 1977.
[13] Haab, T., and K. McConnell, “Valuing Environmental and Natural Re-sources”, Edward Elgar, UK, 2002.
[14] Jakobsson, K., and A. Dragun, “The Worth of a Possum: Valuing Species with the Contingent Valuation Method”, Environmental & Resource Eco-nomics 19: 211-227, 2001.
[15] Jong, M. G. D, J. B. E. M. Steenkamp, and J. P. Fox, “Relaxing Measure-ment Invariance in Cross-National Consumer Research Using a Hierarchical IRT Model”, Journal of Consumer Research, Vol. 34, No. 2, 260-278, 2007. [16] McLachlan, G. J., and D. Peel, “Finite Mixture Models”, New York, NY:
John Wiley&Sons, 2000.
[17] Meyerho¤, J., and U. Liebe, “Protest Responses in Contingent Valuation: Explaining Their Motivation”, Ecological Economics 57:583-594, 2006.
[18] Meyerho¤ J., and U. Liebe, “Determinants of Protest Responses in Envi-ronmental Valuation: A Meta-Study”, Ecological Economics 70:366–374, 2010.
[19] Mitchell, R.C., and R.T. Carson, “Using Surveys to Value Public Goods: The Contingent Valuation Method”, Resources for the Future, Washington, DC, 1989.
[20] Polomé, P., “Experimental Evidence on Deliberate Misrepresentation in Referendum Contingent Valuation”, Journal of Economic Behavior & Or-ganization, Vol. 52, pp. 387-401, 2003.
[21] Provencher B, K. Baerenklau, and R. Bishop, “A Finite Mixture Logit Model of Recreational Angling with Serially Correlated Random Utility”, American Journal of Agricultural Economics, 844, pp. 1066–1075, 2002. [22] Rossi P. E., Z. Gilula, and G. M Allenby, “Overcoming Scale Usage
Het-erogeneity: A Bayesian Hierarchical Approach”, Journal of the American Statistical Association 96, No. 453, 20-31, 2001.
[23] Wong, N., A. Rind‡eish, and J. E. Burroughs, “Do Reverse-Worded Items Confound Measures in Cross-Cultural Consumer Research? The Case of the Material Values Scales”, Journal of Consumer Research 30, 2003.
Appendix:
Attitudinal Questions:
- Budget Constraint Issues (B1-B4):
B1. The values are too high
B2. I can’t afford to pay anything right now
B3. The landscape preservation is not my problem
B4. I would rather pay more important things
- Institutions (I1-I4):
I1. The landscape should be preserved with the current taxes
I2. I think money will be used for other purposes
I3. This payment will not insure the preservation of the landscape
I4. I already pay enough taxes for this preservation
- Fairness Issues (F1-F3):
F1. The residents of the region should pay for this preservation
F2. The local authorities and tourist operators should pay for this preservation
F3. It is not fair to ask me to pay
Notes: All attitudinal questions were measured on a 5-point Likert scale (from strongly disagree (1) till strongly agree (5)). However, for some categories there were a few responses, therefore, these categories were merged to the closest one. In Table 2 the responses to the attitudinal questions with merged categories are presented.
Table 1: Descriptive Statistics
Variable Mean SD Min Max Description
CV Answer 0.32 0.47 0 1 Response to the CV question(1=Pay,0=Not Pay) Bid 46.7 29.7 10 100 Bid for the CV question in Euros Age 45.3 13.7 18 85 The age of the respondent
Emp 0.78 0.41 0 1 Employment Condition(1=Employed,0=otherwise) Visit 0.59 0.49 0 1 (1=If respondent has visited this place before,0=otherwise) Gender 0.47 0.25 0 1 (1=If respondent is a female, 0= respondent is a male)
Table 2: Distribution of responses to the attitudinal questions (%)
Attitudinal
Questions
Adjusted Scale
1
2
3
4
B1
a27.2
17.6
37.1
18.1
B2
b8.9
32.6
32.2
26.3
B3
b25.8
54.4
7.1
12.7
B4
a27.9
32
32.7
7.4
I1
a4.2
7.1
60.9
27.8
I2
a11.9
28.9
41.5
17.7
I3
a13
31.6
38.2
17.1
I4
a6.1
12.3
54.4
27.2
F1
b21.1
50.8
13.7
14.3
F2
a18.4
13.7
48.6
19.3
F3
a16.9
15.6
52.1
15.4
Notes:a) levels 1 and 2 in a Likert scale are merged in level 1 in the table b) levels 4 and 5 in a Likert scale are merged in level 4 in the table
Table 3: Model selection criteria
Criteria
Number of Classes
2 Classes
3 Classes
4 Classes
LL
-8801
-8614
-8507
AIC
17848
17593
17509
BIC
18409
18423
18636
ABIC
18019
17845
17851
AICC
17900
17720
17776
CAIC
18075
17928
17965
# of parameters
123
182
247
Table 4: Estimation Results
Class 1 Class 2 Class 3
Factor Loadings in Equation (6)
B1 0.137 (0.73) -0.374 (0.11) 0.845 (0.00) B2 0.752 (0.22) -0.407 (0.03) 1.984 (0.11) B3 0.332 (0.20) 0.412 (0.10) 1.586 (0.00) B4 0.188 (0.54) 0.249 (0.39) 0.280 (0.27) I1 0.023 (0.91) 0.929 (0.01) -0.099 (0.60) I2 2.141 (0.00) 1.105 (0.01) -0.168 (0.66) I3 1.242 (0.00) 2.416 (0.01) 0.046 (0.87) I4 1.720 (0.04) 2.063 (0.02) 0.342 (0.06) F1 0.227 (0.51) 0.112 (0.79) 1.473 (0.28) F2 -0.010 (0.97) 0.143 (0.62) 0.162 (0.44) F3 2.808 (0.29) 0.967 (0.02) 0.388 (0.18) Measurment Equation (7) visit 0.892 (0.00) 0.667 (0.00) -0.074 (0.72) gender -0.456 (0.09) 0.222 (0.29) 0.284 (0.36) emp 0.375 (0.13) 0.821 (0.00) -1.321 (0.00) CV Equation (4) constant 2.730 (0.01) 2.712 (0.14) 0.016 (0.99) factor 0.281 (0.46) -0.486 (0.44) -0.159 (0.70) ln(Bid) -0.784 (0.01) -0.963 (0.00) -0.290 (0.36)
Notes: In parentheses are p-value WTP is in Euros S.E. is a standard error
Table 4 (Cont): Estimation Results
Class 1 Class 2 Class 3
Estimated Ψc in Equation (6) “Justification Bias” B1 -2.415 (0.09) -1.438 (0.00) -0.943 (0.39) B2 -2.644 (0.30) -1.091 (0.01) 0.487 (0.59) B3 -1.854 (0.00) -0.868 (0.01) 0.042 (0.95) B4 -2.470 (0.43) -1.364 (0.02) -0.243 (0.81) I1 -0.686 (0.19) 0.019 (0.98) -0.455 (0.37) I2 -4.321 (0.00) -0.846 (0.24) 0.081 (0.86) I3 -2.666 (0.03) -1.774 (0.18) -0.555 (0.14) I4 -2.473 (0.03) -1.243 (0.25) -1.167 (0.01) F1 -0.327 (0.65) -0.887 (0.17) 0.721 (0.42) F2 0.366 (0.53) 0.781 (0.17) -0.740 (0.45) F3 -3.171 (0.34) -1.769 (0.02) -2.078 (0.01) Median(WTP) / S.E. 34.12 / 0.48 8.29 / 0.53 1.48 / 0.25
Confidence Interval of Median(WTP) [ 33.16 , 35.07 ] [ 7.25 , 9.23 ] [ 0.99 , 1.97 ]
Number of Observations per Class 229 220 257
Probability 0.33 0.31 0.36
Entropy 0.78
Number of Parameters 182
Number of Observations 706
Notes: In parentheses are p-value WTP is in Euros S.E. is a standard error
Table 5A: Estimated conditional probabilities of responses to the attitudinal questions, Pay (%)
Class 1 Class 2 Class 3
Attitudinal Questions 1 2 3 4 1 2 3 4 1 2 3 4
B1
a 32 50 17 1 55 7 20 18 46 16 35 3B2
b 1 25 70 4 33 51 9 7 1 28 34 37B3
b 35 59 4 2 55 36 1 8 8 77 7 8B4
a 31 62 7 0 69 14 11 6 25 27 45 3I1
a 3 13 80 4 3 2 24 71 7 9 74 10I2
a 21 77 2 0 11 21 42 26 10 21 61 8I3
a 22 70 8 0 4 18 63 15 20 35 40 5I4
a 3 34 63 0 4 6 31 59 8 18 67 7F1
b 6 63 24 7 72 21 3 4 1 60 14 25F2
a 9 25 63 3 14 4 17 65 28 11 57 4F3
a 6 52 42 0 26 19 46 9 48 22 28 2 Notes:a) levels 1 and 2 in a Likert scale are merged in level 1 in the table b) levels 4 and 5 in a Likert scale are merged in level 4 in the table
Table 5B: Estimated conditional probabilities of reponses to the attitudinal questions, Not Pay (%)
Class 1 Class 2 Class 3
Attitudinal Questions 1 2 3 4 1 2 3 4 1 2 3 4
B1
a 4 24 61 11 23 5 24 48 25 14 54 7B2
b 0 2 60 38 14 49 18 19 2 38 34 26B3
b 8 63 19 10 34 47 3 16 9 77 7 7B4
a 4 49 46 1 36 18 25 21 21 25 50 4I1
a 2 7 84 7 3 3 23 71 5 6 74 15I2
a 0 37 62 1 5 12 38 45 10 22 60 8I3
a 2 42 56 0 1 3 45 51 12 29 51 8I4
a 0 5 95 0 1 2 14 83 3 7 72 18F1
b 5 57 29 9 51 34 7 8 2 74 10 14F2
a 13 30 55 2 27 6 21 46 16 8 68 8F3
a 0 5 95 0 6 6 50 38 10 13 63 14 Notes:a) levels 1 and 2 in a Likert scale are merged in level 1 in the table b) levels 4 and 5 in a Likert scale are merged in level 4 in the table