FACULDADE DE CIÊNCIAS DEPARTAMENTO DE BIOLOGIA ANIMAL
Study of biomarkers to evaluate the protective
effects of antioxidants against manganese
neurotoxicity
MARIA LOPES SANTOS
MESTRADO EM BIOLOGIA HUMANA E AMBIENTE 2008
FACULDADE DE CIÊNCIAS DEPARTAMENTO DE BIOLOGIA ANIMAL
Study of biomarkers to evaluate the protective
effects of antioxidants against manganese
neurotoxicity
ORIENTADORA EXTERNA:PROF.ANA PAULA MARREILHA DOS SANTOS (PROF.AUXILIAR DA FACULDADE DE FARMÁCIA DA UNIVERSIDADE DE LISBOA)
ORIENTADORA EXTERNA:PROF.DEODÁLIA DIAS (DEPARTAMENTO DE BIOLOGIA ANIMAL, FACULDADE DE CIÊNCIAS DA UNIVERSIDADE DE LISBOA)
MARIA LOPES SANTOS
MESTRADO EM BIOLOGIA HUMANA E AMBIENTE 2008
“You can't quit now. What if the Great Valley's just over the top of these rocks?”
R
ESUMOO manganês (Mn) é um metal essencial, necessário para o normal desenvolvimento dos organismos vivos. Tem um papel importante no crescimento ósseo, no metabolismo das proteínas, lípidos e hidratos de carbono e como co-factor de diversas enzimas como por exemplo a superóxido dismutase (SOD), importante na defesa contra os radicais oxidantes. O Mn é ubíquo e ocorre naturalmente no ambiente como constituinte de uma grande variedade de minerais (óxidos, fosfatos, carbonatos, etc.), na água e nos alimentos. O Mn é muito usado na indústria, no fabrico de ligas metálicas (nomeadamente do aço), na síntese de fertilizantes e fungicidas e como aditivo em combustíveis fósseis. Os alimentos são normalmente a fonte de exposição mais relevante para a população. Em condições normais as concentrações de Mn no organismo são mantidas constantes por mecanismos homeostáticos e o excesso é eliminado do organismo. No entanto, podem ocorrer casos de sobreexposição, normalmente associada à exposição ocupacional. Uma exposição crónica a elevadas concentrações de Mn pode originar diversos efeitos tóxicos principalmente a nível neurológico.
O cérebro é o órgão-alvo na intoxicação pelo Mn. O manganismo é uma doença crónica neurodegenerativa que resulta de uma intoxicação crónica pelo Mn. Os casos detectados e descritos de manganismo caracterizam-se por elevadas concentrações de Mn nos gânglios basais e uma perda progressiva e irreversível de neurónios dopaminérgicos no globus
pallidus e zonas adjacentes. E embora se reconheça a citotoxicidade do Mn, o mecanismo
pelo qual ela ocorre ainda não está completamente esclarecido. Vários estudos apontam o stress oxidativo como responsável pelos efeitos provocados pelo Mn. O stress oxidativo é um processo que resulta de um desequilíbrio entre espécies pró-oxidantes e antioxidantes que conduz a um aumento intracelular de espécies oxidantes.
Um dos mecanismos que podem explicar a toxicidade do Mn é via oxidação da dopamina e outras catecolaminas. Pensa-se que elevadas concentrações de Mn possam acelerar a oxidação da dopamina e consequentemente acelerar o processo de formação das espécies reactivas de oxigénio (ROS). Outra possibilidade, será a de que a acumulação de Mn nas mitocôndrias interfira com a respiração mitocondrial, levando também a uma excessiva produção de ROS.
Ao nível celular, tem sido demonstrado que o Mn diminui a quantidade de glutationa (GSH) e outros tióis e de catalase. O aumento da formação de ROS por acção do Mn e a diminuição dos níveis de antioxidantes pode desequilibrar a estabilidade celular.
Antioxidantes tais como a GSH, o ácido ascórbico e a N-acetil-cisteína, podem promover uma diminuição das ROS, protegendo as células de danos e/ou da morte celular.
Um dos grandes desafios ligados ao estudo da neurotoxicidade do Mn é a descoberta e validação de indicadores biológicos que permitam prevenir e identificar a ocorrência de neurotoxicidade originada pela exposição ao Mn. Habitualmente, para avaliação da exposição de populações ao Mn, recorre-se à determinação das concentrações de Mn no sangue e/ou urina. Mas devido à toxicocinética do Mn, estes indicadores só informam acerca de uma exposição recente ao Mn, não fornecendo informação acerca exposições anteriores. Assim, embora permitam distinguir entre grupos expostos e não-expostos, não informam acerca de possíveis efeitos nefastos que podem estar em desenvolvimento como consequência de exposições anteriores ao Mn. é assim essencial o desenvolvimento de novos biomarcadores no sentido de prevenir efeitos neurotóxicos originados pela exposição ao Mn.
Para além destes biomarcadores de exposição, existem outros, os de efeito, que podem revelar algumas alterações biológicas provocadas pelo efeito tóxico do Mn. Os níveis de GSH, um dos principais antioxidantes celulares são um exemplo. A intoxicação pelo Mn tem sido associada a um decréscimo dos níveis de GSH celulares, como consequência directa da acção das ROS.
Mas existem outros marcadores já testados, mas controversos e não validados, como a prolactina. A prolactina é apontada como um indicador da função dopaminérgica. Na hipófise, a dopamina suprime a actividade secretora dos lactoforos, que produzem a prolactina. O motivo da inclusão da prolactina baseou-se no facto da exposição ao Mn causar distúrbios no cérebro ao nível da dopamina e desta servir como inibidor da libertação de prolactina na parte endócrina da hipófise, como já foi referido.
Numa perspectiva de protecção da saúde humana propusemo-nos assim estudar biomarcadores de exposição e efeito que ajudem a prevenir e identificar a ocorrência de neurotoxicidade originada pela exposição ao Mn e tentar perceber a relação exposição-efeito. Propusemo-nos ainda estudar a acção do antioxidante ebselen na toxicidade do Mn. Assim, foi realizado um ensaio in vivo com ratos Wistar repetidamente expostos a MnCl2,
via intraperitoneal (4 e 8 doses consecutivas). A exposição ao Mn foi avaliada recorrendo à determinação dos níveis de Mn no sangue e no cérebro. Após a exposição ao Mn (4 e 8 doses) verificaram-se níveis significativamente elevados de Mn no cérebro, quando comparados com o controlo (p>0.0001). Por outro lado, os níveis de Mn no sangue, não reflectiram a acumulação no cérebro, uma vez que só relativamente à dose mais alta (8 doses) é que se obtiveram valores elevados e significativos. Para além da monitorização da
exposição, foram também estudados biomarcadores de efeito, na tentativa de correlacionar estes últimos com os de exposição. Para tal, os níveis de GSH no cérebro foram determinados e foi observada uma diminuição dos seus níveis, nos animais expostos ao Mn. Essa diminuição só foi significativa para a exposição mais elevada (8 doses; p>0.0001). Foram ainda determinadas as concentrações da hormona prolactina, no soro. Estudos anteriores já haviam incluído esta determinação para tentar avaliar o seu potencial como bioindicador de neurotoxicidade, mas com resultados contraditórios e inconclusivos. Neste estudo, a prolactina revelou-se um indicador sensível e expressivo, com aumentos da concentração proporcionais às doses administradas.
Relativamente aos efeitos do ebselen, verificaram-se diferenças na acumulação do Mn no cérebro, quando o ebselen está presente. Ratos tratados com Mn e ebselen simultaneamente (8 doses) acumularam significativamente menos Mn no cérebro que os controlo (p>0.0001). No que diz respeito ao efeito antioxidante, o ebselen não parece proteger contra o stress oxidativo, nas concentrações administradas, uma vez que o composto não ofereceu protecção contra o decréscimo dos níveis de GSH.
Finalmente no que diz respeito ao estudo das possíveis interferências do Fe na acumulação do Mn no cérebro, estudada através da medição dos níveis de Fe no cérebro, não se obtiveram diferenças significativas, o que não permite que se tirem conclusões acerca do papel deste metal na toxicocinética do Mn.
PALAVRAS-CHAVE: manganês; ensaios in vivo; biomarcadores; prolactina; antioxidantes; ebselen
A
BSTRACTManganese (Mn) an essential nutrient for several animal species is required for normal aminoacid, lipid, protein and carbohydrate metabolism. However, chronic exposure to this metal can originate accumulation in the brain, leading to adverse health effects, particularly in the central nervous system. Although the exact mechanism of Mn toxicity is not completely established, several studies indicate that oxidative stress plays a major role in the Mn-induced toxicity process. To avoid overexposure and the consequent neurotoxic effects, people chronically exposed must be monitorized recorring to adequate biomarkers. The aim of this study was to examine the correlation between exposure and effect biomarkers and the possible protective effect of ebselen, a compound with antioxidant properties, against Mn toxicity. In an in vivo assay rats were exposed to several doses of Mn (4 and 8 doses) by intraperitoneal injection of manganese chloride (10.0 mg/kg).
The exposure to Mn was evaluated by measuring Mn levels in the brain and blood. Mn levels in brain were increased and significantly different from control (p<0.0001, for both doses). On the other hand, blood levels failed to evidence the accumulation of Mn in the brain in a dose-dependent manner, with only 8 doses group showing significant differences (p<0.0001). The levels of reduced glutathione (GSH) in the brain were assessed as an indirect indicator of oxidative stress and prolactin levels in serum were analyzed. GSH levels were significantly decreased in 8 doses treated animals (p<0.0001). Prolactin was shown to be a valuable indicator of the neurotoxic effects of Mn, since significant and dose-dependent increase was found for both treated groups (p<0.0001). In addition a decrease in motor activity was observed in the 8 doses group.
Finally, ebselen evidenced a protective effect against Mn accumulation in the brain, for the 8 doses group (p<0.0001). Yet, it doesn’t seem to protect against oxidative stress since decreased values of GSH were observed.
C
ONTENTSRESUMO i
ABSTRACT v
CONTENTS vi
LIST OF ABBREVIATIONS vii
LIST OF FIGURES ix
CHAPTER I–INTRODUCTION 1
CHAPTER II–STATE OF THE ART 8
CHAPTER III–OBJECTIVES 20
CHAPTER IV–MATERIALS AND METHODS 21
CHAPTER V–RESULTS 29
CHAPTER VI–DISCUSSION 40
CHAPTER VII–CONCLUSIONS 44
CHAPTER VIII–REFERENCES 45
L
IST OFA
BBREVIATIONSBBB Blood–brain barrier BCB Blood–CSF barrier Ca2+ Calcium
CNS Central nervous system CSF Cerebrospinal fuid
DMT1 Divalent metal transporter DOPA Dihydroxyphenylalanine
EDTA Ethylenediamine tetraacetic acid EPA Environment Protection Agency
ESADDI Estimated safe and adequate dietary intake F2-IsoP Isoprostanes Fe Iron Fe2+ Divalent Fe GI Gastrointestinal GCS γ-glutamyl-cysteine synthase GS GSH synthase
GSH Glutathione; reduced form of glutathione GSSG Oxidized form of glutathione
H2O2 Hydrogen peroxide
I.p Intraperitoneal injection
MMT Methylcyclopentadienyl Mn tricarbonyl
Mn Manganese
Mn2+ DivalentMn Mn3+ Trivalent Mn Mn56 Radioactive Mn MnO2 Manganese dioxide
Mn-SOD Mn superoxide dismutase MRI Magnetic resonance imaging
NRC United States National Research Council NS Nervous System
O2 Oxygen
O2·- Superoxide radical
·
OEL Occupational exposure limit
PC12 Pheochromocytoma PD Parkinson’s disease RfC Reference concentration
PAS Sodium para-aminosalicylic acid ROS Reactive oxygen species
S.E.M. Standard Error of the Mean SOD Superoxide dismutase t1/2 Half life
Tf Transferrin TfR Tf receptor
USA United States of America WHO World Health Organization
L
IST OFF
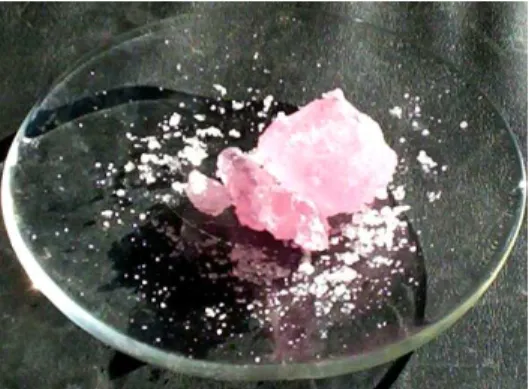
IGURESFigure 1 - Chemical Structure of glutathione. Figure 2 - Chemical Structure of Ebselen. Figure 3 - Manganese chloride.
Figure 4 - Experimental Design Figure 5 – I.p injection technique. Figure 6 - Metabolic Cage.
Figure 7 – Experimental apparatus for behavioral assay Figure 8 - Top view of the experimental apparatus
Figure 9 – Ambulation in rats exposed to 8 doses of MnCl2 and control group. Each bar
represents the mean ± S.E.M. (* p < 0.05).
Figure 10 - Rearing in rats exposed to 8 doses exposure to MnCl2 and control group. Each
bar represents the mean ± S.E.M. (* p < 0.05).
Figure 11 - Growth rate of rats. Values are means ± S.E.M. (p<0.0001, compared to control;
∆ p<0.0001, compared to Mn 4 doses group.
Figure 12 - Growth rate of the rats. Values are means ± S.E.M. (* p < 0.0001, compared to control; ∆ p<0.0001, compared to Mn 8 doses).
Figure 13 - Relative brain weight. Values are means ± S.E.M. (* p < 0.05, compared to control).
Figure 14 - Relative brain weight. Values are means ± S.E.M. (* p < 0.05, compared to control; ∆ p<0.05, compared to ebselen).
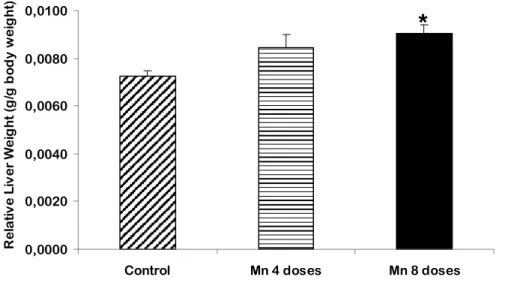
Figure 15 - Relative liver weight. Values are means ± S.E.M. (* p < 0.0001, compared to control).
Figure 16 - Relative liver weight. Values are means ± S.E.M. (* p < 0.0001, compared to control).
Figure 17 - Levels of Mn in blood. Bars represent the mean ± S.E.M. (*p< 0.0001, compared to control; ∆ p<0,0001, compared to 4 doses group).
Figure 18 - Levels of Mn in blood. Bars represent the mean ± S.E.M. (* p < 0.0001, compared to control; ∆ p<0.0001, compared to Mn 8 doses).
Figure 19 - Levels of Mn in brain tissue. Bars represent the mean ± S.E.M. (* p < 0.0001, compared to control; ∆ p< 0.0001, compared to 4 doses group).
Figure 20 - Levels of Mn in brain tissue. Bars represent the mean ± S.E.M. (* p < 0.0001, compared to control; ∆ p<0.0001, compared to ebselen group; Ο p<0.0001, compared to 8
doses group).
Figure 21 - Levels of GSH in brain tissue. Bars represent the mean ± S.E.M. (* p < 0.0001, compared to control).
Figure 22 - Levels of GSH in brain tissue. Bars represent the mean ± S.E.M. (* p < 0.0001, compared to control; ∆ p< 0.0001, compared to ebselen).
Figure 23- Prolactin levels in serum. Bars represent the mean ± S.E.M. (* p< 0.0001; ∆ p<
0.0001, compared to 4 doses group).
Figure 24 - Prolactin levels in serum. Bars represent the mean ± S.E.M. (* p< 0.0001compared to control).
Figure 25 - Correlation between Mn levels in blood and Mn levels in brain. Mn levels in blood; Mn levels in brain
Figure 26 - Correlation between prolactin in serum and Mn levels in brain. Prolactin in serum; Mn levels in brain
Figure 27 - Levels of Fe in brain tissue. Bars represent the mean ± S.E.M. Figure 28 – Levels of Fe in brain tissue. Bars represent the mean ± S.E.M.
CHAPTER I-INTRODUCTION
I
NTRODUCTIONNever take the antidote before the poison (Latin proverb)
MANGANESE –HISTORY AND MAIN USES
Manganese (Mn) is an abundant and nutritionally essential trace metal that has been used by men since the Stone Age. Back there, 17000 years ago, Mn dioxide (MnO2) was used
as a pigment for cave paintings. The Spartans in Ancient Greece had weapons made of iron and Mn ores and the Egyptians and the Romans used Mn to decolorize glass or change its color.
Nowadays Mn is mainly used in metallurgical processes to improve the properties of alloys such as steel; it is also used in non-metallurgical processes like dry-cell batteries production, in several chemical processes and in the pharmaceutical industry [1]. Mn has been used in the form of MMT (C9H7MnO3 methylcyclopentadienyl Mn tricarbonyl) to
substitute lead organic compounds in gasoline, raising concern for the health of urban populations exposed to automobile fumes [2], [3].
PHYSICAL AND CHEMICAL PROPERTIES AND BIOLOGICAL ROLE
Mn is a grey-white transition metal. It has an atomic number of 25 and belongs to Group VII of the Periodic Table [4]. The name Mn derives from the Latin magnes meaning "magnet" since the most common Mn mineral pyrolusite, has magnetic properties. Mn was discovered in 1774 by the Swedish chemist Carl-Wilhelm Scheele and it was first isolated in the same year by Scheele’s assistant Johan Gottlieb Gahn.
Mn shares numerous physical and chemical properties with iron (Fe), another transition metal. They are both adjacent to each other in the periodic table, both can have valence states +2 and +3 in physiological conditions, they show similar ionic radius, strongly bind
CHAPTER I-INTRODUCTION
transferring, and both accumulate in the mitochondria [5-7]. Mn oxidation states range from -3 to +7, but the most commons are +2, +3, +4, +6 and +7.
Mn is crucial for many metabolic and cellular functions [7]. It is needed for normal immune function, regulation of blood sugar and cellular energy, reproduction, digestion, bone growth, and aids in defense mechanisms against free radicals [8, 9]. It is required for normal amino acid, lipid, protein and carbohydrate metabolism [9], and is a co-factor for Mn superoxide dismutase (Mn-SOD) an enzyme critical in preventing cellular oxidative stress, for arginase which is responsible for the production of urea in the liver, for glutamine synthetase, the enzyme responsible for the generation of the neurotransmitter glutamate, and phosphoenolpyruvate decarboxylase [7], [10, 11].
Inadequate dietary intake and Mn deficiency, although not frequently encountered, leads to alterations in levels of cholesterol, calcium, phosphorus and alkaline phosphatase in blood, and also skin disturbances [12].
Mn IN THE ENVIRONMENT
Mn has a ubiquitous distribution in the environment, representing 0.1% of the Earth crust. It is the 12th most abundant element in the crust and the fifth most abundant metal [13], [14]. Its abundance is estimated to be from 0.085 to 0.10 percent which makes it about as abundant as fluorine or phosphorus.
Crustal rock is the major source of the Mn found in the atmosphere [13]. Crustal Mn can enter the atmosphere by both natural events and/or anthropogenic processes.
NATURAL SOURCES
Mn does not occur naturally as a pure metal (elemental form), but as a constituent of more than 100 minerals, including many sulfides, oxides, carbonates, silicates, phosphates, and borates [13].
CHAPTER I-INTRODUCTION
South Africa and the former Soviet Union have more than 80% of the world’s land-based Mn resources. Substantial Mn reserves also exist on the deep ocean floor but these are currently unavailable for commercial exploitation [1]. Natural sources include ocean spray, forest fires, vegetation, and volcanic activity. Stokes et al. estimated that two-thirds of Mn air emissions were from natural sources [15]. Air erosion of soils is also an important atmospheric source, but it wasn’t identified any quantitative estimates of Mn release to air from this source were identified [13]. The suspension of soil particles occurs specially during agricultural, construction and quarrying activities [14].
ANTHROPOGENIC SOURCES
The major anthropogenic sources of environmental Mn include municipal wastewater discharges, sewage sludge, mining and mineral processing (particularly nickel), emissions from alloy, steel, and iron production, combustion of fossil fuels, and, to a much less extent, emissions from the combustion of fuel additives.
Problems with air pollution due to Mn — especially dust and smoke containing Mn dioxide and Mn tetroxide — arise during the mining, crushing, and smelting of ores as well as during steel production [13]. Coarse particles of Mn tend to settle out near sources of pollution, but fine particulate Mn can be distributed very widely [14]. In 1996, there were 4000 tonnes of estimated releases of Mn into air in the United States of America (USA), representing 15% of total environmental releases [16]. Mn release to air occurs as a consequence of the manufacture of ferroalloys and other industrial processes but also as a result of the combustion of fossil fuels, namely those containing MMT. MMT was first used as an additive of gasoline to increase the octane rating and later to substitute lead organic compounds. It was banned from the United States of America in the 70’s and re-introduced in the 90’s. Ethyl Corp. (a major producer of MMT) confirmed that MMT is now sold in 25 countries.
CHAPTER I-INTRODUCTION
SOURCES OF EXPOSURE TO Mn
FOOD
Once Mn is a natural component of the environment, populations are always exposed to low levels in water, air, and food.
The most significant source of Mn exposure for the general population is food [13, 17]. The United States National Research Council (NRC) has established an estimated safe and adequate dietary intake (ESADDI) of 2–5 mg of Mn/day for adults [17] and the Scientific Committee for Food of the European Union estimated 1-10 mg/day as an acceptable range of intake [18]. The adequate intake is 2.3 and 1.8 mg/day for adult men and women, respectively [19].
Mn intake among individuals varies greatly, depending on dietary habits [20]. Intake can be higher for vegetarians because higher levels of Mn occur in plants. Tea and leafy green vegetables were found to be important dietary sources of Mn (a cup of tea can have between 0.4−1.3 mg/cup) [21]. Important sources of dietary Mn also include grain, rice, and nuts (≈30 mg Mn/kg).
WATER
Mn intake from drinking water is normally substantially lower than the intake from food. For an adult, the intake of Mn from drinking water should be 20 µg/day, assuming a daily water intake of 2 L [20]. Mn concentrations in drinking water range from 1-100 µg/l, with most sources containing less than 10 µg/l [8]. The USA Environment Protection Agency (EPA) limit for Mn in drinking water is 50 µg Mn/L in order to prevent visual discoloration and undesirable taste [22].
Mn also occurs naturally in surface and groundwater. Natural concentrations of Mn in seawater reportedly range from 0.4-10 µg/L [20]. Higher levels (1–200 µg Mn/L) typically occur in freshwater [22]. Human activities can be responsible for Mn contamination of water in some areas.
CHAPTER I-INTRODUCTION
AIR
EPA established an inhalation reference concentration (RfC) for respirable Mn of 0.05 µg/m3. [23]. Several studies revealed that air concentrations are in general below this value [20].
Natural background levels of Mn in air are low, ranging from 0.006 to 0.027 µg/m3. In rural areas, Mn concentrations may range from 0.01 to 0.03 µg/m3. In urban areas without important industrial sources of Mn, its levels may range from 0.01 to 0.07 µg/m3 while near industrial sources, levels can range from 0.2 to as high as 0.5 µg/m3 [24]. The intake of Mn through inhalation of environment air was estimated by the World Health Organization (WHO) to be about 2 µg/day [1]. In areas with major foundry facilities, exposure may rise to 4-6 µg/day and in areas associated with ferro- or silico Mn industries it may be as high as 10 µg/day with some values exceeding 200 µg/day [20].
OCCUPATIONAL EXPOSURE
Occupational exposure is associated with working environments from several industries including: mining, production of Mn metal and metal alloys, chemical production of Mn-based chemicals, steel production (and other metal smelting processes), welding, battery manufacture, agricultural products (production and use), pigments, paints and glass industry production [1]. In workplaces, exposure to Mn occurs mainly by inhalation of Mn fumes or Mn-containing dusts [20].
These occupational environments tend to have higher Mn levels [20]. Concentrations of 1.5–450 mg Mn/m3 have been reported in USA Mn mines, 0.30–20 mg Mn /m3 in ferroalloy production facilities, and 3–18 mg Mn /m3 in a dry-cell battery facility. These values are sometimes more than 100 times the values estimated for environment air exposure. As a result, inhalation exposure to Mn can vary from quite low (environmental) to high levels (occupational) and the impact of these exposures will likewise range from negligible to toxicologically significant levels [23]. The WHO recommended an OEL (occupational exposure limit) of 0.3 mg/m3 for respirable Mn particles [1].
CHAPTER I-INTRODUCTION
MANGANISM
Many cases of Mn neurotoxicity (manganism) have been reported particularly in miners, smelters, and workers involved in the alloy industry. Manganism is a neurological disease similar to Parkinson’s disease (PD) and was first described in the 19th Century by Couper
(1897), as an extrapyramidal dysfunction with neuropsiquiatric symptoms. Manganism is also known as Welding-related Parkinsonism or Mn-induced Parkinsonism.
The disease is initially characterized by non-specific signs and symptoms such as headache, muscles cramps, fatigue, sleep disturbances, and irritability [24, 25]. In a later stage, people may experience various psychiatric symptoms like hallucinations, emotional lability, psychosis and some movement disorders such as muscular weakness, tremor, bradykinesia, dystonia[26], [25]. Some of these symptoms are common to different forms of Parkinsonism and the diagnosis may be difficult. Nevertheless, clinical data, response to levodopa and neuroimaging studies can differentiate PD from Mn-induced Parkinsonism [26], [27].
Several studies indicate that the neuropathological basis of this condition is associated with damage to basal ganglia structures. The nuclei comprising these structures are responsible for integrating and coordinating information from various brain regions associated with motor movement, which can explain the movement disorders observed in the patients. T1-weighted magnetic resonance imaging (MRI) can detect Mn in the basal ganglia with elevated Mn levels in the globus pallidus, striatum and substantia nigra pars
reticulata [24], [26], [28], [29]. PD affects mainly the substantia nigra pars compacta and
may have a normal MRI [5], [30]. Cumulative exposure may be an important aspect of the development of the disease [26].
Lack of effective treatment for chronic manganism has been a major obstacle in clinical management of occupational Mn intoxication [31]. In some cases there was a slow recovery after exposure cessation but in most cases, chronic exposures have resulted in permanent neurological damage [24]. Calcium disodium ethylenediamine tetraacetic acid (EDTA) administration was shown to increase the excretion of Mn in urine [32] but it has low ability to repair the damaged neurons and it shows little practical benefit for severe Mn poisoning treatment. A 2006 study suggested antibacterial drug sodium para-aminosalicylic acid (PAS) as a possible effective treatment for severe chronic Mn
CHAPTER I-INTRODUCTION
intoxication with a promising long-term prognosis. However, some important questions remain unanswered, for instance the brain barrier permeability to PAS [31].
CHAPTER II–STATE OF THE ART
S
TATE OFT
HEA
RTMN TOXICOKINETICS: OVERVIEW
ABSORPTION,DISTRIBUTION,METABOLISM AND EXCRETION
In general, Mn levels in organs are kept low and constant due to homeostatic mechanisms. Since Mn is an essential metal that can be toxic in several circumstances, its homeostasis is vital for the optimal functioning of organisms [5], [33]. In 1954, Cotzias and Maynard injected radioactive Mn (Mn56) in rats and observed that Mn clearance from the blood was both rapid and extensive [34]. Mn has a relatively short blood half life (t1/2 < 2 h)
and large volume of distribution, disappearing rapidly from the blood compartment [35]. Under normal conditions blood Mn levels are maintained by both gastrointestinal (GI) absorption and by efficient removal from the liver. Only a small fraction (1–5%) of the ingested Mn is absorbed [23]. According with Garcia-Aranda and collaborators (1983) Mn absorption is a rapid saturable process [36].The mechanism(s) by which Mn is absorbed from the GI tract is incompletely understood but it is likely to include passive diffusion and active transport. Mn absorption from the GI tract is extremely complex and is influenced not only by the amount of Mn in the diet (when high, GI absorption of Mn is greatly reduced) but also by Fe and certain other nutrients. In particular, Fe deficiency is a frequent risk factor that can result in increased Mn absorption from the GI tract and enhanced brain delivery of Mn [23]. Furthermore, ingestion of high Fe vs. marginal levels of Fe increased Mn true absorption and inhibited 54Mn retention in whole animals and tissues [37].
The liver is the major route for Mn elimination playing a vital role in regulating Mn levels in
vivo. Dietary Mn is transported to the liver after absorption by the GI tract [38] where it
forms complexes with bile components [5]. Biliary excretion is the main mechanism by which Mn is excreted in the feces and removed from the body [23], [39].
Mn distribution in tissues is not homogeneous. After an intraperitoneal injection (i.p), Mn is rapidly distributed, concentrating primarily in organs rich in mitochondria [40]. The highest
CHAPTER II–STATE OF THE ART
concentrations of Mn appear in the bones and in active metabolic organs: liver, pancreas, pituitary gland, adrenal glands, and kidneys [41].
The brain is the major target organ for Mn toxicity. It retains Mn much longer than other tissues (half-life of 34 days in rats) [10], [41].
MN TRANSPORT INTO THE BRAIN
BLOOD –BRAIN BARRIER
The Nervous System (NS) is protected from the adverse effects of potential toxicants by an anatomic barrier, an interface between the blood and the brain, the blood–brain barrier (BBB) [19, 42]. Most of the brain, spinal cord, retina, and peripheral NS (PNS) maintain this barrier with the blood, with a selectivity similar to the interface between cells and the extracellular space [19]. The barrier that separates the systemic circulation from the cerebrospinal fuid (CSF) compartment is known as the blood–CSF barrier (BCB) [43]. The BBB is formed primarily by the endothelial cells of blood capillaries in the brain. Among the unique properties of endothelial cells in the NS is the presence of tight junctions between cells [19]. The endothelial cells are surrounded by a basement membrane consisting of collagen and other lipophilic matrix proteins, which together slow the diffusion of water-soluble compounds. Endothelia cells and glial cells connect with the basement membrane composing the physical BBB, which inhibits absorption transport between the blood and brain [10].
For most solutes and macromolecules, permeability across the BBB is dependent upon their lipophilicity and size. Small water-soluble nutrients and macromolecules needed for proper brain functioning can cross the barrier through specific carrier mechanisms or facilitated diffusion.
CHAPTER II–STATE OF THE ART
TRANSPORT AND ACCUMULATION
Mn can enter the brain through the capillary endothelial cells of the BBB, by the choroid plexus of the blood–CSF barrier, or via the olfactory nerve from the nasal cavity directly to the brain [10], [29].
Crossgrove and Zheng notice a readily transport of Mn through the blood–brain barrier and accumulation in specific brain regions namely the choroid plexus [10]. The influx to the choroid plexus is about 150 and 1000 times greater than that of cerebral cortex and CSF, when the plasma concentration of Mn is maintained constant [43]. This particularity can be explained since the capillary endothelial cells within the choroid plexus tissue lack tight junctions [10].
Several investigators have shown that Mn bioavailability, transport and retention in the brain also depend on the oxidation state of Mn [34], [43], [44]. Yet, how Mn is transported into the brain is still controversial. Various mechanisms have been identified, including active transport and facilitated diffusion. More recently, it has been established that Mn can also be transported via high affinity metal transporters such as calcium (Ca2+) and Fe transporters. Some of these transporters include the divalent metal transporter (DMT1), ZIP-8, a member of the solute carrier-39, Tf receptor (TfR), which is known to be responsible for Fe3+ uptake, voltage regulated and store-operated Ca2+ channels, and the ionotropic glutatmate receptor Ca2+ channels [33]. Several studies have reported that Mn accumulation in the central nervous system (CNS) is elevated during iron deficiency, supporting the hypothesis that DMT1 is involved in this uptake process [29].
Considering that both Fe and Mn are required for normal CNS function and that Mn is neurotoxic in elevated concentrations, it is important to understand the mechanisms underlying the transport processes to the brain and the stringent regulation of the concentration of these metals within the brain [45].
Divalent Mn generally bounds to β-globulin and albumin, while trivalent Mn (Mn3+) bounds to transferrin (Tf) [23]. The Tf dependent pathway proposes that the transferrin-Mn3+ complex initially binds to the TfR on the cell surface similar with iron transport. Since Mn2+ (divalent Mn) forms a relatively weak complex with either α-2-macroglobulin or serum albumin, there is also the possibility that Mn2+ transport released from this complex can be taken up directly at the cell surface by DMT1, independently of transferring [29], [43].
CHAPTER II–STATE OF THE ART
NEUROTOXICITY MECHANISMS
OXIDATIVE STRESS THEORY
Several studies have demonstrated that Mn is capable of inducing free radical formation and oxidative stress [46], [47] specifically mitochondrial oxidative stress.
There are two major mechanisms by which Mn-induced oxidative stress can occur. One of the mechanisms is via the oxidation of dopamine and other catecholamines especially because Mn accumulates in dopamine-rich brain regions of rodents and primates (e.g., basal ganglia) [48]. Free radicals generated by Mn2+ ions have been proposed to increase the oxidation of catecholamines with more free radicals production and consequent oxidative stress [49], [50]. It has been demonstrated that Mn2+ catalyzes Fenton-like reactions that generate hydroxyl radical and trigger proteolytic degradation and protein turnover. Mn via spontaneous oxidation and dismutation, peroxidative activity, or oxygen radical-mediated oxidation, gives rise to Mn3+ which will oxidatively destroy dopamine and its precursor dihydroxyphenylalanine (DOPA) [50],[51].
The other is via accumulation of Mn in the mithocondria, where interferes with proper respiration, thereby leading to excessive production of reactive oxygen species (ROS) [52], [53]. Mitochondria are critical for numerous essential aspects of cell function, from ATP energy production via the respiratory chain to steroid biosynthesis, heme assembly, pyrimidine biosynthesis, the tricarboxylic acid cycle, and apoptosis. Mitochondria are also the main producers of ROS within the cell [54].
Current evidence indicates that Mn binds to the inner mitochondrial membrane which is also the location of the electron transport system of the cell a site for production of oxygen free radicals. Small initial amounts of oxygen can be self-propagating via damage to the electron transport chain in mitochondria. When proteins or quinones that participate in transfer of electrons are damaged, the chain begins to donate electrons directly to molecular oxygen, thereby creating the highly reactive superoxide radical (O2·-).
Oxidizing conditions within the cell may also lead to the oxidation of Mn2+ to Mn3+, as has been shown in vitro and this may be a possible key event in the development of cytotoxicity in brain following exposure to Mn [47]. Mn in any oxidation state will likely spontaneously give rise to infinitesimal amounts of Mn3+ [53], and HaMai et al. [55]
CHAPTER II–STATE OF THE ART
demonstrated that it can cause formation of ROS even at trace amounts. Mn3+ appears to be both a pro-oxidant as well as an inhibitor of mitochondrial respiration, leading to increased ROS formation [56].
Some of these mitochondrial events are significantly blocked by antioxidants, suggesting the involvement of oxidative stress in the mechanism of Mn-induced mitochondrial dysfunction [57]. Significant oxidative stress has severe effects on cell survival pathways, often leading to necrosis or apoptosis [58].
Interactions between Mn and Fe play a role in Mn toxicity. The co-accumulation of Fe and Mn in the globus pallidus raises the concern that iron may be a contributing factor facilitating neuronal cell loss during Mn intoxication [19].
REACTIVE OXYGEN SPECIES (ROS)
ROS are produced as a normal product of cellular metabolism. However excessive amounts can cause deleterious effects.
ROS are highly reactive and instable. They react with several cellular components including DNA, proteins, lipids/fat acids and carbonyl groups. These reactions can damage DNA, originate mitochondrial dysfunction and injury in cell membranes and eventually lead to cell death.
Oxidative damage is caused by increased production of ROS and/or by reduced bioavailability of antioxidant defenses. This imbalance between pro-oxidants and antioxidants gives rise to cellular oxidative stress.
Acceptance of a single electron by an oxygen (O2) molecule forms O2
·
-, which has one unpaired electron. O2·- is a major agent responsible for O2 toxicity and SODs (superoxide
dismutase; namely Mn-SOD) are important antioxidant defenses. SODs remove O2 by
converting it into hydrogen peroxide (H2O2):
CHAPTER II–STATE OF THE ART
H2O2 can act as an oxidizing agent, although it is poorly reactive. Unlike O2
·
-, however-, H2O2 crosses cell membranes easily. H2O2 can be removed within human cells by the
action of two types of enzyme, catalases and selenium-dependent glutathione peroxidases.
H2O2 is known to be toxic to many systems, including nervous tissue. However, toxicity is
not usually mediated by a direct effect of H2O2 except at high (and probably
unphysiological) concentrations. Instead, H2O2 is a precursor of highly oxidizing,
tissue-damaging radicals. H2O2 reacts with divalent Fe (Fe 2+
) (and also with Mn2+) ions to form hydroxyl radical, ·OH, by the Fenton reaction, which may be represented by the overall reaction [42]:
Fe2+ + H2O2 → Fe 3+
+ ·OH + OH-
ANTIOXIDANTS
ROS can be neutralized by molecules called antioxidants. Antioxidants such as ascorbic acid, glutathione and N-acetyl cysteine decrease ROS, protecting cells from cellular damage and/or death [59] by removing free radical intermediates, and inhibiting other oxidation reactions. As a result, antioxidants are often reducing agents such as thiols or polyphenols.
Several studies have suggested that Mn toxicity is caused by its ability to increase ROS formation and decrease cellular protective mechanisms. It has been shown that Mn decreases antioxidants such as, thiols, catalase, and glutathione (GSH) [59].
ENDOGENOUS ANTIOXIDANT:GLUTATHIONE
CHAPTER II–STATE OF THE ART
GSH (L-γ-glutamyl- L- cysteinylglycine) is synthesized from L-glutamate, L-cysteine, and glycine in the presence of γ-glutamyl-cysteine synthase (GCS) and GSH synthase (GS) in consecutive steps. This synthesis occurs in virtually all types of cell types, being the liver the major producer and exporter of glutathione [56], [60, 61]. GSH has two important structural features: a sulphydryl group and a γ-glutamyl linkage [62]. The γ-glutamyl linkage promotes intracellular stability preventing GSH from being hydrolyzed by most peptidases and the sulfhydryl group is required for GSH’s functions [63], [61].
GSH is important in maintaining the intracellular redox status of protein thiols, for protection against endogenous and exogenous sources of oxidative stress, and for the conjugation and excretion of toxic molecules (Meister, 1988, 1991).
GSH exists in the reduced (GSH) and oxidized (GSSG) form. The two forms, oxidized and reduced, comprise the most abundant redox coupling mechanism of the cell. In healthy cells and tissue, more than 90% of the total glutathione pool is in the GSH form and less than 10% exists in the GSSG form. In the reduced state, the thiol group of cysteine is able to donate a reducing equivalent (H++e-) to other unstable molecules, such as ROS. After, glutathione itself becomes reactive, and readily reacts with another reactive glutathione to form GSSG.
The endogenously produced H2O2 is reduced by GSH in the presence of
selenium-dependent GSH peroxidase [63], [64]. Studies have shown that GSH is critical in defending against both physiologically and pathologically generated oxidative stress. H2O2
can also be reduced by catalase, which is present only in the peroxisome. In the mitochondria, GSH is particularly important because there is no catalase [63].
Severe oxidative stress may overcome the ability of the cell to reduce GSSG to GSH, leading to accumulation of GSSG within the cytosol. An increased GSSG/GSH ratio is considered indicative of oxidative stress [56].
GSH cannot cross cellular membranes, but intracellular pools can be increased when N-acetil-cysteine, which readily crosses membranes, is deacetylated into cysteine, a precursor for GSH [52], [56], [59].
CHAPTER II–STATE OF THE ART
EXOGENOUS ANTIOXIDANT:EBSELEN
Ebselen [2-phenyl-1,2-benzisoselenazol-3(2H)-one] is a lipid soluble seleno-organic compound [60], [65] .
The specificity for substrates ranges from H2O2 to smaller organic hydroperoxides and
includes membrane-bound phospholipid and cholesterylester hydroperoxides. Since ebselen is effective against membrane hydroperoxides, it inhibits both nonenzymatic and enzymatic lipid peroxidation in vitro and has anti-inflammatory activity in various animal models [65]. Ebselen’s antioxidant and anti-inflammatory properties have been demonstrated in a variety of in vivo models [66].
Contrary to the reductive detoxification of hydroperoxides, ebselen is a poor free radical scavenger and consequently this is not regarded as a significant component of its pharmacodynamic activity [67]. Ebselen is not a free radical scavenger per se, but mimics the enzyme glutathione peroxidase. Like these enzymes, ebselen acts with glutathione through a selenium core to eliminate hydroperoxides and lipoperoxides [60], [68, 69]. Therefore, ebselen, when combined with suitable thiol compounds such as glutathione or
N-acetil- cysteine, it can reduce hydrogen peroxide to water and attenuate lipid
peroxidation by reducing organic cholestrol, cholesterol ester- and phospholipid peroxides. Results of clinical trials indicate the benefit of ebselen as a neuroprotective agent because of the multiplicity of its mechanisms for inhibiting free radical-induced injury coupled with its lack of side-effects, good blood-brain penetrability and rapid absorption following oral administration [69], [70]. Unlike inorganic selenium and selenomethionine, ebselen is not toxic to mammals [60].
Recently, a new property of ebselen to inhibit apoptosis has been demonstrated [71]. Figure 2 - Chemical Structure of Ebselen
CHAPTER II–STATE OF THE ART
ANTIOXIDANTS AS INDICATORS OF OXIDATIVE STRESS
The presence of oxidants can be assessed by measuring species that are known to increase or decrease in response to oxidative stress. This includes ubiquitous antioxidants, such as GSH [52].
Experimental work suggests that Mn increases the production of free radicals measured as increased lipid peroxides, reduced glutathione, metallothionein [53], and other specific biomarkers derived from the effects of Mn on biogenic amines such as dopamine [72]. Severe oxidative stress depletes cellular GSH.In vitro studies showed that the inhibition of GSH synthesis and the consequent impairment of the neuronal antioxidant system activity plays a permissive role in oxidative stress-mediated Mn neurotoxicity [73].
BIOMARKERS OF EXPOSURE
Biological markers can link the presence of a chemical in various environmental compartments to specific sites of action in target organs and to host responses [19]. Biomarkers can be xenobiotics themselves or a result of their metabolism.
The strength of association between exposure biomarkers and the effect outcome was not often particularly strong, which may in part reflect uncertainty or limitations in how well the biomarker captures the external exposures contributing to toxicity [74].
The identification and validation of exposure biomarkers is fundamental to human toxicology and risk assessment but it has been a challenge to identify and validate biomarkers for Mn exposure and effect [74]. And since Mn is an essential element, in normal conditions the concentrations in the body are controlled by homeostatic mechanisms regulating absorption, disposition, and excretion. These processes also play an important role in Mn toxicokinetics, contributing to the complexity that has been the validation of biomarkers of exposure for Mn.
The assessment of Mn exposure, especially in human populations, is through Mn determination in blood and urine samples. Nevertheless, published literature reveals
CHAPTER II–STATE OF THE ART
substantial variability in blood Mn levels measured in exposed subjects. Lucchini et al. (1999) observed an association between blood Mn and exposure intensity [75]. One year later, Apostoli and co-workers investigated the suitability of blood and urine Mn levels on the exposure assessment and concluded that these two parameters can only discriminate between groups of occupationally exposed and control subjects [76].
Ideally, biological markers of exposure should reflect an integration of the internalized dose over time. Recently Mn blood levels as exposure biomarker were described as limited and highly dependent on the exposure parameters [74]. Blood Mn alone appears to have utility only for group exposure surveillance, not showing a relation between the level of exposure and the blood levels. Besides, blood and urine Mn analysis don’t provide information about previous exposures, probably and partially due to Mn short blood half-life (t1/2 < 2 h) and large volume of distribution, disappearing rapidly from the blood
compartment [35].
Mn in blood has been referred as an indirect reference to be associated to some other variables that could be affected by Mn exposure, the markers of effects [72].
Since much of clinical diagnostic medicine relies on effects-related biomarkers [19] and the currently available tests (Mn in blood and urine) seem to fail in establishing this relationship, attention should be focused on other indicators [72], [76], [77].
BIOMARKERS OF EFFECT
Biomarkers of effect, altogether with the already known and tested biomarkers of exposure could help establishing a correlation between the exposure and their consequences for the organism. Those with a better exposure-response relationship must be proposed and validated.
CHAPTER II–STATE OF THE ART
GSH
As previously mentioned, oxidative stress is generally accepted as one of the mechanisms through which Mn toxicity acts. Alterations in brain GSH metabolism have been linked to oxidative stressand various neurodegenerative diseases [78].
As a result, oxidative stress can be indirectly assessed by measuring the levels of antioxidant species such as metallothionein and GSH. In postmortem studies of PD brains, the amounts of GSH in the substantia nigra were found reduced, which can be a good indication for the use of GSH in Mn neurotoxicity studies [53].
At the cellular level, it has been shown that Mn decreases antioxidants such as catalase, and GSH. This decrease in intracellular antioxidants is sustained by the observation by Sloot et al. that Mn induces ROS formation [59], [84].
Much of the evidence supporting a role for oxidative stress in the toxicity of Mn comes from in vitro studies. Seth et al. observed that in Mn treated rat pheochromocytoma (PC12) cells there was a decrease in GSH content, catalase activity, and mitochondrial activity [56].
But some in vivo studies have also come out with similar results. In 2000, Dorman et al. [79] detected significantly decreased striatal GSH levels following subchronic MnSO4
inhalation and similar decreases in GSH concentrations in the cerebellum and hypothalamus following exposure to hureaulite.
PROLACTIN
It is known that Mn causes alterations in the cerebral dopamine [80], a fact that is tightly related to the psychiatric and expyramidal symptoms during Mn intoxication.
Dopamine, within the pituitary, suppresses the secretory activity of specific pituitary cells called lactotrophs [81]. These cells are responsible for the secretion of an important hormone, prolactin. Dopamine acts by binding to D2-receptors on the lactotrophs and inhibits both the release and the synthesis of prolactin [82], [83].
CHAPTER II–STATE OF THE ART
It is hypothesized that Mn exposure suppresses the inhibition of dopamine on and prolactin, and then an increase of prolactin may be observed [81], [84].
Prolactin has been used as a biological exposure index of Mn exposure in several reports [72], [82, 84] with inconclusive or negative results as well [85], [86].
ISOPROSTANES (F2-ISOP)
Isoprostanes are prostaglandin – like compounds produced in vivo primarily by free radical-induced peroxidation of arachidonic acid [87], [88]. It has been established that measurement of F2-IsoP provides an important tool to explore the role of oxidative stress
in human disease [87]. Measurement of F2-IsoP is at present regarded as a reliable
approach for the assessment of oxidant stress status and free radical mediated lipid peroxidation in vivo [88]. Quantification of F2-IsoP is used as a reliable marker of lipid
peroxidation in vivo.
F2-IsoP are detectable in various tissues including the lung, liver, kidney and the brain, fat,
muscle. They have also been found in measurable quantities in most of the biological fluids like plasma and urine, biological samples that can be easily obtained.
CHAPTER III–OBJECTIVES
O
BJECTIVES- To apply an in vivo assay to control the internal doses of exposure in rats exposed to repeated doses of Mn;
- To correlate the biomarkers of exposure (blood and brain Mn levels ) with the biomarkers of effect (prolactin, GSH and behavioural assays)
- To study the interference of ebselen in the toxicokinetics and/or toxicodynamics of Mn;
CHAPTER IV–MATERIALS AND METHODS
M
ATERIALS ANDM
ETHODSREAGENTS
Manganese chloride tetrahydrate (MnCl2·4H2O; 99,99%, Sigma-Aldrich)
Ebselen (>99% Appli Chem, Biochemica)
Nitric Acid (HNO3; 65% Suprapure; Merck)
Hydrogen Peroxide (H2O2, 30%; Aldrich)
ANIMALS
Male Wistar rats (150-171g) were provided by Charles River Laboratories ®, Barcelona. The animals were housed in an independent room, with 12-h light/dark cycle, humidity of 50–70% and a temperature of 24°C with free access t o water and food. Food was supplied as pellets adequated for normal growth, reproduction, and maintenance.
The general condition of all animals was checked every day. All animals received human care according to the criteria outlined in the “Guide for the Care and Use of Laboratory
CHAPTER IV–MATERIALS AND METHODS
Animals” prepared by the National Academy of Sciences and published by the National Institutes of Health.
CHAPTER IV–MATERIALS AND METHODS 0 Animal Acclimation TR E AT M E N T Animal’s Sacrifice 4 Doses Group Animal’s Sacrifice 8 Doses Group IN VIVO ASSAYS
A sub-acute experiment was performed using male wistar rats.
According with normal procedure, an acclimatization period of 10 days was assured for all animals. During this period, 24 h urine was collected and behavioral analysis was performed.
Rats were randomly assigned into 2 main groups and then distributed into 6 groups of 5 animals, as illustrated below.
4 Doses Group 8 Doses Group
Control
Mn 4 doses
Control
Mn 8 doses Mn+Ebselen
Ebselen Figure 4 - Experimental Design.
CHAPTER IV–MATERIALS AND METHODS
Solutions of MnCl2 (10 mg/Kg), MnCl2 (10 mg/Kg), plus ebselen (15 mg/Kg), and ebselen
(15 mg/Kg) were prepared and administered by i.p. injection to the rats once daily, for 4 and 8 consecutive days, according with the experimental design. Control animals received daily injections of the equivalent volume of sterile saline.
During the experiment body weight was measured, the behavior was observed and 24h urine was collected, using metabolic cages (Fig. 6).
After anesthetized and before the sacrifice of the rats, blood was collected by cardiac puncture. After collected, blood was divided by two sterile tubes, one for whole blood analyses (heparinized tube) and other for serum.
After the sacrifice of the animals, brain, liver and kidneys were dissected out, rinsed with cold 0.9% sterile saline, dried out in filter paper, weighted and stored in individual polypropylene tubes. All samples were immediately frozen at -80ºC.
Figure 5 – I.p injection technique.
CHAPTER IV–MATERIALS AND METHODS
After the in vivo assay, several parameters were determined using analytical procedures. Mn was measured in brain and blood by atomic absorption spectrometry; Fe in brain was also measured by atomic absorption; GSH was analyzed by high performance liquid chromatography (HPLC) and prolactin levels were determined by an enzyme immunoassay method.
ANALYTICAL METHODS
DETERMINATION OF MN AND FE IN BIOLOGICAL SAMPLES
Microwave-Assisted Acid Digestion - Brain and blood samples were digested prior to GFAAS analysis, with an oxidizing acid mixture of 4:1 (v/v) 65% suprapure nitric acid:hydrogen peroxide (30%). Samples were weighted (80 mg of the brain homogenate) directly on the Teflon cups and 2.9 ml of the oxidizing mixture was added to each cup. The cups were sealed, placed inside the respective bombs (Parr Microwave Acid Digestion Bombs ®) and subjected to microwave irradiation for 30’’ (900 W).
The resulting solutions were transferred to 5 ml volumetric flasks and 100 µl of the chemical modifier magnesium nitrate (Mg(NO3)2·6 H2O) were added to each balloon.
Volumes were completed withdeionized water. Solutions were kept at 4ºC until analysis.
Graphite Furnace Atomic Absorption Spectrometry (GFAAS) - Iron and Mn concentrations were determined by graphite furnace atomic absorption spectrometry (GFAAS), using a PerkinElmer AAnalyst™ 700 atomic absorption spectrometer equipped with an HGA Graphite Furnace , a programmable sample dispenser (AS 800 Auto Sampler), and WinLab 32 for AA software at Laboratório de Métodos Instrumentais de Análise (Faculdade de Farmácia da Universidade de Lisboa). Mg(NO3)2·6 H2O (0.84
CHAPTER IV–MATERIALS AND METHODS
Samples were measured once and every measurement consisted of two injections into graphite furnace. Results were expressed as micrograms of Mn per g of brain tissue and micrograms of Mn per milliliter of blood. Calibration curves were obtained with standard solutions of 10, 15 and 25 µg/L of MnCl2. The limit of quantification determined was 0.05
µg/L.
ANALYSES OF GSH IN BRAIN
Sample Preparation - Brain tissue was homogenized, and samples were weighted (approximately 20 mg). PBS solution was added, 10 times the weight in volume (example: for 20 mg sample add 200 µL of PBS) and samples were macerated. Samples were then sonicated (30 cycles; Conditions: Cycle 0.5, Amplitude 100) and centrifuged for 10’ at 10 000 rpm. The supernatant were collected to 1 ml eppendorfs and samples were analyzed by HPLC.
To prevent oxidation of thiols during sample manipulation (which represents the major problem in such determinations) samples were handled on ice whenever possible and only non-metallic utensils were used.
HPLC analyses - GSH levels in brain tissue were measured by HPLC at the Centro de Patogénese Molecular, Lisboa. HPLC was equipped with a Supelcosil LC-18-S reverse phase column, a Waters 2475 fluorimeter detector and a Waters 2695 separation module. HPLC system was compatible with Water Empower II Software.
DETERMINATION OF PROLACTIN IN SERUM
Serum prolactin was quantified by an enzyme immunoassay (Citomed ®). Plates were read in an Anthos Zenyth 3100 microplate detector. Limit of quantification was 0.6 ng/ml.
CHAPTER IV–MATERIALS AND METHODS
BEHAVIORAL ASSAYS
Behavior is a potencially sensitive endpoint of chemical-induced neurotoxicity. Neurobehavioral tests are recommended in the risk assessment process. Motor activity measurements are accepted as sensitive, reliable, and efficient [89].
Motor activity was assessed on Control and Mn (8 doses) treated groups for two occasions: just before the beginning of the experiment and on the last day of treatment. The order of testing was randomized, and the observer was maintained blind to the treatment of each animal.
Two behavioral parameters were studied: ambulation (number of crossings within 5 min in an open field) and rearing (number of times within 5 min where both forelegs were risen from the floor in the same open field). The floor of the open field measured 60 cm × 90 cm and was divided into six equal squares (Fig. 7 and 8). The floor was surrounded by a 30-cm-high opaque wall. The rats were tested individually, and after each session, the open field was cleaned. Because a large number of environmental conditions can affect motor activity (e.g., sound level, cage design, lighting, temperature, and humidity, or odors), records took place in an independent room, at a fixed hour of the day with controlled light and sound. At the beginning of each session the animals were placed at the centre of the open field, and the behavior of each rat was observed for 5 min [90], [91].
Figure 8 – Experimental apparatus for behavioral assay
Figure 7 - Top view of the experimental apparatus
CHAPTER IV–MATERIALS AND METHODS
STATISTICAL ANALYSIS
All analyses were conducted using MICROSOFT OFFICE EXCEL® 2003 and SPSS STATISTICS® version 16.0, 2007. All results were analyzed for normal distribution with Kolmogorov-Smirnov test. Variables were compared by tests for homogeneity of variance (Levene’s test) and one-way analysis of variance (ANOVA). For multiple comparisons, ANOVA complemented with post hoc Tukey HSD (all pairwise) and Dunnett’s test (pairwise versus control) was performed. Datawas presented as mean values ± standard error of the mean (S.E.M.). Limit for statistical significance was set at p<0.05 (significance level of 95%).
CHAPTER V–RESULTS
R
ESULTSBEHAVIORAL ASSAYS
Behavioral parameters were studied for control and 8 doses groups for two parameters and two times: before the beginning of the experiment and at the end, before the sacrifice of the animals. After observing our results, we can say that MnCl2 treated rats had
decreased spontaneous activity (p<0,05), for both ambulation and rearing (Figures 9 and 10). 0,00 5,00 10,00 15,00 20,00 25,00 30,00 Control Mn 8 doses H o ri z o n ta l A c ti v it y ( c o u n t)
*
Figure 9 – Ambulation in rats exposed to 8 doses of MnCl2 and control
CHAPTER V–RESULTS
BODY WEIGHT AND RELATIVE ORGAN WEIGHT
Along the experiment body weight was registered and it was observed that in treated animals the body weight gain was significantly lower than in control. Treated animals gained significantly less weight than the control groups (Figure 11). If we compare Mn plus ebselen group with either control or 8 doses group, a significant decrease in body weight gain is also observed (Figure 12).
0,00 5,00 10,00 15,00 20,00 25,00 30,00 Control Mn 8 doses V e rt ic a l A c ti v it y ( c o u n t)
*
Figure 10 - Rearing in rats exposed to 8 doses exposure to MnCl2 and
control group. Each bar represents the mean ± S.E.M. (* p < 0.05).
0,000 5,000 10,000 15,000 20,000 25,000 30,000 35,000 40,000 45,000 50,000
Control Mn 4 doses Mn 8 doses
G ro w th r a te ( % )
*
∆
*
Figure 11 - Growth rate of rats. Values are means ± S.E.M. (p<0.0001,
CHAPTER V–RESULTS
Relative organ weight (ROW), the ratio of organ to body weight, was measured for liver and brain. Figures 13-16 show the changes in liver and brain ROW. Brain ROW was increased in all exposed groups but only 8 doses treated rats and Mn plus Ebselen treated rats showed significant differences compared to control (p<0,05).
Liver ROW was significantly increased (p<0,001) in 8 doses Mn-treated group compared to control (Figure 15 and 16).
0,000 10,000 20,000 30,000 40,000 50,000
Control Mn 8 doses Ebselen Mn+Ebselen
G ro w th r a te ( % )
*
*
∆
Figure 12 - Growth rate of the rats. Values are means ± S.E.M. (* p < 0.0001, compared to control; Δ p<0.0001, compared to Mn 8 doses).
Figure 13 - Relative brain weight. Values are means ± S.E.M. (* p < 0.05, compared to control). 0,0000 0,0100 0,0200 0,0300 0,0400 0,0500
Control Mn 4 doses Mn 8 doses
R e la ti v e B ra in W e ig h t (g /g b o d y w e ig h t)
*
CHAPTER V–RESULTS 0,0000 0,0100 0,0200 0,0300 0,0400 0,0500
Control Mn 8 doses Ebselen Mn+Ebselen
R e la ti v e B ra in W e ig h t (g /g b o d y w e ig h t)
*
*
∆
Figure 14 - Relative brain weight. Values are means ± S.E.M. (* p < 0.05, compared to control; Δ p<0.05, compared to ebselen).
0,0000 0,0020 0,0040 0,0060 0,0080 0,0100
Control Mn 4 doses Mn 8 doses
R e la ti v e L iv e r W e ig h t (g /g b o d y w e ig h t)
*
Figure 15 - Relative liver weight. Values are means ± S.E.M. (* p < 0.0001, compared to control).
CHAPTER V–RESULTS
MnCONCENTRATIONS IN BLOOD
At the end of the experiment, Mn was measured in blood. Comparing the two Mn doses, both groups had higher Mn levels in blood but the 4 doses group showed no statistical differences when compared to control (Fig. 17). In the 8 doses group and Mn plus ebselen group significantly higher values of Mn in blood were observed compared to control (p<0,0001) (Fig. 18). 0,0000 0,0020 0,0040 0,0060 0,0080 0,0100
Control Mn 8 doses Ebselen Mn+Ebselen
R e la ti v e L iv e r W e ig h t (g /g b o d y w e ig h t)
*
Figure 16 - Relative liver weight. Values are means ± S.E.M. (* p < 0.0001, compared to control). 0,00 0,10 0,20 0,30 0,40 0,50 0,60
Control Mn 4 doses Mn 8 doses
µg M n /m l b lo o d
*
∆
Figure 17 - Levels of Mn in blood. Bars represent the mean ± S.E.M. (*p< 0.0001, compared to control; Δ p<0,0001, compared to 4 doses group).
CHAPTER V–RESULTS
Mn CONCENTRATIONS IN THE BRAIN
Mn was also measured in brain. If we compare both Mn treated groups (4 and 8 doses) a significant difference between them is observed (Fig. 19).
Brain Mn content increased significantly for all Mn-treated groups. Mn plus ebselen and 8 doses groups had significantly higher levels of Mn in the brain when compared to control (* p<0.0001). The 8 doses group had also higher and significantly different levels than the Mn plus ebselen group (∆ p<0.0001) (Fig. 20).
0,00 0,10 0,20 0,30 0,40 0,50 0,60
Control Mn 8 doses Ebselen Mn+Ebselen
µg M n /m l b lo o d
*
*
∆
Figure 18 - Levels of Mn in blood. Bars represent the mean ± S.E.M. (* p < 0.0001, compared to control; Δ p<0.0001, compared to Mn 8 doses).