FACULDADE DE CIÊNCIAS
DEPARTAMENTO DE QUÍMICA E BIOQUÍMICA
Tricarbonyl Complexes for the Design
of Specific Radiopharmaceuticals for
Endogenous Gene Expression and
Membrane Receptor Imaging
Catarina Alexandra Henriques Xavier Doutoramento em Química
Especialidade de Química Inorgânica
Tese orientada pela Doutora Isabel Rego dos Santos
The work described in this thesis was performed in Grupo de Ciências Radiofarmacêuticas, Unidade de Ciências Químicas e Radiofarmacêuticas, Instituto Tecnológico e Nuclear, Sacavém, Portugal, under supervision of Dr. Isabel Rego dos Santos.
The research project was a collaboration between the Grupo de Ciências Radiofarmacêuticas and the Medicinal Inorganic Chemistry Group, Institute of Inorganic Chemistry, University of Zurich, Switzerland. The work performed in Zurich had the supervision of Prof. Dr. Roger Alberto. The synthesis of Peptide Nucleic Acids and melting temperature studies were performed in the group of Prof. Dr. Stefano Maiorana, in the Dipartimento di Chimica Organica e Industriale, Università degli Studi di Milano, Italy, under supervision of Dr. Clelia Giannini.
The work was financially supported by Fundação para a Ciência e a Tecnologia through the PhD grant SFRH/BD/16680/2004.
À Doutora Isabel Rego dos Santos agradeço a forma empenhada e interessada com que me orientou e todo o apoio científico, essenciais à realização do trabalho. Agradeço ainda o apoio humano e amizade demonstrada.
I would like to thank Prof. Dr. Roger Alberto for the supervision and the opportunity to work in his group that was very important for me and for my scientific career.
I would like to thank Prof. Dr. Stefano Maiorana for the opportunity to do part of my work in his lab. I am grateful to Dr. Clelia Giannini for the supervision and all the support during my time in Milan.
À Prof. Doutora Maria Helena Garcia agradeço ter aceite ser responsável por esta tese na Faculdade de Ciências da Universidade de Lisboa.
À Doutora Lurdes Gano e à Doutora Paula Raposinho agradeço o empenho na realização dos estudos de biodistribuição e ensaios biológicos in vitro, assim como todo o apoio prestado.
À Doutora Fernanda Marques agradeço os estudos de microscopia de fluorescência assim como alguns dos ensaios biológicos in vitro.
À Doutora Célia Fernandes agradeço a sua disponibilidade para resolver todos os problemas relacionados com o HPLC e não só. Agradeço também a sua amizade, boa disposição, a sua capacidade de transmitir conhecimentos e de nunca se recusar a nada e a ninguém.
À Elisabete Correia agradeço a dedicação com que executou os ensaios de biodistribuição e ao Amadeu Rodrigues o apoio técnico.
Ao Doutor Joaquim Marçalo agradeço a disponibilidade na realização de alguns dos espectros de massa apresentados neste trabalho.
Ao Sr. António Soares agradeço a realização das análises elementares de C, H, N e S assim como a sua boa disposição e simpatia.
Ao Doutor José Rino (Instituto de Medicina Molecular) agradeço a realização dos estudos de microscopia de fluorescência.
Aos meus colegas do Grupo de Ciências Radiofarmacêuticas agradeço a colaboração, o incentivo e a forma carinhosa como sempre me trataram. Agradeço em especial às
obrigada pelo apoio no trabalho na parte da “Orange”.
Aos restantes elementos da Unidade de Ciências Químicas e Radiofarmacêuticas agradeço a simpatia com que me receberam e, em particular, agradeço a todos aqueles que, directa ou indirectamente, colaboraram na realização deste trabalho. To Dr. Sergio Dall’Angelo I would like to thank the help in the work with the peptide synthesizer as well as all the help in the lab; thanks for all the good times, good mood and friendship. To other people in the lab, Dr. Paulo, Dr. Giusepe, Lubna, Dr. Marco, Dr. Alberto and others that I do not mention, thanks for the good times, friendship and help. To Dr. Nikos, Dr. Lukas, Dr. Yu, Dr. Paul Schmutz, Dr. Susana, Dr. Fabio, Tooyama and Dr. Selvi thanks for all the help in the lab, friendship and all the good times that we spent together.
To all my Vinzenz friends, especially Utkum, Estelle, Marta, Nerijus, Vaibhav, Tooyama, Yu, Rohit, Ahmad, Tahmineh, Virgil, Irina and Nico, thanks for the good times in the Vinzenz House, for the parties, trips and especially for the company and friendship. Às minhas amigas Orquídea, Raquel, Margarida e Maria João, um especial obrigada pela amizade, pelas conversas, pelos bons momentos passados e apoio. Ao Nuno agradeço o design da capa da tese. Agradeço ao Instituto Tecnológico e Nuclear por me ter acolhido e à Fundação para a Ciência e a Tecnologia pela bolsa de doutoramento (SFRH/BD/16680/2004). À minha família.
A imagiologia molecular é a visualização in vivo de biomoléculas ou processos biológicos associados a certas patologias, por métodos não invasivos e quantitativos, e mediante interacção da molécula alvo com uma sonda molecular. A imagiologia molecular pode ser utilizada para detecção, caracterização e monitorização em tempo real de certas patologias, assim como para seguir o efeito das terapias.
As técnicas nucleares de imagem, tomografia por emissão de fotão único (SPECT) e tomografia por emissão de positrões (PET), são das mais relevantes em imagiologia molecular devido ao seu carácter não invasivo e à sua elevada sensibilidade, características que se devem essencialmente ao facto de utilizarem sondas radioactivas (compostos que têm na sua composição um elemento radioactivo) com elevada actividade específica e especificidade.
A descodificação do genoma humano e consequente desenvolvimento na área da proteómica tem permitido identificar alvos moleculares (receptores, enzimas, genes, etc.) associados a diferentes patologias, com um impacto significativo nas áreas da oncologia e neurologia. A concepção de sondas radioactivas para visualização desses alvos moleculares é uma área de investigação multidisciplinar que necessita da contribuição de disciplinas várias, tais como a medicina, a bioquímica, a biologia molecular, a química e a radioquímica, entre outras.
O principal objectivo do trabalho apresentado nesta tese foi contribuir para o aumento do conhecimento ao nível da concepção de sondas radioactivas para imagiologia molecular por SPECT. Pretendia‐se conceber compostos contendo a unidade fac‐ [99mTc(CO)3]+ estabilizada por ligandos bifuncionais potencialmente tridentados úteis para
visualizar a expressão génica endógena (mRNA N‐MYC) e receptores de membrana (MC1R). Utilizando a mesma unidade metálica e o mesmo tipo de ligandos, pretendia‐se também isolar e avaliar compostos de Re e 99mTc contendo na sua composição um derivado do alaranjado de acridina. Este grupo é fluorescente e intercala no DNA, pelo que estes resultados abririam caminho ao estudo de sondas multimodais e/ou ao estudo do interesse teurapêutico do 99mTc como emissor de electrões Auger. Os ligandos bifuncionais
apresentada no esquema seguinte: Ligandos bifuncionais contendo unidades pirazolo e cisteína para coordenação ao metal e conjugação a biomoléculas (BM) e moléculas fluorescentes (MF).
Para visualizar o mRNA N‐MYC (sobre‐expresso em certos tumores do sistema nervoso central e periférico) foi escolhida uma sequência de ácidos peptídico‐nucleicos (PNA), uma vez que estes ácidos mimetizam o ácido desoxirribonucleico (DNA) e apresentam propriedades notáveis de estabilidade e hibridação com o RNA complementar.
O trabalho iniciou‐se com a síntese e caracterização química e biológica de complexos modelo de Re e 99mTc estabilizados pelos ligandos indicados no esquema acima e contendo unidades de PNA (monómero e dímero). Estes estudos preliminares mostraram que os complexos de 99mTc se formavam com elevado rendimento e pureza radioquímica, apresentavam uma elevada estabilidade in vitro e in vivo e um bom perfil biológico (rápida depuração sanguínea e eliminação renal relativamente rápida). Assim, concluímos que qualquer dos ligandos acima referidos eram adequados para conjugação a uma sequência de PNA clinicamente relevante e posterior ligação à unidade fac‐[99mTc(CO)3]+.
A sequência de PNA escolhida foi N‐A GAT CAT GCC CGG CAT‐C, pois é complementar de uma região do mRNA N‐MYC que pretendíamos visualizar. A preparação de HA GAT CAT GCC CGG CAT‐LysNH2 foi realizada utilizando técnicas de síntese em fase sólida e a sua
conjugação aos dois ligandos bifuncionais apresentados no esquema acima foi realizada com sucesso. A conjugação à cisteína, embora possível, processou‐se com um rendimento muito baixo. Embora este processo de síntese pudesse ser optimizado, limitações de tempo levaram a não prosseguir os estudos com a cisteína. O ligando contendo a unidade pirazolo S NH2 O HO O OH N N N NH2 O OH MF M BM BM M
GAT CAT GCC CGG CAT‐Lys‐NH2 com um rendimento dentro do que seria expectável. O
complexo fac‐[Re(CO)3(3,5‐Me2pz(CH2)2N((CH2)3COOH)(CH2)2NH2]+ foi também conjugado à
sequência HA GAT CAT GCC CGG CAT‐LysNH2, originando fac‐[Re(CO)3(κ3‐Pz‐A GAT CAT GCC
CGG CAT‐Lys‐NH2)]+ (Pz = 3,5‐Me2pz(CH2)2N((CH2)3CO)(CH2)2NH2). Este complexo e a
sequência HA GAT CAT GCC CGG CAT‐LysNH2 foram utilizados em estudos de temperatura
de fusão (Tm) e os resultados obtidos mostraram que a metalação da sequência não afectava
o reconhecimento da sequência complementar, nem a estabilidade do duplex formado com o DNA. O elevado valor de Tm, 83,5 ± 0,1 °C, deixa também prever uma elevada estabilidade in vivo do duplex formado pelo complexo análogo de 99mTc e o mRNA alvo. O complexo análogo de 99mTc, fac‐[99mTc(CO)3(κ3‐Pz‐A GAT CAT GCC CGG CAT‐Lys‐NH2)]2+, foi preparado
quantitativamente fazendo reagir o conjugado Pz‐A GAT CAT GCC CGG CAT‐Lys‐NH2 com fac‐
[99mTc(CO)3(OH2)3]+. Estudos preliminares com células SH‐SY5Y do neuroblastoma
(expressando o N‐MYC), MCF7 do cancro da mama e PC3 do cancro da próstata mostraram uma elevada internalização do complexo fac‐[99mTc(CO)3(κ3‐Pz‐A GAT CAT GCC CGG CAT‐Lys‐
NH2)]2+, assim como uma retenção elevada pelas células SH‐SY5Y. Para que possamos
afirmar que esta retenção resulta da interacção do complexo radioactivo com o mRNA N‐
MYC, são necessários estudos com células IMR32 que sobre‐expressam o mRNA N‐MYC,
assim como experiências controlo utilizando compostos com uma sequência de PNA análoga à que se quer visualizar e/ou com bases diferentes da complementar. O perfil biológico de
fac‐[99mTc(CO)3(κ3‐Pz‐A GAT CAT GCC CGG CAT‐Lys‐NH2)]2+ em ratinhos CD1 mostrou existir
uma elevada retenção do complexo no rim (84,64 ± 6,07 % ID/g 4 h p.i.) e no fígado (24,06 ±
4,99 % ID/g 4 h p.i.). A co‐injeccão do complexo de 99mTc e L‐lisina mostrou que era possível
reduzir em 63% a retenção renal. No entanto, os valores finais obtidos eram ainda elevados. O ligando pirazolo foi também ligado com sucesso a um derivado do alaranjado de acridina (unidade fluorescente e com capacidade de intercalar com o DNA). O conjugado resultante reagiu com fac‐[M(CO)3(OH2)3]+ (M = Re, 99mTc), conduzindo à formação de
complexos tricarbonilo de Re e 99mTc contendo a unidade alaranjado de acridina. O radioconjugado apresentou níveis de internalização celular moderados em células B16F1 do melanoma murino (7,79% após 5 h incubação), sendo que uma percentagem significativa de composto se deslocava rapidamente para o núcleo. Através da microscopia de fluorescência e usando o complexo de Re, foi possível visualizar a sua localização no citoplasma e no
permanecia no citoplasma das células e quanto migrava para o núcleo das mesmas. Tendo em conta que estamos na presença de complexos isoestruturais, a combinação desta informação indica que o que estamos a ver e a quantificar são os complexos de Re e 99mTc na sua forma intacta.
Tendo em conta que o radioconjugado tem na sua composição um emissor de electrões Auger (99mTc) e uma unidade com capacidade para interactuar com o DNA (alaranjado de acridina), e que se consegue chegar ao núcleo das células, foi considerado interessante estudar a radiotoxicidade do complexo de 99mTc para avaliar o potencial interesse deste tipo de compostos na concepção de agentes radioterapêuticos. Os estudos foram realizados com células B16F1 mas não foi observado qualquer efeito radiotóxico, atribuível aos electrões Auger. O perfil biológico do radioconjugado também foi avaliado, apresentando uma elevada retenção no fígado (36.12 ± 12.76 % ID/g 4 h p.i.) e intestino (17.01 ± 5.50 % ID/g 4 h p.i.) e uma excreção total reduzida. Um melhor perfil biológico poderá ser alcançado desde que se aumente o carácter hidrofílico do complexo, o que poderá acontecer quando se conjugar ao complexo um péptido biologicamente activo.
Para visualizar os receptores MC1, sobre‐expressos nas células do melanoma, um análogo cíclico da α‐MSH (hormona estimulante do crescimento dos melanócitos) foi preparado e conjugado ao ligando pirazolo‐diamina. O composto obtido, Pz‐βAla‐Nle‐
cyclo[Asp‐His‐D‐Phe‐Arg‐Trp‐Lys]‐NH2 reagiu com fac‐[99mTc(CO)3(OH2)3]+, conduzindo à
formação de fac‐[99mTc(CO)3‐(κ3‐Pz‐βAla‐Nle‐cyclo[Asp‐D‐Phe‐Arg‐Trp‐Lys]‐NH2)]2+ com
elevado rendimento e pureza radioquímica. O radioconjugado apresentou uma elevada estabilidade in vitro e in vivo. A ciclização levou à obtenção de uma estrutura mais compacta que aumentou a internalização celular (41,8% após 4 h de incubação) e retenção (75% após 4 h de incubação) relativamente ao análogo linear previamente estudado (1,6% e 35,3%, internalização e retenção celular, respectivamente). O complexo fac‐[99mTc(CO)3‐(κ3‐Pz‐βAla‐
Nle‐cyclo[Asp‐D‐Phe‐Arg‐Trp‐Lys]‐NH2)]2+ foi injectado em ratinhos com melanoma tendo‐se
verificado uma fixação elevada no tumor (11,31% ID/g 4 h p.i.), relativamente ao complexo análogo linear (0,99% ID/g 4 h p.i.). Apesar dos bons resultados de retenção tumoral, o perfil biológico deste complexo necessita ser melhorado no que se refere à retenção no rim e à excreção total. Tal melhoria poderá ser alcançada usando agentes bifuncionais mais
The work described in this thesis is focused on the design of 99mTc specific probes for imaging endogenous gene expression (N‐MYC mRNA) or membrane receptors (MC1R). The
fac‐[99mTc(CO)3]+ was the selected core and its conjugation to the biomolecules was
performed using pyrazolyl‐ and cysteine‐containing bifunctional chelators.
We have chosen a PNA sequence for imaging the N‐MYC mRNA, overexpressed in certain tumors. Once there was no experience on the conjugation of the chelators to PNA sequences, model tricarbonyl complexes anchored on cysteine‐ and pyrazolyl‐containing chelators bearing PNA units (monomer and dimer) were synthesized and characterized. The preparation of the 99mTc model complexes in high yield and the favourable tissue distribution profile confirmed the possibility of attaching these chelators to the PNA sequence, H‐A GAT CAT GCC CGG CAT‐LysNH2, complementary to the N‐MYC mRNA. Conjugation of the
cysteine‐containing chelator to the PNA sequence was possible but the resulting conjugate was obtained in very low yield. Optimization of the reaction conditions could certainly be possible, but it was not tried due to time limitations. The pyrazolyl‐containing chelator (Pz‐
Boc) and fac‐[Re(CO)3(3,5‐Me2pz(CH2)2N((CH2)3COOH)(CH2)2NH2]+ (RePz) were conjugated to
the PNA sequence yielding Pz‐A GAT CAT GCC CGG CAT‐Lys‐NH2 and the complex fac‐
[Re(CO)3(κ3‐Pz‐A GAT CAT GCC CGG CAT‐Lys‐NH2)]+. The radioactive analogous fac‐
[99mTc(CO)3(κ3‐Pz‐A GAT CAT GCC CGG CAT‐Lys‐NH2)]2+ was prepared, characterized and
biologically evaluated.
The pyrazolyl‐containing chelator was also conjugated to the fluorescent moiety acridine orange, and isostructural Re and 99mTc tricarbonyl complexes were prepared and evaluated in vitro and in vivo. These preliminary studies were important to evaluate the possibility of designing multimodal probes and/or to explore the Auger emitter 99mTc for therapy.
For imaging the MC1 receptors overexpressed in melanoma cells, a cyclic α‐MSH analogue was conjugated to the pyrazolyl‐containing chelator yielding Pz‐βAla‐Nle‐
cyclo[Asp‐His‐D‐Phe‐Arg‐Trp‐Lys]‐NH2. The fac‐[99mTc(CO)3‐(κ3‐Pz‐βAla‐Nle‐cyclo[Asp‐D‐Phe‐
Arg‐Trp‐Lys]‐NH2)]2+ was prepared and studied with B16F1 murine melanoma cells and with
Complexos específicos Ácidos peptídico‐nucleicos Alaranjado de acridina Visualização da expressão génica endógena Visualização de receptores de membrana
Keywords
Specific complexes Peptide nucleic acids Acridine orange Endogenous gene expression imaging Membrane receptors imagingAcknowledgements... iii Resumo... v Abstract... xi Palavras‐chave...xiii Keywords...xiii Contents...xv Figures...xxi Tables... xxvi Schemes... xxviii Abbreviations... xxx Scope and Aim...1 1. Introduction... 5 1.1. Radiopharmaceuticals ... 5 1.1.1. Diagnosis vs Therapy ... 5 1.1.2. Perfusion and Specific Radiopharmaceuticals ... 10 1.2. Technetium and Rhenium Coordination Chemistry Relevant for Nuclear Medicine ... 16 1.2.1. The Technetium‐ and Rhenium‐Tricarbonyl Core... 19 1.3. Specific Probes for Endogenous Gene Expression and Membrane Receptors Imaging... 22 1.3.1. Antisense Imaging of Endogenous Gene Expression ... 22 1.3.1.1. Peptide Nucleic Acids and Diagnosis... 27 1.3.1.1.1. PNA Labelling with Different Radionuclides for Imaging Endogenous Gene Expression ... 28 1.3.2. Imaging Membrane Receptors with Small Radiopeptides... 34 1.3.2.1. α‐Melanocyte Stimulating Hormone‐Based Radiopharmaceuticals ... 35
2. Evaluation of Chelators for Labelling Biologically Relevant Molecules... 41 2.1. Introduction ... 41 2.2. Evaluation of Two Chelators for Labelling PNA Units ... 42 2.2.1. Synthesis and Characterization of a PNA Monomer and Dimer ... 42 2.2.2. Synthesis and Characterization of Bifunctional Chelators Bearing a PNA Monomer... 47 2.2.3. Synthesis and Characterization of a Bifunctional Chelator Bearing a PNA Dimer... 52 2.2.4. Synthesis and Characterization of Rhenium Tricarbonyl Complexes ... 54 2.2.5. Synthesis, Characterization and Biological Behavior of 99mTc Tricarbonyl Complexes ... 61 2.2.5.1. Stability in the Presence of Cysteine and Histidine... 63 2.2.5.2. Biodistribution and In Vivo Stability... 65 2.3. Synthesis of Tricarbonyl Complexes Bearing Acridine Orange... 69 2.3.1. Synthesis and Characterization of a Pyrazolyl‐Diamine Acridine Orange Conjugate ... 69 2.3.2. Synthesis and Characterization of Rhenium and Technetium Tricarbonyl Complexes Bearing the Acridine Orange Moiety... 74 2.3.3. Studies with B16F1 Cells ... 77 2.3.3.1. Cytotoxicity Studies... 78 2.3.3.2. Cellular Localization by Fluorescence Microscopy Studies... 79 2.3.3.3. Internalization, Retention and Radiotoxicity Studies ... 80 2.3.4. Biodistribution and In Vivo Stability... 86 3. Peptide Nucleic Acids ‐ Synthesis, Conjugation to Bifunctional Chelators, Labelling and Biological Evaluation... 93 3.1. Introduction ... 93 3.2. Solid Phase Synthesis ... 94 3.2.1. Resin ... 95 3.3. PNA Synthesis ... 96 3.4. Automated Solid Phase Synthesis... 98
3.5.1. Synthesis of Fmoc‐A GAT CAT GCC CGG CAT‐Lys‐resin... 100 3.5.2. Synthesis and Characterization of H‐A GAT CAT GCC CGG CAT‐Lys‐NH2... 108 3.6. Synthesis and Characterization of Pz‐A GAT CAT GCC CGG CAT‐Lys‐NH2 and fac‐ [Re(CO)3(κ3‐Pz‐A GAT CAT GCC CGG CAT‐Lys‐NH2)]+... 111 3.7. Coupling of the Cysteine‐Containing Chelator to the PNA Sequence ... 113 3.8. UV‐Melting Temperature ... 114
3.9. Synthesis and Characterization of fac‐[99mTc(CO)3(κ3‐Pz‐A GAT CAT GCC CGG CAT‐ Lys‐NH2)]2+... 116 3.10. In Vitro Stability Studies ... 118 3.11. In Vitro Studies in Cells... 119 3.12. Biodistribution and In Vivo Stability ... 123 3.12.1. Biodistribution... 123 3.12.1.1. Inhibition of Kidney Uptake ... 125 3.12.2. In Vivo Stability... 126 4. Melanoma Targeting with an α‐Melanocyte Stimulating Hormone Analogue Labelled with fac‐[99mTc(CO)3]+... 133 4.1. Introduction ... 133 4.2. Synthesis and Characterization of Pz‐βAla‐Nle‐cyclo[Asp‐His‐DPhe‐Arg‐Trp‐Lys]‐ NH2... 134
4.3. Synthesis of fac‐[99mTc(CO)3‐(κ3‐Pz‐βAla‐Nle‐cyclo[Asp‐D‐Phe‐Arg‐Trp‐Lys] ‐ NH2)]2+... 135
4.4. In Vitro Stability Studies ... 137
4.5. In Vitro Studies in B16F1 Murine Melanoma Cells – Internalization and Cellular Retention ... 138
4.6. Biodistribution and In Vivo Stability of fac‐[99mTc(CO)3‐(κ3‐Pz‐βAla‐Nle‐Asp‐DPhe‐ Arg‐Trp‐Lys‐NH2)]2+... 141
5. Concluding Remarks and Outlook... 149
6. Experimental Part... 159
6.1. Materials ... 159
6.3.1. Tert‐butyl 2‐aminoethylcarbamate (1) ... 166 6.3.2. Methyl 2‐(2‐(tert‐butoxycarbonylamino)ethylamino)acetate (2) ... 166 6.3.3. 2‐(5‐methyl‐2,4‐dioxo‐3,4‐dihydropyrimidin‐1(2H)‐yl) acetic acid (3) ... 167 6.3.4. Methyl‐2‐(N‐(2‐(tert‐butoxycarbonylamino)ethyl)‐2‐(5‐methyl‐2,4‐dioxo‐3,4‐ dihydropyrimidin‐1(2H)‐yl)acetamido)acetate (4)... 168 6.3.5. 2‐(N‐(2‐methoxy‐2‐oxoethyl)‐2‐(5‐methyl‐2,4‐dioxo‐3,4‐dihydropyrimidin‐1(2H)‐ yl)acetamido)ethanaminium 2,2,2‐trifluoroacetate (5)... 169 6.3.6. 2‐(N‐(2‐(tert‐butoxycarbonylamino)ethyl)‐2‐(5‐methyl‐2,4‐dioxo‐3,4‐ dihydropyrimidin‐1(2H)‐yl)acetamido)acetic acid (6)... 169 6.3.7. Methyl N‐[2‐[N’‐[2‐(Boc‐amino)ethyl]‐N’‐(thymin‐1‐ ylacethyl)glycyl]amino]ethyl]‐N‐[(4‐thymini‐1‐yl)acetyl]glycinate (7)... 170 6.3.8. 5,11‐bis(2‐(5‐methyl‐2,4‐dioxo‐3,4‐dihydropyrimidin‐1(2H)‐yl)acetyl)‐3,9‐dioxo‐ 2‐oxa‐5,8,11‐triazatridecan‐13‐aminium 2,2,2‐trifluoroacetate (8)... 171 6.3.9. (R)‐methyl 2,2,11,11‐tetramethyl‐4‐oxo‐3,10‐dioxa‐8‐thia‐5‐azadodecane‐6‐ carboxylate (9)... 172 6.3.10. (R)‐2‐(2‐amino‐3‐methoxy‐3‐oxopropylthio)acetic acid (10) ... 172 6.3.11. Methyl 3‐(2‐oxo‐2‐(perfluorophenoxy)ethylthio)‐2‐(2,2,2‐ trifluoroacetamido)propanoate (11)... 173 6.3.12. Protected Cysteine‐PNA Monomer Conjugate (12)... 173 6.3.13. 2‐amino‐3‐(2‐(2‐(N‐(carboxymethyl)‐2‐(5‐methyl‐2,4‐dioxo‐3,4‐ dihydropyrimidin‐1(2H)‐yl)acetamido)ethylamino)‐2‐oxoethylthio)propanoic acid (13)... 174 6.3.14. Protected Pz‐PNA Monomer Conjugate (14) ... 175 6.3.15. 2‐(N‐(2‐(4‐((2‐aminoethyl)(2‐(3,5‐dimethyl‐1H‐pyrazol‐1‐ yl)ethyl)amino)butanamido)ethyl)‐2‐(5‐methyl‐2,4‐dioxo‐3,4‐dihydropyrimidin‐ 1(2H)‐yl)acetamido)acetic acid (15)... 176 6.3.16. Protected Pz‐PNA Dimer Conjugate (16) ... 177 6.3.17. Deprotected Pz‐Dimer (17) ... 178 6.4. Synthesis of the Rhenium Complexes 18 – 21... 179 6.4.1. Synthesis of fac‐[Re(CO)3(κ3‐ 13)] (18)... 179 κ3
6.5. Synthesis of 99mTc(I) Complexes 21 – 23 ... 182 6.5.1. General Method for Preparing the 99mTc Complexes ... 183 6.5.1.1. Synthesis of fac‐[99mTc(CO)3(κ3‐13)] (21)... 183 6.5.1.2. Synthesis of fac‐[99mTc(CO)3(κ3‐15)]+ (22)... 183 6.5.1.3. Synthesis of fac‐[99mTc(CO)3(κ3‐17)]+ (23)... 184 6.6. Synthesis of compounds 24 – 33... 184 6.6.1. 2‐(4‐bromobutyl) isoindoline‐1,3‐dione (24) ... 184 6.6.2. 3,6‐bis(dimethylamino)‐10‐(4‐(1,3‐dioxoisoindolin‐2‐yl)butyl)acridinium (25) 185 6.6.3. 10‐(4‐Amino‐butyl)‐3,6‐bis‐dimethylamino‐acridinium (26) ... 185 6.6.4. Ethyl 3‐acetyl‐4‐oxopentanoate (27) ... 186 6.6.5. Tert‐butyl 2‐(2,4‐dinitrophenylsulfonamido)ethylcarbamate (28)... 186 6.6.6. Ethyl‐2‐(1‐(2‐hydroxyethyl)‐3,5‐dimethyl‐1H‐pyrazol‐4‐yl)acetate (29) ... 187 6.6.7. Ethyl 2‐(1‐(2‐(N‐(2‐(tert‐butoxycarbonylamino)ethyl)‐2,4‐ dinitrophenylsulfonamido)ethyl)‐3,5‐dimethyl‐1H‐pyrazol‐4‐yl)acetate (30) . 188 6.6.8. 2‐(1‐(2‐(2‐(tert‐butoxycarbonylamino)ethylamino)ethyl)‐3,5‐dimethyl‐1H‐ pyrazol‐4‐yl)acetic acid (31) ... 188 6.6.9. 10‐(4‐(2‐(1‐(2‐(2‐(tert‐butoxycarbonylamino)ethylamino)ethyl)‐3,5‐dimethyl‐1H‐ pyrazol‐4‐yl)acetamido)butyl)‐3,6‐bis(dimethylamino)acridinium (32) ... 189 6.6.10. 10‐(4‐(2‐(1‐(2‐(2‐aminoethylamino)ethyl)‐3,5‐dimethyl‐1H‐pyrazol‐4‐ yl)acetamido)butyl)‐3,6‐bis(dimethylamino)acridinium (33) ... 190 6.6.11. Synthesis of fac‐[Re(CO)3(κ3‐42)]2Br (34) ... 191 6.6.12. Synthesis of fac‐[99mTc(CO)3(κ3‐33)]2+ (35)... 192 6.7. Synthesis of Peptide Nucleic Acids ... 192 6.7.1. Synthesis of N‐α‐Fmoc‐L‐Lys(Boc)‐resin Novasyn TGR‐PEG‐PS (36)... 192 6.7.1.1. Resin Loading ... 193 6.7.2. Automated Solid Phase Synthesis of Peptide Nucleic Acids on the ABI 433A Synthesizer ... 195 6.7.2.1. Automated Synthesis of Fmoc‐A GAT CAT GCC CGG CAT‐Lys‐resin (37).... 195 6.7.2.1.1. General Cleavage Procedure ... 196 6.7.3. Manual Solid Phase Synthesis of Peptide Nucleic Acids ... 197
6.7.3.2. H‐A GAT CAT GCC CGG CAT‐Lys‐NH2 (38) ... 198
6.7.3.3. Synthesis of Pz‐A GAT CAT GCC CGG CAT‐Lys‐NH2 (39) and fac‐[Re(CO)3(κ3‐
Pz‐A GAT CAT GCC CGG CAT‐Lys‐NH2)]+ (40)... 199
6.7.3.4. Synthesis of Cyst‐A GAT CAT GCC CGG CAT‐Lys‐NH2 (41)... 201
6.7.4. Synthesis of fac‐[99mTc(CO)3(κ3‐Pz‐A GAT CAT GCC CGG CAT‐Lys‐NH2)]2+ (42) . 202 6.8. Synthesis of compounds 43 – 44... 202
6.8.1. Synthesis of Pz‐βAla‐Nle‐cyclo[Asp‐His‐DPhe‐Arg‐Trp‐Lys]‐NH2 (43) ... 202
6.8.2. Synthesis of fac‐[99mTc(CO)3(κ3‐Pz‐βAla‐Nle‐cyclo[Asp‐Dphe‐Arg‐Trp‐Lys]‐NH2]2+
(44) ... 203 6.9. Partition Coefficient ... 204 6.10. In Vitro Stability Studies ... 204 6.10.1. Stability in the Presence of Cysteine and Histidine... 204 6.10.2. Stability in Fresh Human Serum ... 205 6.10.3. Stability in PBS with 0.2% BSA... 205 6.10.4. Stability in Cell Medium ... 205 6.11. Cell Studies... 205 6.11.1. Cell Cultures ... 206 6.11.2. Cellular Internalization and Retention Studies ... 207 6.11.3. Nuclear Internalization... 207 6.11.4. Cell Viability... 208 6.11.5. Cytotoxicity of Compounds 33 and 34 ... 208 6.11.6. Radiotoxicity of fac‐[99mTc(CO)3(κ3‐33)]2+ (35)... 209 6.11.7. Evaluation of Cell Uptake by Fluorescence Microscopy ... 209 6.12. Biodistribution and In Vivo Stability ... 210 6.12.1. Biodistribution Studies ... 210 6.12.1.1. Biodistribution Studies in CD‐1 Female Mice... 210 6.12.1.2. Biodistribution Studies in C57BL/6 female mice... 213 6.12.2. In Vivo Stability/Metabolization... 215 References...219
Figure 1.1 – Schematic representation of Auger electrons, α and β‐ particles path lengths
in a cellular and subcellular environment (arbitrary scaling). 8
Figure 1.2 – Structures of two specific radiopharmaceuticals in clinical use. 13
Figure 1.3 – Representation of three approaches used in the design of specific metal‐
based radiopharmaceuticals. 14
Figure 1.4 – Rhenium complexes which mimic the structure of dihydrotestosterone,
progesterone and estradiol. 14
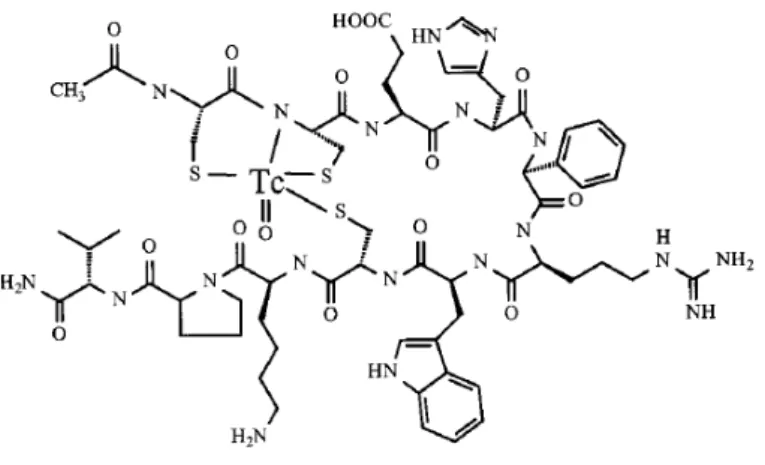
Figure 1.5 – Structural model of 99mTc‐CCMSH for melanoma imaging. 15
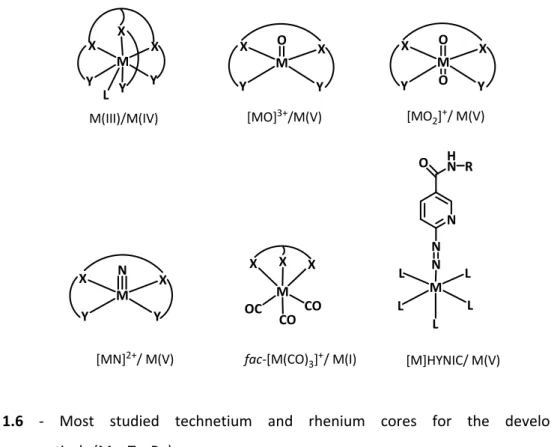
Figure 1.6 – Most studied technetium and rhenium cores for the development of
radiopharmaceuticals (M = Tc, Re). 18
Figure 1.7 – IsoLink® kit and synthesis of fac‐[99mTc(CO)3(OH2)3]+. 19 Figure 1.8 – Examples of bidentate and tridentate bifunctional chelating agents for the
tricarbonyl core. 21
Figure 1.9 – Schematic illustration of the reporter gene approach. 23
Figure 1.10 – Schematic image showing the radiolabelled antisense oligonucleotide
upon hybridization to the complementary target mRNA. 24 Figure 1.11 – Illustration of antisense hybridization imaging approach. 24 Figure 1.12 – General structure of some DNA and RNA analogues and artificial analogues used in antisense imaging. 27 Figure 1.13 – DNA and aminoethylglycine‐PNA backbones. 28 Figure 1.14 – Proposed structure for 99mTc‐N‐GlyD(Ala)GlyGly‐Aba‐GCATCGTCGCGG. 29
Figure 1.15 – Illustration of 99mTc‐AcGlyD(Ala)GlyGlyAba‐PNA‐AEEA‐D(CysSerLysCys) conjugates designed to bind to IGF1 receptor, internalize and hybridize
with the CCND1 or c‐MYC mRNA. 30
Figure 1.16 – Illustration of M‐N2S2‐K‐RAS PNA‐IGF1 peptide probes (M = 99mTc or 64Cu). 31 Figure 1.17 – Illustration of 64Cu‐DOTA‐KRAS PNA‐IGF1 peptide radiohybridization probe
designed to bind to the IGF1 receptor, internalize and hybridize with
KRAS mRNA. 32
BCL‐2 mRNA. 33
Figure 1.20 – Structures of DOTA‐ReCCMSH(Arg11) for labelling with 111In and 64Cu, and
CBTE2A‐ReCCMSH(Arg11) for labelling with 64Cu. 38
Figure 2.1 – 1H NMR spectrum of PNA monomer 4 in CDCl3. 46
Figure 2.2 – 1H NMR spectrum of PNA dimer 7 in CD3OD. 46
Figure 2.3 – Mass spectrum of compound 7 in the negative mode obtained by
ESI/QITMS. 47
Figure 2.4 – 1H NMR spectrum of compound 12 in dmso‐d6. 49
Figure 2.5 – 13C NMR spectrum of compound 12 in dmso‐d6. 50
Figure 2.6 – 1H NMR spectrum of compound 15 in CD3OD. 51
Figure 2.7 – 1H NMR spectrum of compound 17 in CD3OD. 53
Figure 2.8 – Mass spectrum of compound 17 in the positive mode obtained by
ESI/QITMS. 53
Figure 2.9 – Mass spectrum of compound 18 in the negative mode obtained by
ESI/QITMS. 55
Figure 2.10 – IR spectra of compounds 18, 19 and 20 (KBr). 56
Figure 2.11 – 1H‐1H g‐COSY spectrum of complex 19 in CD3OD and respective
attributions. 57
Figure 2.12 – Expansion of the 1H‐1H g‐COSY spectrum of complex 19 in the range 5 – 1.2
ppm. 58
Figure 2.13 – 1H NMR spectrum of compound 18 in CD3OD. 60
Figure 2.14 – Analytical RP‐HPLC chromatograms of Re complexes 18 (a), 19 (c) and 20 (e) (254 nm), and corresponding 99mTc complexes 21 (b), 22 (d) and 23 (f) (γ trace). 62 Figure 2.15 – Stability of 21 and 23 in the presence of excess of histidine and cysteine (37 °C , PBS pH 7.4). 64 Figure 2.16 – Biological data for complexes 21 and 23 66 Figure 2.17 – Analytical RP‐HPLC chromatograms of complex 23, urine and blood serum samples collected 1 h after injection (γ trace). 67 1
ESI/QITMS. 73
Figure 2.20 – 1H NMR spectrum of compound 33 in D2O. 74
Figure 2.21 – 1H NMR spectrum of complex 43 in CD3OD. 76
Figure 2.22 – Analytical RP‐HPLC chromatograms of the Re complex 34 (254 nm) and the purified 99mTc complex 35 (γ trace). 77 Figure 2.23 – Confocal fluorescence microscopy images of B16F1 murine melanoma cells after 3 h of exposure to 60 μM of compound 33 and complex 34 (green colour) followed by fixation and DNA staining with DAPI (blue colour). 80 Figure 2.24 – Internalization at 37 °C of the radioconjugate 35 in B16F1 cells at different time‐points. 82 Figure 2.25 – Internalization at 37 °C expressed as a percentage of total activity for the non‐purified and purified radioconjugate 35 (mean ± standard deviation, n = 3). 82
Figure 2.26 – Nuclear internalization at 37 °C in B16F1 murine melanoma cells of
purified and non‐purified radiocomplex 35 (mean ± standard deviation, n
= 3). 83
Figure 2.27 – Activity internalized in the nucleus (white and black) and activity outside
the nucleus (black) in B16F1 murine melanoma cells, after incubation with purified or non‐purified radiocomplex 35 (mean ± standard
deviation, n = 3). 84
Figure 2.28 – Cellular retention of the internalized radioconjugate 44 (purified and non‐
purified) in B16F1 cells over time at 37 °C (mean ± standard deviation, n =
3). 85
Figure 2.29 – Cytotoxicity studies of purified radioconjugate 35 (0.9 – 60 μCi), TcO4‐ =
[99mTcO4]‐ (40 μCi), Carb. = [99mTc(CO)3(OH2)3]+ (40 μCi ) and Pz‐Ao =
compound 33 (2 x 10‐9 M) in B16F1 cells at 37 °C (mean ± standard
deviation, n = 4). 86
Figure 2.30 – Analytical RP‐HPLC chromatograms of compound 35, blood serum and
urine samples collected 1 h after injection (γ trace). 88
Figure 3.2 – Peptide synthesizer Applied Biosystems ABI 433A. 99
Figure 3.3 – Calibration curve for DBU/DMF deprotection of Fmoc‐Lys and quantification
by gas chromatography. 101
Figure 3.4 – Automated synthesis (ABI 433A): RP‐HPLC chromatogram of the crude
product Fmoc‐A GAT CAT GCC CGG CAT‐Lys (Absorbance at 260 nm). 109
Figure 3.5 – Manual synthesis: RP‐HPLC chromatogram of the crude product Fmoc‐ A
GAT CAT GCC CGG CAT‐Lys (Absorbance at 260 nm). 109
Figure 3.6 – Analytical RP‐HPLC chromatograms of 39 (left) and 40 (right), after
purification (Absorbance at 260 nm). 112 Figure 3.7 – LC‐ESI/QITMS of the crude product 41. A) HPLC chromatogram at 260 nm. B) ESI/QITMS of the peak at 17.70 min. 114 Figure 3.8 – Melting profiles of 40:DNA (gray curve) and 38:DNA (black curve). 115 Figure 3.9 – Analytical RP‐HPLC chromatograms of 40 (absorbance at 260 nm) and 42 ( γ trace). 117 Figure 3.10 – Analytical RP‐HPLC chromatogram of the reaction of 38 with [99mTc(CO)3]+. 117 Figure 3.11 – Analytical RP‐HPLC chromatograms of fac‐[99mTc(CO)3(κ3‐Pz‐ A GAT CAT
GCC CGG CAT‐Lys‐NH2)]+2 (42) in human serum at 37 °C, at different time
points (γ trace). 118
Figure 3.12 – Analytical RP‐HPLC chromatogram of 42 after 4 h incubation at 37 °C in
culture medium (γ trace) 119
Figure 3.13 – ITLC‐SG chromatogram of compound 42 after 4 h incubation at 37 °C in
culture medium (γ trace). 119
Figure 3.14 – Cell‐associated radioactivity and cellular internalization of 42 at different
time points (37 °C) in SH‐SY5Y cells (A), MCF7 cells (B) and PC3 cells (C). 120
Figure 3.15 – Cellular internalization in SH‐SH5Y, MCF7 and PC3 cells at different time
points (37 °C). 121
Figure 3.16 – Cellular retention of internalized radioconjugate 42 in SH‐SY5Y cells over
time at 37 °C (mean ± standard deviation, four replicates) 121
Figure 3.17 – Uptake of fac‐[99mTc(CO)3(κ3‐Pz‐A GAT CAT GCC CGG CAT‐Lys‐NH2)]2+ (42)
in some more relevant organs (CD‐1 Charles River mice at 1 and 4 h after
CAT‐Lys‐NH2)]2+ (42) and fac‐[99mTc(CO)3(κ3‐17)]+ (23) in CD‐1 Charles
River female mice. 124
Figure 3.19 – Reversed‐phase HPLC chromatograms of the injected preparation of
complex 42, blood serum, urine and liver homogenate samples collected
1 h after injection and treated before analysis (γ trace). 127
Figure 4.1 – Structure of Pz‐βAla‐Nle‐cyclo[Asp‐His‐D‐Phe‐Arg‐Trp‐Lys]‐NH2 (43). 135 Figure 4.2 – Analytical RP‐HPLC chromatogram of purified of Pz‐βAla‐Nle‐cyclo[Asp‐D‐
Phe‐Arg‐Trp‐Lys]‐NH2 (43) 135
Figure 4.3 – RP‐HPLC chromatogram of fac‐[99mTc(CO)3‐(κ3‐Pz‐βAla‐Nle‐c[Asp‐D‐Phe‐Arg‐
Trp‐Lys]‐NH2)]2+ (44) (γ trace). 136
Figure 4.4 – TLC chromatogram of 44, after 24 h incubation at 37 °C in culture medium
(γ trace). 137
Figure 4.5 – Analytical RP‐HPLC chromatogram of fac‐[99mTc(CO)3‐(κ3‐Pz‐βAla‐Nle‐ cyclo[Asp‐D‐Phe‐Arg‐Trp‐Lys]‐NH2)]2+ after incubation in human serum at
37 °C at different time points (γ trace). 138
Figure 4.6 – Cell studies of the radioconjugate 44 in B16F1 cells at different time points
and temperatures. 139
Figure 4.7 – Cellular retention of internalized cyclic radioconjugate 44 in B16F1 cells
over time at 37 °C (mean ± standard deviation, n = 3). 140
Figure 4.8‐ Biodistribution results (% ID/organ) and total excretion (% ID) of the fac‐
[99mTc(CO)3‐(κ3‐Pz‐βAla‐Nle‐c[Asp‐DPhe‐Arg‐Trp‐Lys]‐NH2)]2+ (44) in
B16F1 murine melanoma‐bearing C57BL/6 mice at 1, 4 and 24 h after
intravenous injection. 142
Figure 4.9 – RP‐HPLC chromatograms of complex 44, blood serum and urine samples
collected 1 h after injection (γ trace). 145
Table 1.1 ‐ γ emitters used in SPECT. 6
Table 1.2 – Positron emitters used in PET. 7
Table 1.3 – Range of Auger electrons, β‐and α particles in tissues. 8
Table 1.4 – Some radionuclides in clinical use or potentially interesting for therapy. 9
Table 1.5 – Perfusion radiopharmaceuticals for diagnosis in clinical use. 11
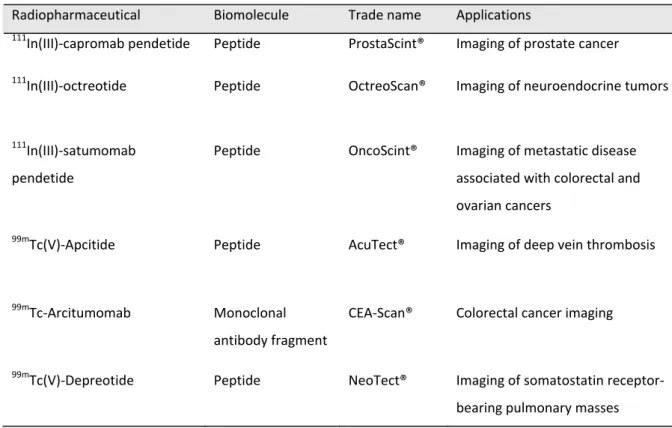
Table 1.6 – Specific radiopharmaceuticals for diagnosis in clinical use. 12
Table 1.7 – Regulatory peptides, their function, target disease, cells expressing
receptors, and receptor subtypes. 35
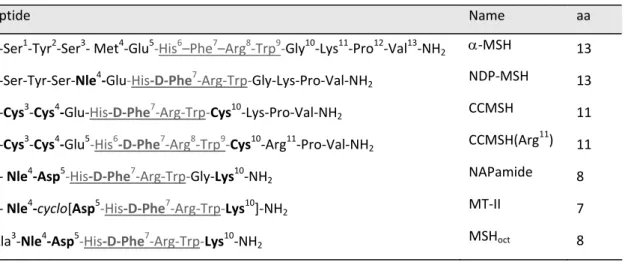
Table 1.8 – Structure of α‐melanocyte stimulating hormone (α‐MSH) and some α‐MSH
analogues. 37
Table 2.1 – Experimental conditions used to synthesize complexes 21 – 23 and
respective retention times. 63
Table 2.2 – Biodistribution results of the 99mTc compounds 21 and 23 at 1 and 4 h after
intravenous injection (mean ± standard deviation, n = 3). 66
Table 2.3 – Biodistribution of the radioconjugate 35 in CD1 female mice at 1 and 4 h
after intravenous injection (mean ± standard deviation, n = 4). 87
Table 3.1 – Commonly used protecting groups for PNA synthesis. 97
Table 3.2 – Biodistribution data of the fac‐[99mTc(CO)3(κ3‐Pz‐A GAT CAT GCC CGG CAT‐
Lys‐NH2)]2+ (42) in CD‐1 Charles River mice, at 1 and 4 h after intravenous
injection (mean ± standard deviation, n = 4). 123
Table 3.3 – Biodistribution results of fac‐[99mTc(CO)3(κ3‐Pz‐A GAT CAT GCC CGG CAT‐Lys‐
NH2)]2+ (42) with coinjected or not L‐Lys (15 mg) in CD‐1 Charles River
mice, at 4 h after intravenous injection (mean ± standard deviation, n =
4). 126
Table 4.1 – Biodistribution of fac‐[99mTc(CO)3‐(κ3‐Pz‐βAla‐Nle‐cyclo[Asp‐D‐Phe‐Arg‐Trp‐
5). 141
Table 4.2 – Biodistribution of 44 co‐injected or not with 15 mg of L‐lysine in healthy
C57BL/6 mice, at 1h after intravenous injection (mean ± standard
deviation, n = 5). 144 Table 6.1 – Calculations for the calibration curve by gas chromatography. 194 Table 6.2 – Data for calculating the Fmoc substitution (FS). 194 Table 6.3 – Experimental conditions for the automated synthesis. 195 Table 6.4 – Experimental conditions for the manual synthesis. 197 Table 6.5 – Experimental conditions for the synthesis of compound 39. 199 Table 6.6 – Experimental conditions for the synthesis of compound 40. 200 Table 6.7 – Experimental conditions for the synthesis of compound 41. 201 Table 6.8 – Biodistribution results of the 99mTc compounds 21 and 23 at 1 and 4 h in CD‐ 1 Charles River mice, after intravenous injection (mean ± standard
deviation, n = 3). 211
Table 6.9 – Biodistribution results of the 99mTc compound 35 at 1 and 4 h in CD‐1 Charles River mice, after intravenous injection (mean ± standard deviation, n = 4). 212
Table 6.10 – Biodistribution results of the 99mTc compound 42 at 1 and 4 h in CD‐1 Charles River mice, after intravenous injection (mean ± standard
deviation, n = 4). 212
Table 6.11 – Biodistribution results of the 99mTc compound 42 co‐injected with lysine at 4 h in CD‐1 Charles River mice, after intravenous injection (mean ±
standard deviation, n = 5). 213
Table 6.12 – Biodistribution results of the 99mTc compound 44 in B16F1 murine melanoma‐bearing C57BL/6 mice at 1, 4 and 24 h after intravenous
injection (mean ± standard deviation, n = 4 ‐ 5) 214
Table 6.13 – Biodistribution of the 99mTc compound 44 co‐injected with 15 mg of L‐lysine in healthy C57BL/6 mice, at 1 h after intravenous injection (mean ±
standard deviation, n = 4). 215
Scheme 2.1 – Pyrazolyl‐ and cysteine‐containing bifunctional chelators for coordination
to the metal and conjugation to biomolecules (BM) and fluorescent
molecule (FM). 41 Scheme 2.2 – Synthesis of the protected PNA backbone (2). 42 Scheme 2.3 – Synthesis of the PNA monomer (4). 43 Scheme 2.4 – Synthesis of a PNA Dimer (7). 44 Scheme 2.5 – cis and trans PNA rotamers. 45 Scheme 2.6 – Synthesis of compounds 9 – 13. 48 Scheme 2.7 – Synthesis of the conjugate 15. 49 Scheme 2.8 – Synthesis of 17. 52 Scheme 2.9 – Synthesis of the rhenium complexes 18, 19 and 20. 54 Scheme 2.10 – Synthesis of 99mTc complexes 21, 22 and 23. 61 Scheme 2.11 – Synthesis of compound 26. 70 Scheme 2.12 – Synthesis of compound 31. 71 Scheme 2.13 – Synthesis of compound 33. 72 Scheme 2.14 – Synthesis of rhenium (34) and technetium (35) complexes. 75 Scheme 3.1 – Download of the resin. 100 Scheme 3.2 – Piperidine vs. DBU cleavage of the Fmoc group. 101 Scheme 3.3 – Synthesis cycle of Fmoc‐A GAT CAT GCC CGG CAT‐Lys‐resin (37). 103 Scheme 3.4 – Removal of the Fmoc protecting group with piperidine. 104 Scheme 3.5 – Base catalyzed reactions of the amine terminus. 105 Scheme 3.6 – PNA monomer activation with HATU. 106 Scheme 3.7 – Coupling of the activated monomer to the growing PNA chain. 106 Scheme 3.8 – Potential guanidine by‐product when using HATU. 107 Scheme 3.9 – Acetylation of the oligomer with acetic anhydride. 107 Scheme 3.10 – Synthesis of the PNA sequences 38 and conjugates 39 and 40. 111 Scheme 3.11 – Synthesis of conjugate 41. 113
CGG CAT‐Lys‐NH2)]2+ (42). 116
Scheme 4.1 – Synthesis of the radioconjugate fac‐[99mTc(CO)3‐(κ3‐Pz‐βAla‐Nle‐cyclo[Asp‐
His‐D‐Phe‐Arg‐Trp‐Lys]‐NH2)]2+ (44). 136
Scheme 5.1 ‐ Pyrazolyl‐ and cysteine‐containing bifunctional chelators. 149
Scheme 5.2 ‐ Illustration of the main compounds described in this thesis – tricarbonyl
metal complexes and PNA conjugates. 155
A A Adenine aa Amino acid Aba 4‐Aminobutyric acid Ac Acetyl Ac2O Acetic anhydride AEEA Aminoethoxyethoxyacetic acid aeg Aminoethylglycine Ao Acridine orange Arg Arginine ASON Antisense oligonucleotide Asp Aspartate B BFCA Bifunctional chelating agent Bhoc Benzylhydryloxycarbonyl Boc Tert‐butoxycarbonyl Bq Becquerel br Broad C C Cytosine CBTE2A 4,11‐Bis(carboxymethyl)‐1,4,8,11‐tetraazabicyclo[6.6.2]hexadecane Cbz Benzyloxycarbonyl Ci Curie (1 Ci = 3.7 x 10⁷ Bq) Cys Cysteine D d Doublet DBF Dibenzofulvene DBU 1,8‐Diazabicyclo[5.4.0]undec‐7‐ene DCA Dichloroacetic acid
DIPEA N,N‐Diisopropylethylamine DMF N,N‐Dimethylformamide DNA Deoxyribonucleic acid DOTA 1,4,7,10‐tetraazacyclododecane‐N,N’,N’’,N’’’‐tetracetic acid DTPA Diethylenetriaminepentaacetic acid E ESI Electrospray ionization EtOH Ethanol F FDA Food and Drug Administration FDG Fluorodeoxyglucose Fmoc 9‐Fluorenylmethoxycarbonyl FTICR Fourier Transform Ion Cyclotron Resonance G G Guanine GC Gas chromatography Glu Glutamic acid Gly Glycine H h Hour HATU 2‐(1H‐7‐Azabenzotriazol‐1‐yl)‐1,1,3,3‐tetramethyluronium hexafluorophosphate HBTU 2‐(1H‐Benzotriazole‐1‐yl)‐1,1,3,3‐tetramethyluronium hexafluorophosphate His Histidine HPLC High‐performance liquid chromatography HYNIC 6‐Hydrazinopyridine‐3‐carboxylic acid I IR Infrared ITLC Instant thin‐layer chromatography ITN Instituto Tecnológico e Nuclear
LC Liquid chromatography Lys Lysine M m Multiplet MAG3 Mercaptoacetyl‐triglycine Met Methionine min Minute Mmt Monomethoxytrityl or 4‐methoxyphenyldiphenylmethyl mRNA Messenger ribonucleic acid MS Mass spectrometry MSH Melanocyte‐stimulating hormone N Nle Norleucine NMP N‐methylpyrrolidone NMR Nuclear Magnetic Resonance P PBS Phosphate buffer saline PE Polyethylene PEG Polyethylene glycol PET Positron emission tomography Phe Phenylalanine p.i. Post injection PNA Peptide nucleic acid ppm Part per million Pro Proline PS Polystyrene Pz 3,5‐Me2pz(CH2)2N((CH2)3CO)(CH2)2NH2
Pz‐Boc 3,5‐Me2pz(CH2)2N((CH2)3COOH)(CH2)2NHBoc
Q
quint Quintuplet
R
RePz fac‐[Re(CO)3(3,5‐Me2pz(CH2)2N((CH2)3COOH)(CH2)2NH2]+
Rf Retention factor RGD Arginine‐glycine‐aspartic acid RNA Ribonucleic acid RNase H Ribonuclease H RP Reversed phase rpm Rotation per minute S s Singlet Ser Serine SPECT Single Photon Emission Computed Tomography SPPS Solid Phase Peptide Synthesis T t Triplet T Thymine t1/2 Semi‐disintegration period or Half‐life TBTU 2‐(1H‐Benzotriazole‐1‐yl)‐1,1,3,3‐tetramethyluronium tetrafluoroborate TFA Trifluoroacetic acid TFMSA Trifluormethanesulfonic acid TGR TentaGel Rink Amide THF Tetrahydrofuran TIS Triisopropylsilane Tm Melting temperature tR Retention time Trp Triptophan Tyr Tyrosine V Val Valine
κ Denticity
δ Chemical shift
ν Frequency
Recent advances in non‐invasive imaging modalities have opened endless opportunities for molecular diagnostic and therapeutic procedures.
Molecular imaging is the visualization of in vivo biological or biochemical processes associated with certain pathologies, at the cellular or molecular level. The target molecule is visualized in vivo by virtue of its interaction with a molecular imaging probe. Molecular imaging may be used for early detection, characterization and real‐time monitoring of diseases as well as for the follow‐up of therapies.
In recent years, the field of molecular imaging has broadened and includes different imaging modalities. The most explored are computed tomography (CT), magnetic resonance imaging (MRI), ultrasound (US), nuclear imaging (single photon emission computed tomography (SPECT) and positron emission tomography (PET)), fluorescence and bioluminescence imaging (BLI). From all these only fluorescence and bioluminescence imaging are not in clinical use. From the clinical point of view CT, MRI and US provide anatomical and morphological information and are in widespread clinical use. On the other hand, PET and SPECT are the ones in clinical use that can provide physiological, functional and molecular information.1
Nuclear molecular imaging with PET and SPECT represent the prototype for non‐ invasive quantitative tracing of biochemical processes in vivo, because radioactive probes can be synthesized at sufficiently high specific activity, enabling the use of tracer concentrations to detect small‐capacity molecular systems in vivo without interfering with the processes being studied. These two techniques have some advantages such as sensitivity, the availability and specificity of radioactive probes, good temporal resolution (seconds to minutes) and fast examination time (minutes to hours).2
The decoding of the human genome and subsequent developments in proteomics enabled the identification of a new spectrum of targets (receptors, enzymes, genes, etc.) associated with certain pathologies, with a significant impact in areas such as oncology and neurology. However, the development of specific probes for imaging such targets is a great challenge and a demanding task. To achieve such task the contribution of disciplines such as
highly desired.
The main goal of the work described in this thesis was to contribute for the design of radioactive probes for molecular imaging. Our work was based on the radionuclide 99mTc, which still motivates an intense research, due to its ideal properties for SPECT imaging, interesting chemistry, availability and cost. We have explored the chemistry and radiochemistry of the recently introduced fac‐[M(CO)3]+ (M = Re, 99mTc) core using
bifunctional chelating agents bearing vectors with interest for imaging endogenous gene expression as well as membrane receptors. Isostructural Re/99mTc tricarbonyl compounds bearing an acridine‐orange moiety were also studied aiming to explore in a latter stage multimodal probes and/or the utility of 99mTc as a therapeutic agent.
This thesis is organized in six chapters. In the first chapter a brief and general introduction is presented, giving particular attention to the work published about endogenous gene expression imaging and membrane receptors imaging, namely the MC1R. The second chapter is divided in two parts. In the first part are described the synthesis and characterization of the model tricarbonyl complexes anchored on pyrazolyl‐ and cysteine‐ containing chelators bearing PNA units (monomer and dimer) and the biological evaluation of the 99mTc complexes. In the second part of the chapter, the conjugation of the pyrazolyl‐ containing chelator to an acridine orange moiety is described as well as the synthesis and characterization of the isostructural Re and 99mTc tricarbonyl complexes. In vitro and in vivo studies will be also presented and discussed. In the third chapter are described the synthesis and characterization of a PNA sequence with clinical relevance, its conjugation to the bifunctional chelators evaluated in the second chapter, the preparation of Re and 99mTc complexes and the biological evaluation of the 99mTc complex. In the fourth chapter are presented the conjugation of the pyrazolyl‐containing chelator to a cyclic α‐MSH analogue, the labelling of the resulting conjugate with the fac‐[99mTc(CO)3]+, and the in vitro and in vivo
studies with the 99mTc complex. The conclusions as well as some suggestions for future work are presented in the fifth chapter. Finally, in the sixth chapter, experimental details about the work presented in chapters 2 ‐ 4 are described.
1.
Introduction
1.
Introduction
1.1. Radiopharmaceuticals
Radiopharmaceuticals are drugs containing a radionuclide in its composition, used routinely in nuclear medicine for the diagnosis or therapy of various diseases. These drugs are used in tracer quantities and therefore have no pharmacological effects. A radiopharmaceutical can be a small organic molecule or an inorganic or organometallic complex which can contain or not in its composition a biologically active molecule. These biologically active molecules can be macromolecules, such as monoclonal antibodies or antibody fragments, small peptides, inhibitors or substrates of enzymes, among others.
A radiopharmaceutical approved for clinical use should be sterile, apyrogenic and of safe administration. Almost all radiopharmaceuticals are administered via intravenous injection but they can also be administered orally (gastric emptying) or by inhalation (pulmonary ventilation).3
The radionuclide, essential in the composition of a radiopharmaceutical, is an unstable nuclide which undergoes a radioactive decay emitting gamma rays (γ) and/or subatomic particles (α, β‐, β+, Auger electrons).
1.1.1. Diagnosis vs Therapy
Depending on the medical application, diagnosis or therapy, different physical properties are required for the radionuclide. The important physical properties of the radionuclide are the type and energy of the emitted radiation and/or particles and half‐life (t1/2).
Diagnostic radiopharmaceuticals have in their composition a gamma‐emitting (γ)
radionuclide for SPECT, or a positron‐emitting (β+) radionuclide for PET. For diagnosis the radionuclides should not emit α or β‐ particles and should have a relatively short half‐life. The radiation emitted by the radionuclide or resulting from annihilation crosses the body tissues and is detected by instrumentation that is external to the patient. The half‐life must be short enough to minimize the radiation dose but sufficiently long for preparation,
administration, distribution and accumulation of the radiopharmaceutical in the target organ or tissue, as well as for image acquisition. For SPECT, gamma‐ray energies between 80 and 300 keV are the most indicated, the optimum being between 100 and 200 keV for the instrumentation currently in use in nuclear medicine departments.4 Examples of the most used gamma emitters in SPECT are shown in table 1.1. Table 1.1 ‐ γ emitters used in SPECT.5,6
Radionuclide Half‐life γ‐Energy (keV) Abundance (%) Decay mode* Production method
67 Ga 3.26 d 93 184 300 393 40 20 17 5
EC Cyclotron: 68Zn(p,2n)67Ga
99m
Tc 6.02 h 140 90 IT 99Mo/99mTc Generator
111 In 2.83 d 171 245 90 94
EC Cyclotron: 111Cd(p,n)111In
123
I 13.2 h 159 83 EC Cyclotron: 124Te(p,2n)123I
121Sb(α, 2n)123I 201 Tl 3.04 d 135 167 3 9.4 EC Cyclotron: 203Tl(p,3n)201Pb * EC ‐ electron capture, IT ‐ isomeric transition
Due to its physical properties and availability (generator), 99mTc is the most used radionuclide in SPECT. Today, over 90% of all diagnostic nuclear medicine imaging studies carried out worldwide use this isotope.
PET is based on the physical principle of annihilation of a positron/electron (β+/β‐) pair, from which two 511 keV photons result. These arise from the mass‐energy conversion of the two massive particles and are emitted with an angle of 180° at opposite sides from the annihilation center.5 The double coincidence in energy and emission of the annihilation photons is advantageous for imaging purposes because it allows a simple and comparatively 99m Tc β‐ 66 h 99 Mo 201 Pb 201 Tl EC 9.3 h
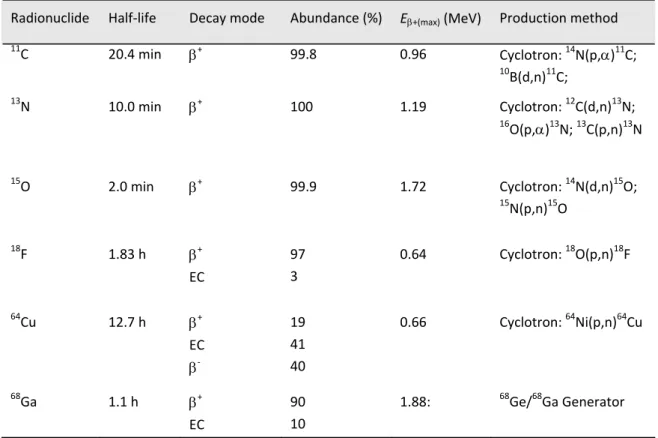
metallic isotopes (table 1.2), such as 11C, 15O or 18F. These radionuclides can replace the natural elements in biologically active molecules, without disturbing significantly their biological activity. However, some positron‐emitting radiometals, such as 64Cu and 68Ga, are of great interest for developing new PET radiopharmaceuticals, due to their physical and chemical properties, and availability.
Most of the PET radionuclides have the disadvantage of requiring costly technology, and automated and sophisticated methods of synthesis, since they are produced in cyclotrons and have short half‐lives. 18F‐FDG is the most widely used positron‐emitting radiopharmaceutical for PET imaging, making 18F the most used radionuclide in this nuclear imaging technique. 18F‐FDG has shown clinical usefulness in cardiology and neurology but is used mainly in oncology, in the diagnosis, staging and post‐therapy evaluation of oncologic patients.7 Table 1.2 ‐ Positron emitters used in PET.5,8,9
Radionuclide Half‐life Decay mode Abundance (%) Eβ+(max) (MeV) Production method 11C 20.4 min β+ 99.8 0.96 Cyclotron: 14N(p,α)11C; 10 B(d,n)11C; 13 N 10.0 min β+ 100 1.19 Cyclotron: 12C(d,n)13N; 16O(p,α)13N; 13C(p,n)13N 15O 2.0 min β+ 99.9 1.72 Cyclotron: 14N(d,n)15O;
15N(p,n)15O 18F 1.83 h β+ EC 97 3 0.64 Cyclotron: 18O(p,n)18F 64 Cu 12.7 h β+ EC β‐ 19 41 40
0.66 Cyclotron: 64Ni(p,n)64Cu
68 Ga 1.1 h β+ EC 90 10 1.88: 68Ge/68Ga Generator
Therapeutic radiopharmaceuticals have in their composition a radionuclide that
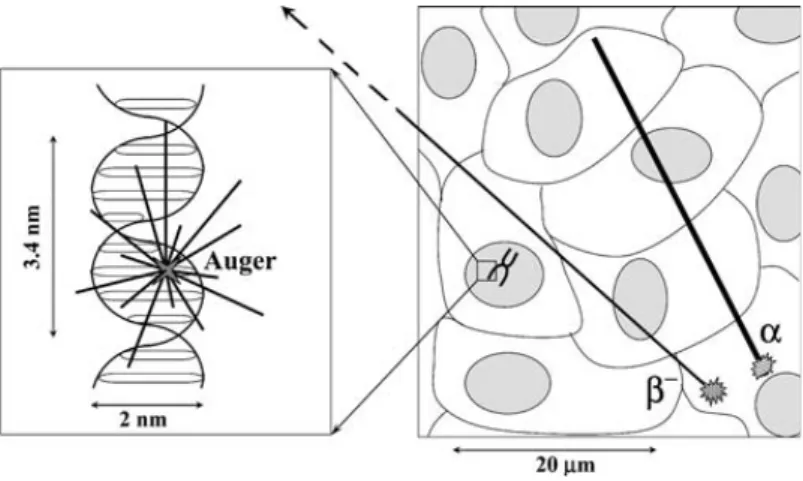
tissues.5 For therapy the most used radionuclides are β‐emitters, but some research involving α and Auger electron emitters is also underway. These particles have different ranges in the tissues: distance travelled until all their kinetic energy is transferred (table 1.3). In figure 1.1 the range of Auger electrons, α and β‐ particles in a cellular and subcellular environment is represented.
Table 1.3 ‐ Range of Auger electrons, β‐and α particles in tissues.10
Particle Mean tissue range Best suited for treatment of: β‐
(high energy) 1 ‐ 10 mm Tumor masses β‐ (low and moderate energy) 0.1 ‐ 1 mm Tumor masses
α (5.3 MeV) 30 ‐ 80 μm (some cells) Clusters and individual cells Auger electrons < 1 μm (cell nucleus) Individual cells
Figure 1.1 ‐ Schematic representation of Auger electrons, α and β‐ particles path lengths in a cellular and subcellular environment (arbitrary scaling). Note that the major energy deposition of an Auger decay occurs in the close vicinity of a few nm, while that of α and β‐ occurs on tracks of 40 ‐ 80 μm and 0.1 ‐ 10 mm, respectively.10
Table 1.4 shows some of the radionuclides in clinical use or with potential interest for
therapy.
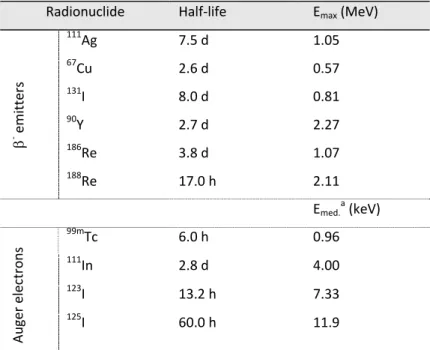
Table 1.4 ‐ Some radionuclides in clinical use or potentially interesting for therapy.11,12
Radionuclide Half‐life Emax (MeV)
111Ag 7.5 d 1.05 67Cu 2.6 d 0.57 131 I 8.0 d 0.81 90 Y 2.7 d 2.27 186Re 3.8 d 1.07 β ‐ emitters 188Re 17.0 h 2.11 Emed.a (keV) 99mTc 6.0 h 0.96 111 In 2.8 d 4.00 123I 13.2 h 7.33 Au ger electro n s 125 I 60.0 h 11.9 a Values obtained taking into account just the energy released by the Auger electrons. The values of total energy released by the radionuclides by decay are higher.
The choice of a radionuclide for therapy depends on the type, energy, half‐life and range of the emitted particles, and should take into account the size of the tumor or tissue to irradiate. The β‐ particles have a long range tissue penetration (mm) (table 1.3 and figure
1.1), and can be used for large solid tumor, taking advantage of the crossfire effect of β‐ particles.10 However, this crossfire might be a disadvantage when targeting small tumor cells because it irradiates healthy tissues, leading to undesirable side effects. The α particles have higher LET compared to β‐ particles and a path length in tissue in the range of 30 ‐ 80 μm (table 1.3 and figure 1.1), being very cytotoxic. For this reason, the α‐emitting radiopharmaceuticals are optimal for the treatment of small tumors. The Auger electrons are less energetic particles and have a smaller range (< 1 μm), having a LET similar to that of the α particles, which makes them potentially interesting for therapy. In contrast to α and β‐ particles, treatment based on Auger electron emitters requires the targeting of individual cells, specifically the DNA in the nucleus. Despite the multiple obstacles that have to be overpassed, Auger electron therapy approaches remain very appealing.