Acknowledgements and Dedication
Firstly, I would like to thank Prof. Karl Kunzelmann for accepting me as a student, thus allowing me to develop my scientific skills in a successful and organized environment. Also, for the continuous and close supervision over this project.
In the second place, I would like to show my appreciation to Prof. Margarida Amaral for the co-supervision of this work and communication over the year. Additionally, I would like to thank Prof. Rainer Schreiber for the constant supervision, help and all his suggestions.
I also want to specially thanks Ji for always being available to help with anything for her constant suggestions and ultimately to turn me into a better student.
A big thanks to all my fellow colleagues. To Inês, for being supportive even before my arrival to the last day of work. Also for the major contribution she had on this work and for always keeping a positive attitude and a good mood even when things seemed to go off track. To Roberta for never being too busy to help. For being officially a good friend and for never leaving me on the side with her formal invitations. Also for being the best gaming partner: “Here is my thank you Roberta, take it”. To Raquel, for all the supportive attitude and for helping me every time I need, even if for a short time. To Madalena, for her contribution to this work, but also for her kindness and sympathy. A big thanks for all the help with the thesis!
To all the technicians (Silvia, Tini, Patricia, and Brigitte) for all the effort and major support to develop this work.
I would like to show my appreciation to the Department of Physiology of the University of Regensburg where this work was developed since October 2017 until September 2018.
À Rita, agradeço toda a sua paciência durante este ano. Por todo o apoio incondicional que tiveste. Por todas as tuas palavras e pela tua presença durante este ano. Por toda a ajuda e pela tua contribuição para esta tese o meu obrigado.
A toda a minha família agradeço o apoio que me proporcionaram desde o início e pelo incentivo durante todo este ano.
Summary
Autosomal dominant polycystic kidney disease (ADPKD) is characterized by the development of bilateral renal cysts that continuously expand and lead to an impaired renal function. ADPKD is originated by mutations in PKD1 or PKD2 genes, whose protein products are collectively called polycystins.
Polycystin-1 (PC1) encodes a membrane protein with large extracellular domains, which probably works as a receptor for an unidentified ligand. Polycystin-2 (PC2) is also a membrane-associated protein that works as a non-selective ion channel with high affinity to calcium ions (Ca2+). Together,
these proteins are thought to form a functional complex, which can regulate intracellular Ca2+
signaling.
One of the hallmarks of ADPKD is the transepithelial Cl- secretion towards the cyst lumen. This
secretion is thought to occur, mainly, through cAMP-gated channel Cystic Fibrosis Transmembrane Regulator (CFTR). CFTR is expressed in the apical membrane of epithelial cells in several tissues, namely in the kidney, and its function is suggested to be upregulated in cystic epithelial cells. However, heterogeneity in CFTR expression suggests that this channel may not be the only one responsible for transepithelial chloride (Cl-) secretion in ADPKD.
Additionally, Calcium-activated Cl- channels (CaCC) activated through purinergic receptors seem
to play a fundamental role in this process. TMEM16A, a CaCC expressed in kidney epithelial cells, can be, together with CFTR, responsible for Cl- secretion towards the cyst lumen, and, therefore, be
involved in cyst development.
Having a better understanding of TMEM16A and CFTR role in cyst growth can help in the development of new therapies in order to surpass ADPKD impaired Cl- secretion, hence controlling
cyst formation and progression.
Here, we show that in the M1 cell line and in primary cultures of kidney cells derived from the renal cortex and medulla, the knockdown of either PKD1 or PKD2 is sufficient to generate a cystic phenotype on cellular level. ADPKD cells have an upregulation of constitutive and stimulated Cl-
secretion, mainly through CFTR and TMEM16A. Increase Cl- secretion by CFTR and TMEM16A is
due to an enhanced Ca2+ signaling. ADPKD representative cells are characterized by an increased
Ca2+ concentration in the cytoplasm as well in the ER Ca2+ stores
Remarkably, the downregulation of TMEM16A expression rescued the cells from the cystic phenotype, showing a major impact of TMEM16A in this disease, and shedding light towards new therapeutic approaches.
Resumo
A doença renal policística autossómica dominante (ADPKD) é caracterizada pelo desenvolvimento de cistos renais bilaterais que se expandem continuamente e levam a um comprometimento da função renal, sendo responsável por 10% dos casos que requerem transplante renal . A ADPKD é originada por mutações nos genes PKD1 ou PKD2, cujos produtos proteicos são coletivamente denominados policistinas. É a doença monogénica mais comum a nível mundial (incidência de 1:400-1:1000 indivíduos).
A Policistina-1 (PC1) é uma proteína de membrana cuja função não é completamente conhecida. Pensa-se que pode atuar como receptor para um ligando não identificado. Está presente na membrana plasmática, no cílio primário e nos complexos de adesão de células epiteliais polarizadas. A Policistina-2 (PC2 ou TRPP2) é uma proteína associada à membrana, que pertence à família de receptores de potencial transientes (TRP). É caracterizada como um canal catiónico não seletivo com alta afinidade para iões de cálcio (Ca2+). Ainda que PC2 seja encontrada em localizações comuns a
PC1, como a membrana plasmática e o cílio primário, encontra-se maioritariamente em organelos intracelulares como o Complexo de Golgi (GC) e o Retículo Endoplasmático (ER). Diversos estudos sugerem que PC1 e PC2 interagem formando o complexo policístico. No cílio primário pensa-se que estas duas proteínas regulam o fluxo de urina primária que passa ao longo do nefrónio. PC1 funciona então como um sensor graças ao seu amplo domínio extracelular, ativando assim PC2 o que leva a uma entrada de Ca2+ na célula.
Uma das principais características da ADPKD é secreção de fluído transepitelial em direção ao lúmen do cisto. Ainda que este não seja um fenómeno comum dos túbulos renais, conhecidos por reabsorverem mais de 99% do filtrado glomerular, vários estudos mostram uma aptidão do epitélio de células com ADPKD para secretarem fluido. É possível que vários transportadores e canais iónicos possam estar alterados em células com fenótipo cístico, como os canais apicais de cloreto (Cl-), que
assumem particular relevância nesta situação. O aumento dos níveis de monofosfato cíclico de adenosina (cAMP) nestas células induz a secreção de Cl- através de CFTR (do inglês: Cystic Fibrosis
Transmembrane conductance Regulator). Este processo encontra-se descrito como sendo uma das principais alterações nas células epiteliais de doentes com ADPKD. Contudo, existe alguma heterogeneidade na expressão deste canal iónico no tecido renal, o que levou à hipótese de que outros tipos de canais de Cl- poderiam estar envolvidos nesta doença. A existência de sinalização autócrina e
parácrina no rim levou à hipótese da ativação dos canais de Cl- ativados por Ca2+ (CaCC).
Mutações no CFTR dão origem à Fibrose Quística (CF), a doença autossómica recessiva com maior mortalidade a nível mundial. Este canal é expresso na membrana apical de vários órgãos, incluindo o rim, nomeadamente nos túbulos proximais, distais e ducto coletor. A sua ativação requer um processo de fosforilação dependente de cAMP. CFTR apresenta uma interação funcional com outros canais iónicos, nomeadamente os CaCC.
Os CaCC são canais iónicos membranares específicos para o transporte de aniões. São expressos numa grande variedade de tecidos e desempenham diversos papeis na célula, incluindo secreção epitelial. Podem ser ativados através de um fluxo de Ca2+ transportado através da membrana
plasmática ou por libertação de Ca2+ de organelos intracelulares.
As proteínas transmembranares 16 (TMEM16) constituem uma família de dez proteínas homólogas (TMEM16A-K) caracterizadas pela elevada conservação das suas sequências. O membro mais bem estudado desta família é a proteína transmembranar 16 A (TMEM16A). Vários estudos
demonstram que TMEM16A conduz correntes de CaCC em vários tipos de tecido, incluindo o rim. Neste órgão, TMEM16A desempenha um papel fundamental na reabsorção de proteínas pelos túbulos proximais e na secreção de protões.
Uma interação funcional foi descrita entre CFTR e TMEM16A ao nível do intestino e vias aéreas. Estudos demonstraram que TMEM16A aumenta a libertação de Ca2+ do retículo endoplasmático (ER)
ativando assim a sinalização por cAMP. É possível que esta dependência funcional ocorra também a nível renal, particularmente nos pacientes com ADPKD que tem secreção apical de Cl- aumentada e
sinalização de Ca2+ anormal.
Foi previamente demostrado que tanto PKD1 como PKD2 desempenham um papel fundamental na regulação da homeostase intracelular de Ca2+. No ER, PKD2 interage com o receptor de inositol
trifosfato (IP3R), aumentando assim a libertação de Ca2+ deste organelo, ao contrário do PKD1 que
regula negativamente esta interação. PKD2 também regula a concentração de Ca2+ intracelular
([Ca2+]
i) ao formar heteodímeros com canais TRP presentes tanto na membrana plasmática como no
cílio primário. Assim foi proposto que mutações em PKD1 ou PKD2, via desregulação da [Ca2+] i,
podem levar à ativação de vias regulatórias anormais presentes na ADPKD. Contudo os mecanismos moleculares por detrás destes processos não se encontram claros.
Deste modo, o objetivo deste trabalho é estudar o processo de desenvolvimento dos cistos, nomeadamente a secreção de Cl- desregulada pela qual a ADPKD é caracterizada. Assim, diferentes
técnicas de detecção de transporte iónico foram aplicadas, tendo sido utilizadas para o efeito diferentes modelos de estudo.
Em primeiro lugar, foi utilizada uma linha celular M1, originária do ducto coletor de rato com expressão diminuída de Pkd1 e Pkd2, de modo a induzir nas células um fenótipo cístico. As propriedades ao nível de transporte iónico foram medidas utilizando diferentes abordagens. De modo a simular a fisiologia do epitélio renal, as monocamadas celulares foram cultivadas em filtros que permitiram que as células polarizassem e que o transporte de eletrólitos fosse avaliado na Câmara de Ussing. Foram também utilizados ensaios com células isoladas, nomeadamente patch clamp e o ensaio de quenching de YFP. No geral, foi possível que observar que menores níveis de Pkd1 e Pkd2 levam à existência de maiores correntes elétricas, geradas por uma maior atividade de canais iónicos, tanto a nível basal como depois de estimulada a secreção de Cl- via CFTR ou CaCC. Visto que a sinalização
de Ca2+ aparenta estar alterada nas células com ADPKD, a [Ca2+]
i foi medida nestas células. Menor
expressão de Pkd1 levou a maior [Ca2+]
i tanto a nível basal como depois de estimulação por agonistas
purinérgicos. Estas células também aparentam ter uma maior concentração de Ca2+ no ER ([Ca2+] ER).
Os resultados obtidos foram então confirmados utilizando culturas primárias de tecido renal de diferentes modelos animais: ratinhos wild-type (wt) utilizados como controlo; ratinhos com Pkd1 Knockout (KO) específico para o rim, de modo a obter um modelo da doença; e ratinhos com Pkd1 e Tmem16a KO específicos para o rim, que permite perceber a relevância neste CaCC na ADPKD. Estas células foram isoladas a partir do córtex e também da medula renal, o que permitiu perceber se haveria alguma diferença entre as células provenientes de diferentes regiões do rim no que diz respeito ao desenvolvimento de um fenótipo cístico. Utilizando as mesmas técnicas acima mencionadas foi possível verificar que a secreção de Cl- se encontrava aumentada, tanto a nível basal como após
estimulação dos CaCC e de CFTR, nas células dos animais com KO no Pkd1. Este efeito é revertido quando as células apresentam o duplo KO para Pkd1 e Tmem16a, mostrando assim a importância deste CaCC para a ADPKD. Os níveis intracelulares de Ca2+ foram também analisados de maneira
semelhante ao que foi descrito para a linha celular M1. As células primárias que apresentavam KO de Pkd1 apresentaram uma maior [Ca2+]
i e de [Ca2+]ER. Este aumento foi abolido nas células primárias
provenientes do animal com Pkd1/Tmem16a KO.
Em suma, este estudo permitiu demonstrar que o CFTR e TMEM16A colaboram no aumento da secreção de Cl-, um fenótipo característico da ADPKD. Um aumento dos níveis de Ca2+ tanto a nível
citoplasmático como do ER em células com KO de Pkd1 sugere que nestas existe uma maior ativação de TMEM16A que, através da sua interação funcional com CFTR, aumenta também a sua atividade. Especula-se que o aumento de [Ca2+ ]
i se deve à falta de regulação de PKD2 pela PKD1 que se
encontra mutada, levando a uma deslocalização de PKD2 do cílio primário e uma maior presença desta proteína quer a nível da membrana plasmática, quer no ER, o que leva a uma maior [Ca2+]
i nestas
células. A compreensão da função conjunta que o CFTR e TMEM16A aparentam desempenhar no epitélio de células com fenótipo cístico pode impulsionar o conhecimento acerca desta doença e permitir o desenvolvimento de novas terapias.
Table of Contents
Acknowledgements and Dedication i
Summary ii
Resumo (Summary – Portuguese version) iii
Table of Contents vii
List of Acronyms and Abbreviations xi
Index of Figures and Tables xv
1. Introduction 1
1.1. Autossomal dominant polycystic kidney disease 1
1.2 What is the function of Polycystins? 1
1.2.1 Polycystins role in flow sensing 2
1.3 Cyst formation in ADPKD 3
1.4 Impaired transport in ADPKD 3
1.5 CFTR and TMEM16A 5
1.5.1 Crosstalk between CFTR and TMEM16A 7
1.6 Regulation of Ca2+ signaling by polycystins 7
2. Objectives 9
3. Materials and Methods 11
3.1 Cell Culture 11
3.1.1 Mammalian Cell Lines and Culture Conditions 11
3.1.2 Cell Culture on filter support 12
3.1.3 Transient Transfections 12
3.1.4 Production of lentivirus and stable cell lines generation 12
3.2 Molecular Biology 13
3.2.1 cDNA and siRNA 13
3.2.2 RT-PCR 13
3.3 Animal models 13
3.3.1 Isolation of Primary Kidney cells from cortical preparation 13 3.3.2 Isolation of Primary Kidney cells from medullary preparation 14
3.4 Analysis of protein expression and histology 14
3.4.1 Immunocytochemistry on primary kidney cells 14
3.4.2 Histology of renal cryosections 14
3.4.3 Western Blot 15
3.5.1 Assesment of Cl- permeability through YFP Quenching assay 15
3.5.2 Whole-cell current measurements 16
3.5.3 Measurements of transepithelial ion transport 16
3.5.4 Measurements of free intracellular Ca2+ Signaling using FURA-2 AM 17
3.6 Statistical Analysis 17
4. Results 19
4.1 Downregulation of Pkd1 induced a cystic phenotype which involves activation of Tmem16a 19 4.2 Mouse Cortical Collecting Duct cell line as a model of ADPKD 19 4.2.1 Polarized M1 cells produce cAMP-stimulated and CaCC short-circuit currents 20 4.2.2 Downregulation of Pkd1/2 enhances basal and CaCC currents. 21 4.2.3 Knockdown of Pkd1 increases Tmem16a-dependent I- uptake 23
4.2.4 Downregulation of endogenous Pkd1 or Pkd2 upregulates intracellular Ca2+ signaling in M1
cells 27
4.3 Isolation of primary kidney cells from the renal medulla and renal cortex 28 4.4 Characterization of primary cells isolated from the renal cortex 29 4.4.1 Polarized primary cortical cells did not show increased secretion after induction of a cystic
phenotype 29
4.4.2 Primary Pkd1 KO cortical cells had a higher basal and purinergic stimulated conductance,
for which Tmem16a is essential 31
4.4.3 Pkd1 KO in cortical primary cells enhances I- uptake through CaCC 32
4.4.4 In primary cortical cells Pkd1 KO upregulates Ca2+ signaling, in a Tmem16a-dependent
manner 35
4.6 Primary Kidney Cells isolated from medullary preparations 37 4.6.1 Pkd1 KO enhances CaCC activity in primary medullary cells 37 4.6.2 Pkd1 KO in medullary primary cells induces an enhanced secretory phenotype that is
rescued in the absence of Tmem16a 39
4.6.3 Medullary cells with Pkd1 KO have an enhanced I- permeability after cAMP and purinergic
stimulation for which TMEM6A and CFTR are essential. 39
4.6.4 In primary medullary cells, Ca2+ signaling is upregulated by Pkd1 KO in a
Tmem16a-dependent manner 42
5. Discussion 45
5.1 Phenotypical switch of ADPKD cyst lining cells 45
5.2 M1 cell line and primary cultures of isolated kidney cells as models to study fluid secretion in
cyst development 45
5.3 Proposed model for impaired Cl- secretion in ADPKD 46
7. References 52
8. Appendices 62
Appendix I –siRNA 62
Appendix II – Primers and RT-PCR 62
Appendix III – Analysis of protein expression 63
Appendix IV– mRNA expression analysis by RT-PCR 65
Appendix V– YFP fluorescence measurements 66
List of Acronyms and Abbreviations
• Ohm A Microampere (10-6 A) g Microgram (10-6 g) M Micromolar (10-6 M) m Micrometer (10-6 m) ([Ca2+]i) Intracellular calcium concentration
ABC ATP Binding Cassete
ADPKD Autosomal dominant polycystic kidney disease
ANOVA Analysis of variance
AQP Aquaporin
ATP Adenosine triphosphate
BSA bovine serum albumin
°C Degree celsius
Ca2+ Calcium ion
CaCC Ca2+-activated Cl- channels
cAMP Cyclic adenosine monophosphate
CD8 Cluster of Differentiation 8
cDNA Complementary Deoxyribonucleic acid
CF Cystic Fibrosis
CFTR Cystic fibrosis transmembrane conductance regulator
CFTRinh CFTR inhibitor
Cl- Chloride ion
cm2 Square Centimeter
CO2 Carbon Dioxide
CPA Cyclopiazonic acid
C-terminal Carboxyl- terminal
DAG Diacylglycerol
ddH2O Double distilled water
DF Dilution Factor
dH2O Distilled water
DMEM Dulbecco's Modified Eagle Medium
DNA Deoxyribonucleic acid
EGTA Ethylene Glycol Tetraacetic Acid
ENaC Epithelium sodium channel
ER Endoplasmic reticulum
ERS Electrical Resistance System
ESRD End-stage renal disease
EtOH Ethanol
eYFP Enhanced Yellow Fluorescent Protein
FBS Fetal Bovine Serum
Fsk Forskolin
FURA-2 AM Fura-2-acetoxymethyl ester
GAPDH Glyceraldehyde 3-phosphate dehydrogenase
GPCR G protein-coupled receptor
h Hour(s)
H+ Hydrogen ion
HBSS Hank’s Balanced Salt Solution
HEK 293T Human Embryonic Kidney 293T (cell line)
I- Iodide ion
IBMX 3-isobutyl-1-methylxanthine
Ig Immunoglobulin
IP3 Inositol-1,4,5 triphosphate
IP3R Inositol 1,4,5-triphosphate receptor
Isc Short-circuit currents
ITS Insulin-Transferrin-Selenium
K+ Potassium ion
K2HPO4.3H2O Dipotassium hydrogen phosphate trihydrate
KCa3.1 Calcium-activated potassium channel 3.1
KCl Potassium chloride
KH2PO4 Potassium dihydrogen phosphate
KO Knockout
Ksp kidney specific cadherin promoter
Min Minute(s)
mg Milligram (10-3 g)
Mg2+ Magnesium ion
MgCl2.6H2O Magnesium chloride hexahydrate
mL Millilitre (10-3 L)
mm Millimetre (10-3 m)
mmol Millimol (10-3 mol)
mRNA Messenger RNA
mTMEM16 Mouse Transmembrane Protein 16
mV Millivolt (10-3 V)
Na+ Sodium ion
Na+/K+- ATPase Sodium-potassium pump
NaCl Sodium chloride
NaH2PO4.H2O Monosodium dihydrogen orthophosphate
NaI Sodium iodide
NBD Nucleotide binding domain
NKCC Sodium–potassium–chloride cotransporter
nM Nanomolar (10-9 A)
nm Nanometre (10-9 m)
N- terminal Amino- terminal
Orai1 Calcium Release-Activated Calcium Modulator 1 ORCC Outwardly rectifying Cl- channels
P2Y Purinergic G Protein-coupled Receptor 2Y
P2Y2 Purinergic G Protein-coupled Receptor 2Y2 P2X Purinergic G Protein-coupled Receptor 2X
PBS Phosphate Buffered Saline
PC Polycystin
PCR Polymerase Chain Reaction
Pen Strep Penicillin-Streptomycin
PFA Paraformaldehyde
PIP2 Phosphatidyl inositol-diphospate
PKA Protein Kinase A
PKD Polycystic kidney disease
PLC Phospholipase C
PT Proximal tubules
R-domain Regulatory Domain
RNA Ribonucleic acid
rpm Rotations per minute
RT Room temperature
RT-PCR Reverse Transcriptase Polymerase Chain Reaction
Rte Resistance
RyR Ryanodine receptor
scr Scrambled
SEM Standard error of the mean
sh Short hairpin RNA
siRNA Small interfering RNA
SK&F96365 1-(beta-[3-(4-methoxy-phenyl)propoxy]-4-methoxyphenethyl)-1H- imidazole hydrochloride
SOCE Store Operated Calcium Entry
STIM1 Stromal interaction molecule-1
T3 Triiodothyronine
T16A Transmembrane member16 A
TER Transepithelial Electrical Resistance
TMD Transmembrane domain
TMEM16 Transmembrane member 16
TRP Transient receptor potential
TRPC1 Transient receptor potential channel 1 TRPP2 Transient receptor potential polycystic 2
TRPV4 Transient receptor potential cation channel subfamily V member 4
UTP Uridine Triphosphate
Vte Voltage
WB Western Blot
wt Wildtype
YFP Yellow Fluorescent Protein
YM58483 4-methyl-4•-[3,5-bis(trifluoromethyl)-1H-pyrazol-1-yl]-1,2,3-thiadiazole-5-carboxanilide
Index of Figures and Tables
Figure 1.1. Schematic representation of polycystin 1-polycystin 2 complex and their respective
interaction. ... 2
Figure 1.2. Representation of the possible physiological role of the polycystin complex ... 3
Figure 1.3. Model of the transporters and channels involved in fluid accumulation in ADPKD ... 5
Figure 1.4. Scheme of CFTR structure ... 6
Figure 1.5. Representation of mTMEM16A architecture. ... 7
Figure 3.1. Scheme of Iodide-mediated YFP fluorescence quenching ... 16
Figure 4.1. The absence of Tmem16a rescues cystic phenotype induced by KO of Pkd1 ... 19
Figure 4.2. M1 cells are a representative in vitro model for ADPKD. ... 20
Figure 4.3. M1 cells show cAMP and CaCC dependent electrolyte transport ... 21
Figure 4.4. Knockdown of Pkd1/Pkd2 leads to a higher whole-cell current at basal state ... 22
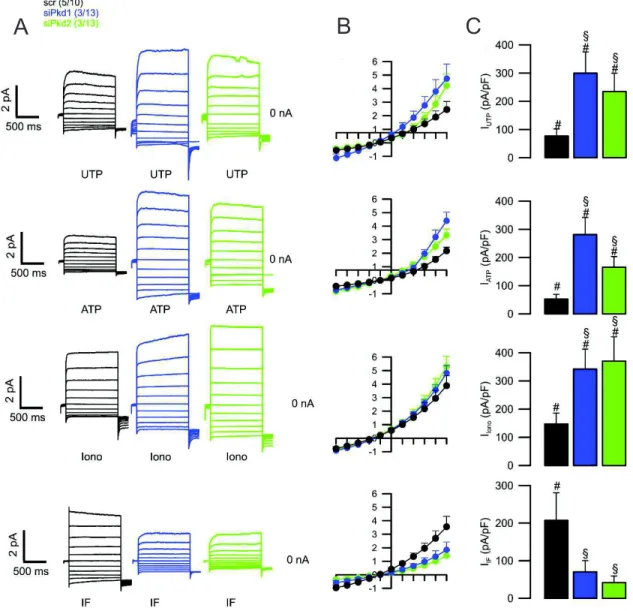
Figure 4.5. Knockdown of Pkd1 or Pkd2 leads to enhanced CaCC and diminished CFTR currents ... 23
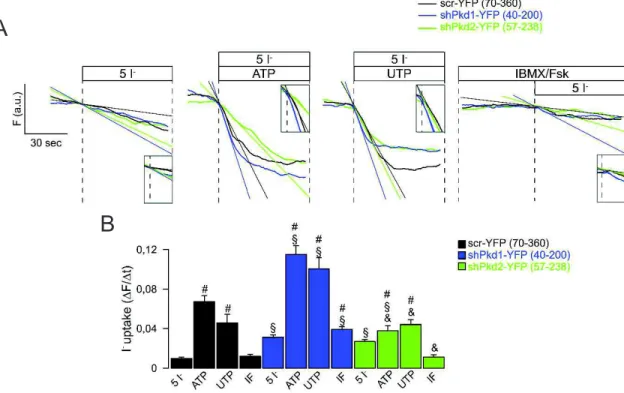
Figure 4.6. Knockdown of Pkd1 leads to enhanced Ca2+ and cAMP induced I- uptake ... 24
Figure 4.7. I- uptake is due to CaCC and CFTR activation ... 25
Figure 4.8. Downregulation of Pkd1 led to increased I- permeability dependent on Tmem16a ... 26
Figure 4.9. Ca2+ signaling is upregulated with the knockdown of Pkd1 or Pkd2 and Tmem16a plays a fundamental role in this process ... 28
Figure 4.10. mRNA expression from Primary kidney cells from renal cortex or medulla ... 29
Figure 4.11. Pkd1 KO did not induce a secretory phenotype in polarized primary cortical kidney cells. ... 31
Figure 4.12. Pkd1 KO leads to a higher basal current and CaCC activation, for which Tmem16a is essential. ... 31
Figure 4.13. Pkd1 KO leads to enhanced Ca2+ and cAMP induced I- uptake. ... 32
Figure 4.14. I- uptake occurs due to CaCC and CFTR activation ... 35
Figure 4.15. KO of Pkd1 leads to Ca2+ signaling upregulation ... 36
Figure 4.16. Pkd1 KO lead to enhanced Tmem16a activation, and reduced epithelium resistance .... 38
Figure 4.17. Tmem16a is essential for both basal and purinergic stimulated currents. ... 39
Figure 4.18. Pkd1 KO leads to enhanced Ca2+ and cAMP induced I- uptake. ... 40
Figure 4.19. I- uptake occurs due to CaCC and CFTR activation ... 41
Figure 4.20. Pkd1 KO leads to intracellular Ca2+ signaling deregulation ... 43
Table I.1. Accession number and base pairs (bp) of the plasmids used ... 62
Table II.1. Pair list of Primers used for RT-PCR ... 62
Table II.2. Standard RT-PCR program. ... 63
Figure III.1. Western blot analysis of PKD1/ PKD2 downregulation ... 63
Figure III.2. Western blot analysis of PKD1, PKD2, and TMEM16A downregulation ... 64
Figure III.3. Immunostaining analysis of TMEM16A and Acetylated tubulin in primary cells ... 64
Figure IV.1. RT-PCR analysis of Pkd1/Pkd2 downregulation in M1 cell line. ... 65
Figure IV.2. RT-PCR analysis of Pkd1 and Tmem16a expression in medullary primary cells. ... 65
Figure IV.3. RT-PCR analysis of Scnn1 expression in medullary primary cells. ... 66
Figure V.1. Assessment of YFP fluorescence on M1 cells. ... 66
Figure V.2. Assessment of YFP fluorescence on primary cells. ... 67
1. Introduction
1.1.
Autosomal dominant polycystic kidney diseasePolycystic kidney disease (PKD) constitutes a series of genetic disorders in which renal tubules become structurally abnormal, resulting in kidney cyst development and growth1. Between
several types, autosomal dominant polycystic kidney disease (ADPKD) is the most prevalent (incidence of 1:400 to 1:1000) monogenic renal disease2. ADPKD is characterized by an acute and
bilateral development of multiple renal cysts over time that leads to the displacement and destruction of the adjacent renal parenchyma, progressive organ enlargement, and, ultimately, loss of renal function, being the cause of 10% of end-stage renal disease (ESRD) cases worldwide, which demand renal replacement therapy strategies2-4.
ADPKD is a systemic disorder that can have an in utero to adult onset5,6. Extrarenal
manifestations also constitute cysts in other epithelial organs including liver and pancreas7.
Furthermore, it is a genetically heterogeneous disease originated by a germline mutation in either of two genes, PKD1 or PKD2 (Polycystic kidney disease 1 and 2)8,9. Mutations in PKD1 (located on
chromosome 16p13.3) lead to the development of ADPKD in 85% of the patients and are linked with a more serious clinical progression while the remaining 15% of the cases are due to PKD2 mutations (located on chromosome 4q 21-23)10 and present a milder phenotype with later onset, longer renal
survival and fewer complications11. The protein products encoded by PKD1 and PKD2 genes are
collectively named polycystins.
1.2 What is the function of Polycystins?
Polycystin-1 (PC1) is classified as an integral membrane protein and is constituted by eleven transmembrane domains, an extensive extracellular N-terminal domain, and a shorter C-terminal cytosolic domain10. PC1 contains a series of juxtaposed structural motifs, which suggests its
involvement in protein-protein or protein-carbohydrate interactions, its functions as a receptor for an unknown ligand and its critical role in cell-cell or cell-matrix interactions12,13. It is mainly expressed in
epithelial cells of developing and mature renal tubules. PC1 expression is regulated over time showing higher levels in fetal tissues and decreased presence in adult tissues14. PC1 is localized on the plasma
membrane, adhesion complexes in polarized epithelial cells and on the primary cilium, a single hair-like organelle that protrudes from the surface of most mammalian cells, implicated in many cystic diseases15-17.
Polycystin-2 (PC2) or TRPP2 is a membrane-associated protein that belongs to the transient receptor potential family (TRP)18. It has 6 transmembrane domains, two EF-hands, (characteristic of
Ca2+ binding domains that allow the protein to sense changes in Ca2+) an endoplasmatic reticulum (ER)
retention signal and cytoplasmatic N- and C-terminal domains9,19. It works as nonselective cation
channel with high affinity to Ca2+, being also permeable to Na+ and K+ ions. Although PC2 is found on
the primary cilium and plasma membrane, where it mediates Ca2+ entry into the cytoplasm, most of its
pool is located in intracellular compartments, such as the ER and the Golgi complex, acting as Ca2+
release channel20,21. PC2 interacts with other members of TRP superfamily, namely TRPC1 and
TRPV4, to form heteromeric channel22.
The most significant partner of PKD1 is PKD223, interacting through their C-terminal coiled-coil
domains (Fig. 1.1)2,13. Several studies suggest that PKD1 and PKD2 reciprocally affect the cellular
precise mechanism of this dependence is still not elucidated24. However, it is thought that this
interaction is critical to create a functional ion channel. Yet, it is still unknown if this is due to the activation of PKD2 inherent channel properties or through emergent channel properties arising from the interaction between the two proteins25.
Figure 1.1. Schematic representation of polycystin 1-polycystin 2 complex and their respective interaction. PC1
has a large extracellular domain, 11 transmembrane domains and a shorter C-terminal tail. PC2 has a N- and C- termini domains and 6 transmembrane domains, where the ionic pore is formed. Both present a Coiled-Coil domain on the C-terminal by which they interact and mediate calcium entry into the cells. Retrieved and adapted from Patel et. al26.
1.2.1 Polycystins role in flow sensing
As previously mentioned, the cellular localization of these two proteins overlap, namely on the primary cilium. The primary cilium of renal tubular epithelial cells bends in response to fluid flow (primary urine)27,28. However, the subsequent cascade of events is still not clear and additional studies
are still required.
Some authors state that the polycystin complex is implicated in fluid flow regulation, through the regulation of the concentration of free intracellular calcium ([Ca2+]
i), thus interfering with its
homeostasis and signaling29,30. [Ca2+]
i is important for the regulation of several cellular functions,
including cell proliferation, cell volume regulation, ion and fluid transport, and differentiation31. PKD1
is essential for fluid regulation process, sensing the flow with its large extracellular domains and activating the associated PKD2 Ca2+ channels (Fig. 1.2), which may lead to a Ca2+-induced Ca2+
release from intracellular stores1,29.
Other studies claim that the primary cilium has its own compartmentalized calcium signaling. Even with the polycystins complex promoting Ca2+ entry into to the cells, the amount of Ca2+ that
enters through the primary cilium in response to fluid flow would be too small to trigger a visible response in cytoplasmatic Ca2+ 32.
Nevertheless, in addition to this hypothesis, a study by Delling et al33 states that there is not a
ciliary specific Ca2+ influx in response to physiological or even supraphysiological, fluid flow.
Figure 1.2. Representation of the possible physiological role of the polycystin complex. Both on the plasma
membrane and on the primary cilium of renal epithelium cells PC1 and PC2 associate in a functional complex. PC1 is involved in flow sensing and PC2 is associated with Ca2+ transport to the cytoplasm of these cells.
1.3
Cyst formation in ADPKDContinuous dilation of the tubules through enlarged cell proliferation, fluid secretion and, ultimately, separation from the parental tubule will lead to the formation of cysts34. It is still unclear if
cysts specifically arise specifically from a determined nephron segment. Some studies report a generalized pattern, being some deep medullary and superficial cortical events also described35.
Even though, genetically, ADPKD is a dominant disease, it behaves as recessive at the cellular level. A human kidney is constituted of approximately a million nephrons. Nevertheless, microdissection studies indicated that cysts in ADPKD patients arise from about 1000 nephrons36. All
cells from the patient organism possess a germline mutation in one of the polycystins genes alleles, which proves that the germline mutation alone cannot cause cystogenesis, otherwise all cells should develop cysts. A second-hit model was proposed to explain this phenomenon. This model state that every cyst emerge as a product of an individual somatic mutation event in addition to the germline mutation in either PKD1 or PKD2 alleles, leading to total loss of function of the polycystins37-39. This
hypothesis can explain the slow advance of the pathology over several decades.
Recent studies show that late inactivation of the Pkd1 gene in adult mice kidneys resulted in a slow onset of cystogenesis10,40-41. The authors reported that the slow onset of the disease could not be
explained by the previous hypothesis and suggested a third hit theory. This hypothesis states that a cell is not necessarily cystogenic just by having a germline mutation (first hit) and a somatic inactivation of the second allele (second hit)42,43, but by having an additional event that leads to cell proliferation
and cyst growth (such as renal injury)44.
1.4 Impaired transport in ADPKD
Cyst expansion is characterized by tubular cell proliferation, defects in the extracellular matrix and transepithelial fluid secretion45. Since the developed cysts are physically separated from the renal
from a net transepithelial fluid secretion towards the cyst lumen45. This hallmark is not common on the
nephron segments, known to reabsorb approximately 99% of glomerular filtrate. Yet, several studies show an aptitude of the cystic epithelium for fluid secretion46.
Water channels were suggested to play a role in ADPKD impaired fluid transport47. Aquaporins
(AQP) constitute the molecular pore for water transport in the cell membrane48. Most of the cysts
express either (and exclusively) Aquaporin-1 (AQP1) or Aquaporin-2 (AQP2)49. These two proteins
are located on the proximal tubules and principal cells of the collecting ducts, respectively50. Thus, the
type of AQP expressed in a given cyst may shed a light towards its origin. In response to the osmotic gradient (driven by the upregulated Cl- secretion as explained below) water moves across the apical
side of the epithelium towards the cystic lumen, where it accumulates, leading to cyst enlargment51.
Basolateral Cl- uptake was shown to be an important event for cyst lining cells52. Bumetanide is a
loop diuretic that specifically inhibits NKCC1 and NKCC2 family of cotransporters (responsible for electroneutral transport of Na+, K+, and Cl-)53. NKCC1 is expressed on the basolateral membrane of
secreting epithelia54 and several studies detected its expression on cystic cultured epithelial cells and
kidneys54,55. Using bumetanide a reduction of luminal electronegativity and a decrease of fluid
secretion was observed52, meaning that this transporter may be an important pathway for basolateral
Cl- entrance into the cell, a crucial event for its posterior apical secretion56. The Na+/K+-ATPase and
KCa3.1work as functional partners of NKCC1 at the basolateral membrane, recycling Na+ and K+
respectively57,58. The Na+/K+-ATPase also plays a role in the formation of intracellular negative
membrane potential, providing the electrochemical driving force for apical Cl- secretion57.
One of the major causes of epithelial fluid secretion in ADPKD is the apical Cl- transport
stimulated by cyclic adenosine monophosphate (cAMP)59-61. Diverse studies detected an increment of
fluid secretion towards the cyst lumen and an increase in luminal electronegativity in response to cAMP enhancers62. Comparisons between cystic epithelium and properties of other secretory epithelia,
in addition with studies where specific inhibitors were used to propose that the cystic fibrosis transmembrane conductance regulator (CFTR) channel could be the responsible for the cAMP-stimulated Cl- secretion61,63-64.
Several studies have reported CFTR expression in all tubular segments of the human kidney65-67.
Moreover, cultures of ADPKD primary cells and ADPKD kidneys have also shown expression of this protein with apical membrane location68. Yet, some heterogeneity was observed, suggesting that other
Cl- channels might be involved in fluid secretion69-70.
Diverse studies show that several nephron segments can release ATP into the lumen under the influence of certain stimuli, which leads to autocrine and paracrine signaling via the purinergic receptors expressed in the apical membrane of these cells71. Equivalent purinergic signaling has been
documented in ADPKD cysts, where it could stimulate Cl- secretion towards the cysts, through CaCC
activity72,73.
The anoctamin ion channel family (TMEM16) is constituted by 10 proteins which are all probably capable of mediating Ca2+ activated Cl- currents74,75. Together with CFTR, these two proteins may be
Figure 1.3. Model of the transporters and channels involved in fluid accumulation in ADPKD. Several transporters
and channels are implicated in fluid accumulation in ADPKD cysts. Transepithelial Cl- secretion is supported by the
basolateral cotransporter NKCC1, which requires basolateral K+ (via KCa3.1) and Na+ (via Na+-K+-ATPase) recycling, and
occurs on the apical side through cAMP-stimulated (CFTR) and Calcium-activated Cl- channels, stimulated by purinergic
signaling through P2Y and P2X receptors. Net secretion of Cl- drives water movement into the cyst facilitated by Aquaporins.
Polycystin complex is involved in Ca2+ signaling both in the primary cilium and intracellular stores. Retrieved and adapted
from Terryn et al76.
1.5 CFTR and TMEM16A
Mutations in CFTR gene are the cause of Cystic Fibrosis (CF), the most typical and lethal autosomal recessive disease in Caucasians, characterized by an imbalance of ion and fluid homeostasis, which ultimately leads to impaired mucus production and airways infections77. The gene
product of CFTR is a membrane glycoprotein functioning as a cAMP-regulated Cl- channel78.CFTR
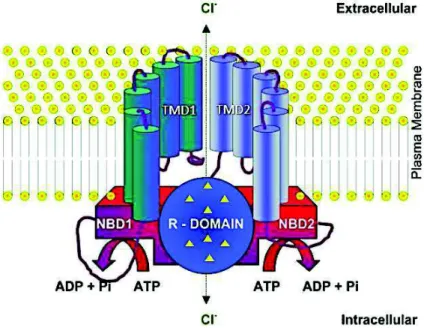
sequence is composed of 1480 amino acids residues and is symmetrically organized in two transmembrane domains (TMD1 and TMD2) and two nucleotide-binding domains (NBD1 and NBD2) separated by an R domain characteristic of the ABC family, from which the protein has evolved (Fig. 1.4)79. The protein is regulated by cAMP-dependent phosphorylation of serine residues in the R
domain by protein kinase A (PKA) followed by ATP binding to the cytoplasmatic NBD, thus resulting in transepithelial Cl- transport80,81. It is expressed in the apical membrane of epithelial cells in several
organs, including the kidney, namely on the proximal tubules (PT), thin limbs of the loop of Henle, distal tubules and collecting ducts66. CFTR has a functional interaction with other channels such as the
epithelium sodium channel (ENaC or SCNN1) 82,83, outwardly rectifying Cl- channels (ORCC)84 and
Figure 1.4. Scheme of CFTR structure. CFTR is located within the plasma membrane and is composed of two
transmembrane domains (TMD1, TMD2), two NBD domains (NBD1, NBD2) and one R domain with multiple phosphorylation sites. Retrieved and adapted from UK Cystic Fibrosis Gene Therapy Consortium86.
CaCCs are anion-selective membrane ion channels, whose activation is dependent on a cytosolic increase of Ca2+ levels87. These channels are present on a variety of cell types, namely epithelial cells88
and play diverse roles in the cell, including epithelial secretion89. CaCCs can be activated either
through Ca2+ influx through the plasma membrane or Ca2+ release from the intracellular stores88.
TMEM16 constitutes a family of ten homologous proteins (TMEM16A-K) characterized by their highly conserved sequence, mostly around the putative pore-forming region74. Their function is not
completely defined: some members are characterized as CaCCs, while others are described as Ca2+
-activated scramblases of the lipid bilayer90. These proteins have a broad expression pattern being
present in almost every cell type91. Their physiological role is related to epithelial Cl- secretion,
volume regulation, neuronal excitability, among others92. Defects in TMEM16 are connected to
several disorders such as the malformation of epithelial organs and bone or muscular dystrophy74. On
the other hand, its overexpression is correlated with different kinds of cancer74.
The most well-studied member of the TMEM16 family is TMEM16A (T16A). This protein is located on the plasma membrane and is activated by an intracellular Ca2+ increment93,94. Diverse
studies showed that TMEM16A contributes to CaCC secretion in a variety of tissues94, including the
kidney, where it plays a fundamental role in proximal tubules protein reabsorption and H+ secretion95.
TMEM16A is also described to conduct Ca2+-activated Cl- secretion and to stimulate proliferation on
cystic epithelial cells96.
The most accurate structure of TMEM16A was recently determined in mouse (mTMEM16). mTMEM16A showed a homodimeric structure with both N- and C- termini located on the cytoplasmatic side of the plasma membrane. Each subunit contains ten transmembrane domains (TMD), an extracellular component, two Ca2+ binding sites and an ion conduction pore (Fig. 1.5)97.
Figure 1.5. Representation of mTMEM16A architecture. One of the monomers is shown in grey. The cytosolic and
extracellular domains are represented in yellow and red, respectively. The permeation pathway is displayed in green and the Ca2+ ions are shown in pink. The rest of the protein is colored in blue. Retrieved and adapted from Falzone et al.97.
1.5.1 Crosstalk between CFTR and TMEM16A
Studies have shown that P2Y purinergic receptors can couple to secondary messengers, namely cAMP and free intracellular Ca2+ 98. Furthermore, [Ca2+]
i controls enzymes responsible for cAMP level
regulation (adenylate cyclase and phosphodiesterases)99. Thus, a functional crosstalk between cAMP
and Ca2+-activated Cl- secretion, and hence CFTR and TMEM16, has been suggested100.
Benedetto et al.101 recently proved this functional overlap by showing an absence of
CFTR-mediated Cl- secretion on airways and intestine of a Tmem16a knockout (KO) mice. TMEM16A was
shown to enhance Ca2+ release from ER store thus activating Store-Operated cAMP signaling, and
Ca2+ regulated adenyl cyclases. This functional dependence may also occur in the kidney, particularly
on ADPKD patients where there is an upregulated apical Cl- secretion and impaired Ca2+ signaling.
1.6 Regulation of Ca2+ signaling by polycystins
It had been shown that both PKD1 and PKD2 play a key role in intracellular Ca2+ homeostasis
regulation, not only on the primary cilium (with the flow regulated Ca2+-sensing- described in section
1.2.1), but also on the plasma membrane and intracellular compartments25.
In the ER, polycystins are known to interact with the inositol 1,4,5-trisphosphate receptor (IP3R)102,103. IP3R is responsible for Ca2+ release of ER internal store and it is activated by
inositol-1,4,5 trisphosphate (IP3). Intracellular IP3 accumulation is triggered through the binding of an agonist like Adenosine triphosphate (ATP) or Uridine Triphosphate (UTP) to a G protein-coupled receptor (GPCR), such as P2Y2 receptors. G protein will then bind to phospholipase C (PLC) triggering the cleavage of phosphatidylinositol-bisphosphate (PIP2) into IP3 and diacylglycerol (DAG). PKD2 can enhance Ca2+ release from the ER by stimulating the activity of this receptor104, whilst PKD1
suppresses this mechanism by a decrease on PKD2-IP3R interaction through a mechanism involving the stromal interaction molecule-1 (STIM1), responsible for sensing Ca2+ levels inside the ER105.
PKD2 is also known to regulate the Ryanodine receptor, (RyR) responsible for ER Ca2+-induced Ca2+
release106. Furthermore, PKD2 is also able to regulate intracellular calcium on the plasma membrane
and primary cilium by interacting with TRP channels, such as TRPC1 and TRPV4107, 108.
Consequently, it has been suggested that both PKD1 and PKD2 might regulate Ca2+ signaling in
different intracellular compartments, and its dysregulation is responsible for the activation of aberrant pathways present on ADPKD, such as the abnormal fluid secretion events. However, the precise nature of these regulatory events is not fully elucidated.
2. Objectives
The main goal of the present work was to uncover the process of cyst development, namely the impaired Cl- secretion (by which ADPKD is characterized), mediated by CFTR and TMEM16A. For this, two different systems were adopted: a cell system (M1) and primary kidney cells isolated from renal cortex and medulla from mice with specific kidney knockout of Pkd1 or Pkd1 together with Tmem16a.
The first aim of this study was to assess if the induction of a cystic phenotype, through the knockdown of Pkd1 or Pkd2 in the M1 cell line, would alter epithelial ion transport. For this, several methodologies were employed. Transport properties were analyzed using differentiated cell monolayers on filter supports in Ussing chamber experiments and on the single-cell level using Patch Clamp and YFP-Quenching techniques.
Furthermore, results obtained with M1 cells were verified with freshly isolated renal cells. For this, we established primary cultures of kidney cells derived from renal cortex and medulla of mice with tissue-specific knockout of Pkd1 or Pkd1 and Tmem16a. Transport properties were measured as described for the M1 cell line.
As changes in intracellular Ca2+ concentration regulate Ca2+ activated Cl- channels, intracellular
Ca2+ levels were assessed by measurements with FURA-2 AM dye.
Better knowledge on polycystins physiological function may lead to a better understanding of impaired fluid secretion, a hallmark of ADPKD and could ultimately lead to the development of new therapeutic approaches.
3. Materials and Methods
3.1 Cell Culture
Cell Culture was performed according to standard procedures using sterile equipment and solutions under a laminar flow cabinet. Cells were grown in 75 cm2 cell culture flasks (Sarstedt AG &
Co. KG, Nümbrecht, Germany), and maintained in an incubator at 37° C in a 5% CO2-95% air
humidified water-saturated atmosphere. Cells were split every 3 to 5 days at 70-90% confluency and, if required, seeded in plastic plates (Sarstedt AG & Co. KG, Nümbrecht, Germany) with the proper density to execute experiments.
3.1.1 Mammalian Cell Lines and Culture Conditions
M1 cells109 were cultured in Dulbecco’s Modified Eagle’s Medium/Ham’s Nutrient Mixture F12
(DMEM F12; Capricorn Scientific GmbH, Ebsdorfergrund, Germany), supplemented with 5% Fetal Bovine Serum (FBS; Capricorn Scientific GmbH, Ebsdorfergrund, Germany), 1% L-Glutamine 200mM (Capricorn Scientific GmbH, Ebsdorfergrund, Germany), 1% Penicillin-Streptomycin (Pen Strep; Capricorn Scientific GmbH, Ebsdorfergrund, Germany) and 1% Insulin-Transferrin-Selenium 100x (ITS; Capricorn Scientific GmbH, Ebsdorfergrund, Germany).
M1 cells stably transfected with eYFP (Enhanced Yellow Fluorescent Protein) with Iodide increased sensitivity were cultured in DMEM F12 supplemented with 5% FBS, 1% Pen Strep,1% L-Glutamine 200mM, 1% ITS and 2,5 !g/mL Puromycin (Thermo Fisher Scientific, Darmstadt, Germany).
Primary kidney cells were cultured in DMEM F12 supplemented with 1% FBS, 1% Pen Strep,1% L-Glutamine 200mM, 1% ITS 100x, 50 nM hydrocortisone(Sigma, Taufkirchen, Germany), 5 nM triiodothyronine (T3; Sigma, Taufkirchen, Germany) 5 nM Epidermal Growth Factor (EGF; Sigma Taufkirchen, Germany).
Primary kidney cells stably transfected with eYFP with Iodide increased sensitivity were cultured in DMEM F12 supplemented with 1% FBS, 1% Pen Strep,1% L-Glutamine 200mM, 1% ITS 100x, 50 nM hydrocortisone,5 nM T3,5 nM EGF and 2,5 !g/mL Puromycin.
Human Embryonic Kidney 293T cells (HEK 293T)110,111 were cultured in Dulbecco’s Modified
Eagle’s Medium (DMEM; Capricorn Scientific GmbH, Ebsdorfergrund, Germany) supplemented with 10% FBS.
All cells were tested for mycoplasma infection, being mycoplasma free.
Cells were split using Trypsin. To trypsinize cells from flasks, cultured medium was first removed by aspiration and cells were washed with Ca2+ and Mg2+ free Dulbecco’s Phosphate Buffered Saline
(PBS; Capricorn Scientific GmbH, Ebsdorfergrund, Germany). Trypsin (Life Technologies - gibco®, Karlsruhe, Germany) was added to culture flasks and incubated at 37°C, 5% CO2 for 10 min. To stop the trypsinization process, medium containing 1% FBS (Primary kidney cells and Primary kidney stable cells) or 5% FBS (M1 and M1-YFP cells) or 10% FBS (HEK 293T) was added to the cell suspension, which was then centrifuged at 20 000 rpm for 4 min. After centrifugation, the supernatant was discarded and cells were resuspended in fresh culture medium.
3.1.2 Cell Culture on filter support
For assays which required polarized cells, specifically micro-Ussing Chamber, M1 and primary kidney cells were seeded into 12mm filter inserts with 0.4 !m Pore Polyester Membrane and 0,6 cm2
surface area (Merck KGaA, Darmstadt, Germany). This type of inserts allow cells to polarize and, to acquire an apical and basolateral side mimicking physiological conditions. To achieve this purpose, cells were seeded on the apical side of the filter at a density of 3 x 10⁵ cells per filter, using appropriate culture media (described in section 3.1.1). The filters were maintained in liquid-liquid interface. Cells took approximately 4-6 days to polarize.
The transepithelial electrical resistance (TER) was routinely measured using a Millicell-ERS volt-ohmmeter (Merck KGaA, Darmstadt, Germany). Experiments were performed after obtaining a stable TEER with levels above 600 "/cm2.
3.1.3 Transient Transfections
All transient transfections were carried out using LipofectamineTM3000 transfection reagent (Invitrogen GmbH, Karlsruhe, Germany), according to manufacturer´s guidelines. Lipofection is a transfection methodology that takes advantage of the ability of cationic lipids to form unilamellar liposomes that adsorb molecules of nucleic acid (negatively charged). Use of this method allows downregulation of target genes, by small interfering RNA (siRNA), or protein expression by using plasmids.
PKD1 and PKD2 (M1 cells) and TMEM16A (M1-YFP cells) endogenous expression were downregulated using siRNAs (Ambion®, Darmstadt, Germany) allowing the downregulation of the respective encoded proteins PC1 and PC2. The decrease of expression was then confirmed by Reverse Transcriptase Polymerase Chain Reaction (RT-PCR) and Western Blot (WB). A negative control (scrambled; Ambion®, Darmstadt, Germany) with no sequence similarity for human, mouse or rat gene sequences was used to control the effects of the siRNA delivery. For patch clamp and single-cell YFP quenching measurements, all transfections were done using a siRNA containing PKD1, PKD2 or TMEM16A sequence linked to a CD8 receptor. Experiments and collection of RNA for RT-PCR and protein for WB were done between 24h and 72h after transfection.
3.1.4 Production of lentivirus and stable cell lines generation
Lentivirus with pLVX-puro were produced in HEK293T cells and both M1 and primary kidney cells were transduced with these viruses.
Firstly, HEK 293T cells were seeded on T75 flasks (diluted 1:6) and incubated overnight. Then, cells were transfected with 35 µg of DNA (16.66 µg of pLVX-puro-hsYFP-shScrambled or shPKD1 or shPKD2), 16.66 µg of plasmid pCMV-dR8.74psPAX2, 1.68 µg of envelop plasmid VSV-G/pMD2.G) with the methodology described in section 3.1.3. On the next day, the medium was changed to remove the transfection reagent and cells were incubated for another 30h. After the packaging, cells were discarded and the medium containing the lentiviruses was harvested, filtered with a 0,45µm filter and immediately used to transduce M1 and primary cells. Cells were infected with 7-8 mL of pLVX-puro-HS-YFP-shRNA virus with Hexamethrine bromide (Polybrene; Sigma-Aldrich, Taufkirchen, Germany) infection enhancer (8 µg/mL final concentration), the plates were incubated for 1h at room temperature (RT) and then incubated for 24h. The medium was changed to normal medium containing half of the concentration needed of antibiotic to kill all the non-infected cells (1.25 µg/mL of puromycin) and cells were incubated for 24h. After, the medium was changed
and supplemented with 2.5 µg/mL of puromycin. Later, the medium was changed every 48h and cells were kept in culture.
3.2 Molecular Biology 3.2.1 cDNA and siRNA
All the cDNA and siRNA used and mentioned in this study are described in Appendix I. 3.2.2 RT-PCR
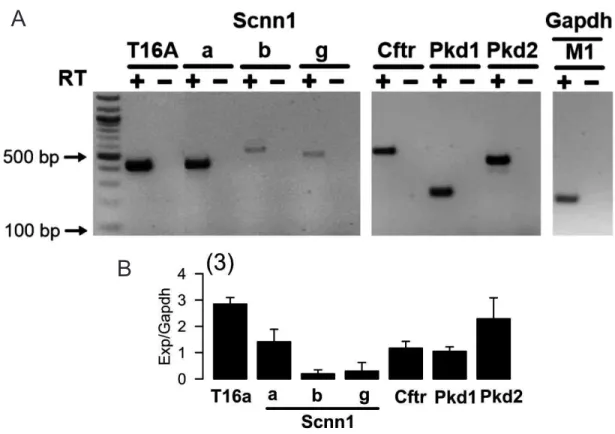
Expression of mRNAs encoding Cftr, Tmem16a Pkd1, Pkd2 and Scnn1 were examined in M1 and primary kidney cells by RT-PCR. Total RNA (1µg/ 50µL reaction) was reverse transcribed using a random primer (Promega, Manheim, Germany) and M-MLV Reverse Transcriptase RNase H Minus (Promega, Mannheim, Germany). Each RT-PCR reaction contained sense and antisense primer (0,5 µM) for Glyceraldehyde 3-phosphate dehydrogenase (Gapdh), Tmem16a, Pkd1, Pkd2, Scnn1 or for Cftr (see Appendix II, Table II.1), 0,5 µL cDNA and GoTaq Polymerase (Promega, Mannheim, Germany). RT-PCR program can be found in Appendix II, Table II.2. PCR products were visualized by loading on ethidium bromide-containing agarose gels and analyzed using Meta Morph Vers. 6.2 (Molecular Devices, USA). As a positive control, a fraction of (GAPDH) was used. RT-PCR analysis was kindly provided by Prof. Dr. rer. nat. Rainer Schreiber.
3.3 Animal models
All experimental protocols were approved by the local councils for animal care and were conducted according to the German laws for animal care and the Guide for the Care and Use of Laboratory Animals, published by the National Institutes of Health.
Tamoxifen-injected animals were kindly provided by PD Dr. med. Björn Buccholz (Department of Nephrology and Hypertension, University of Erlangen-Nuremberg, Erlangen, Germany). Animal genotyping was confirmed by RT-PCR.
Two tissue-specific knockout animal models were used: Ksp Cre+/ PKD1flox/flox and Ksp Cre+/
ANO1/PKD1flox/flox. These mice had a specific knockout on renal tubules directed by a kidney specific
cadherin promoter (Ksp) associated with a Cre expression cassette. This specific knockout required the administration of tamoxifen, a selective modifier of estrogen receptor, to induce recombinase activity. 3.3.1 Isolation of Primary Kidney cells from cortical preparation
Mice were killed by cervical dislocation after being exposed to CO2 and the kidney was removed
and kept in ice-cold DMEM F12 medium on a petri dish (Thermo Fisher Scientific, Darmstadt, Germany). The capsule from the kidney was removed by squeezing, under the flow, and put in another drop of medium. With a sharp blade (Heinz Herenz,Hamburg,Germany) the cortex was cut off and chopped into smaller pieces, to facilitate the digestion in a small flask with 5 mL Hank’s Balanced Salt Solution (HBSS; (Life Technologies - gibco®, Karlsruhe, Germany) buffer (previously bubbled with 95% O2 and 5% CO2), 5 mL DMEM F12 and 10 mg Collagenase type 2 (Worthington, Lakewood, USA) then incubated for 40 min at 37° C with a magnetic stir. The digested tissue was passed through a 100µm cell strainer (Merck KGaA, Darmstadt, Germany) to a 50 mL falcon tube, pressed with the end of a syringe and washed out with ice-cold PBS. After centrifuged for 4 min at 5100rpm at 4° C,
the pellet was re-suspended and a Percoll gradient of 45% Percoll (Ge Healthcare GmbH, Munich, Germany) and 55% 2X PBS-Glucose was run at 17500rpm for 30 min, at 4° C. The gradient resulted in different bands, being the second one from the bottom pipetted out and collected in a 50 mL falcon tube. After washing with ice-cold PBS three times (at 2200rpm, for 4 min at 4°C), the pellet with isolated proximal tubules (PT) was re-suspended in 10mL of adequate media (described in section 3.1.1) in 75 cm2 cell culture flasks and maintained in an incubator. After 24 hours, primary cells
started to outgrow from the cultured tubules.
3.3.2 Isolation of Primary Kidney cells from medullary preparation
The primary medullary cells were isolated in a similar manner to the cortical preparation (described in section 3.3.1). The medulla was cut off, chopped and digested. After the digested tissue being passed by a 100 µm cell strainer, the Percoll gradient step was skipped and the tissue was centrifuged once for 4 min at 5100rpm at 4° C.Then the preparation was washed with ice-cold PBS and centrifuged three times (at 2200rpm, for 4 min at 4°C). Subsequently, the pellet was re-suspend in 10mL of appropriate culture media (described in section 3.1.1) ) in 75 cm2 cell culture flasks, and
maintained in an incubator.
3.4 Analysis of protein expression and histology 3.4.1 Immunocytochemistry on primary kidney cells
TMEM16A and Acetylated tubulin protein expression were detected in primary cells (Appendix III- Fig. III.3). For this, cells were washed once with PBS+ (PBS with 0.1mM Ca2+ and 0.5mM Mg2+)
at RT. Then were fixed for 10 minutes with 4% Paraformaldehyde (PFA) solution at RT. Cells were rinsed three times with RT PBS+ to remove any leftover of the fixing solution and were incubated with 0,5% (v/v PBS+) Triton X-100 for 10 minutes at RT. After a second rinse for three times with RT PBS+, 1% (w/v PBS+) bovine serum albumin (BSA; Carl Roth Gmbh, Karlsruhe, Germany) was added and left in incubation for 40 min at RT. For co-localization of TMEM16A with primary cilium, the primary antibody rabbit anti-TMEM16A (with a dilution factor (DF) 1:300; Davids Biotechnologie, Regensburg, Germany) and mouse anti-acetylated tubulin (DF 1:300; Sigma, Taufkirchen,Germany) were incubated using PBS+ supplemented with 1% BSA 1h, at 37°C. Cells were once again washed three times with RT PBS+ and incubated with the secondary antibodies Alexa Fluor 488 conjugated Donkey Anti-Rabbit IgG (DF 1:300; Molecular Probes,Oregon, USA), Donkey Anti-Mouse (DF 1:300; Molecular Probes, Oregon,USA) and 0,1 µg/mL (v/v PBS+) Hoechst 33342 (DF 1:200; Aplichem, Darmstadt, Germany), for 1 h at RT. The cells were again rinsed three times with PBS+ and the coverslips were mounted with Fluorescence Mounting Medium (DAKO Cytomation, Hamburg, Germany).
Immunofluorescence was detected in a ApoTome Zeiss Axiovert 200M microscope (Zeiss, Oberkochen, Germany) equipped with ApoTome and Axio-Vision (Zeiss, Oberkochen, Germany). 3.4.2 Histology of renal cryosections
Cryosections were air dried for several minutes to remove moisture. Then, sections were stained with filtered 0,1% Mayers Hematoxylin (Sigma, Taufkirchen, Germany) for 10 minutes in a 50 mL conical tube. Afterwards, sections were rinsed in cool running double distilled water (ddH2O) inside of
a Coplin jar. Sections were then dipped in 0,5% Eosin for 12 times and dipped in dH2O until eosin
stops streaking. Later, sections were washed in Ethanol (EtOH) gradients progressively (50%-70%-95%-100%) for 1 minute each. Finally, cryosections were dipped in xylene several times and slides
ere cleaned with a kimwipe and mounted on a coverslip with Cytoseal XYL mounting media (Thermo Fisher Scientific, Darmstadt, Germany). Histology studies were kindly performed by Inês Cabrita 3.4.3 Western Blot
PKD1,PKD2 and TMEM16A expression was downregulated in M1 cells (see section 3.1.3 – Transient Transfections and 3.1.4- Production of lentivirus and stable cell line generation) and confirmed by WB. In order to accomplish this, protein was collected from cells and kept in a lysis buffer (mM: 50 Tris-HCl, 150 NaCl, 50 Tris, 100 DTT, 0.5% NP-40, 1% protease inhibitor cocktail) - Roche, Germany. Then, protein content was separated in a 7% SDS-PAGE Polyacrylamide gel and separated proteins were transferred to a nitrocellulose membrane (GE Healthcare Europe GmbH, Munich, Germany). To detect the protein, the membrane was incubated with primary antibodes (DF 1:400 – 1:1000) O/N at 4º C. Proteins were visualized using a suitable (HRP) conjugated secondary antibody (Dilution Factor of 1:10000) and ECL Detection Kit (GE, Healthcare, Munich, Germany). Protein bands were detected using a FujiFilm LAS-3000 (FujiFilm, Tokyo, Japan). Experiments were kindly performed by Silvia Materna-Reichelt.
3.5 Measurements of Ion channel activity and Ca2+ signaling
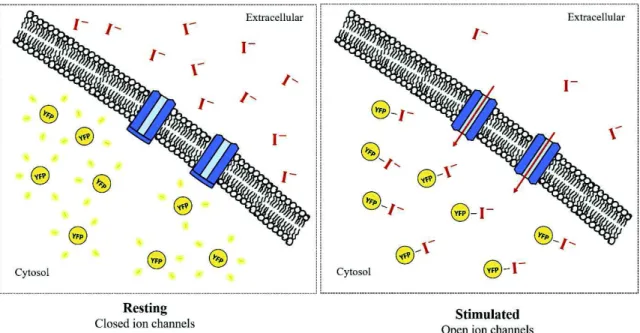
3.5.1 Assesment of Cl- permeability through YFP Quenching assay
This methodology relies on the aptitude of a Yellow fluorescent protein to sense halide concentration on its environment. This protein can bind halide ions, namely Iodide (I-) and Chloride
(Cl-) through its cavity with a specific binding site. When this ion species bind this cavity a quenching
phenomenon occurs, leading to a decline of YFP fluorescence intensity. The use of this assay can provide insights about ion channel activity (Fig. 3.2).
M1 cells and primary kidney cells were seeded in collagen/fibronectin 18 mm coated glass coverslips and then mounted in a chamber on a stage of an Axiovert S100 inverted microscope (Zeiss, Oberkochen, Germany). YFP fluorescence was detected using a Flua 20x objective (Zeiss, Oberkochen, Germany) and a high-speed polychromator system (VisiChrome, Visitron Systems, Puccheim, Germany), at an excitation wavelength of 485 nm, and emission 520-545 nm using a CCD-camera (CoolSnap HQ, Visitron Systems,Puccheim, Germany).
The bath was perfused at 37º C initially with Ringer 5mM Cl- solution (mmol: 140 NaCl; 0.4
KH2PO4; 1.6 K2HPO4.3H2O; 5 Glucose; 1 MgCl2.6H2O; 1.3 Ca-Gluconate.1H2O; 5 Na-Gluconate)
and posteriorly with Ringer 5mM Cl- 5mM I- (mmol: 140 NaCl; 0.4 KH
2PO4; 1.6 K2HPO4.3H2O; 5
Glucose; 1 MgCl2.6H2O; 1.3 Ca-Gluconate.1H2O; 5 NaI).
The software package Meta-Fluor (Universal imaging, New York, USA) allowed imaging acquisition and data analysis.