MPRA
Munich Personal RePEc Archive
Unconditional Basic Income: Who gets
it? Who pays for it? A social Accounting
Approach to Distribution.
Utz Peter Reich and Susana Santos
University of Applied Sciences (em.), Mainz, Germany, ISEG
-Lisbon School of Economics and Management - UECE (Research
Unit on Complexity and Economics) and DE (Department of
Economics). Universidade de Lisboa, Portugal
22 August 2018
Online at
https://mpra.ub.uni-muenchen.de/88611/
MPRA Paper No. 88611, posted 27 August 2018 11:04 UTC
Unconditional Basic Income: Who gets it? Who pays for it?
A social Accounting Approach to Distribution
Utz Peter Reich University of Applied Sciences (em.), Mainz, Germany [email protected] Susana Santos1 ISEG ‐ Lisbon School of Economics and Management ‐ UECE (Research Unit on Complexity and Economics) and DE (Department of Economics). Universidade de Lisboa, Portugal [email protected] (August 2018)This paper was prepared for the 35th IARIW General Conference [Copenhagen ‐ Denmark, 20‐ 25/8/2018].
Abstract: Unconditional basic income is not a new topic in political economy, and it gains new
momentum as more and more research is being devoted to it. The discussion focusses on the adequacy and effects such a policy measure may entail for a person and his socio‐economic situation, usually. Object of investigation is the individual, and the corresponding theory is of micro‐ economic descent. In this paper, in contrast, we develop a method of how to assess feasibility and consequences of an unconditional basic income for a modern, open economy, on the macroeconomic level, using concepts and statistics of a Social Accounting Matrix (SAM) as our main tool. A SAM‐based approach can measure, and perhaps model, the impact on the economic activity of a country, and on its economic institutions of new policy measures such as introducing an unconditional basic income.
The economic activity of a country is expressed in monetary flows as registered in the National Accounts. So their underlying principles and definitions are adopted. However, the habitual way of putting an economy into a sequence of institutional accounts connecting each institution’s income to the cost, ‐ similar to business accounting ‐ reveals only one, namely the inner‐institutional half of the economic circuit. The other, outer half, namely, how the costs of one institution generate income for another one is better captured by the format of a Social Accounting Matrix. In the paper, the impact of an unconditional basic income is quantified, for macroeconomic aggregates of institutional sectors and socio‐economic groups of households, taking the German and the Portuguese economies as examples. Purpose of the paper is not to argue for, or against, an unconditional basic income, but to offer a scientific tool with which to calculate and assess possibilities and consequences of the proposal, for a national economy as a whole. Keywords: Social Accounting Matrix; Unconditional Basic Income; Income Distribution. JEL Classification: E01; E02; E16; E64
CONTENTS 1. Introduction: Present state of the economic theory of income distribution ... 1 2. Unconditional basic income: an old idea in new disguise ... 8 3. Macroeconomic analysis: the national distribution of income flows ... 13 4. Approach applied to Germany ... 16 5. Approach applied to Portugal ... 20 6. Conclusion ... 33 References ... 33 Appendices I. Income Incidence Matrix estimated for Germany (million Euros) ... 36 II. Social Accounting Matrix of Portugal in 2015 (million Euros) ... 38
1. Introduction: Present state of the economic theory of income distribution
The idea of an “unconditional basic” income is not new. It has its predecessors in the history of economic thought, never realized in practice, but appearing and re‐appearing whenever there is political debate about how to repartition the value added generated by an economy among its individual institutions and members. Increasing inequality of incomes, which has marked the last decades of world economic development is such an issue, today, and so the idea of a lower boundary to that inequality is proposed, and tested, as a possible answer (Vanderborght and Van Parijs 2005).
At the same time, and quasi as a counterpoint, the topic of income distribution lost relevance, in academic circles. It has disappeared from the standard curricula of economics departments. Twenty years ago, before introduction of the famous Bologna reforms, an ordinary economics student was trained in three fields of study, microeconomics, macroeconomics, and last, but not least, distribution of income, at (West‐) German and Portuguese universities. One chair would always be devoted to that topic, in an ordinary economics department (Bartmann 1981). Today, neither the bachelor nor the master of economics get a taste of it. Income distribution is not a field of learning in standard economics, any more. Given that disinterest on the theoretical side, it is natural that new research on income distribution, triggered by the phenomenon of newly rising inequality has not been founded on economic theory, but grew as a quest for more and new data, and as a mainly statistical endeavour. In this line of thought, the social activity of partitioning the national income is treated as being similar to the statistical “distribution” of a random variable around its mean. The corresponding scientific work was perceived as the task to choose and single out, from the plethora of distribution measures that exist, a specific index that would be used as a standard. Distribution of income being essentially an asymmetric affair, ordinary measures of variance and coefficients of distribution seemed to be inadequate, and, as a result, the Gini‐coefficient has been established as the generally accepted measure of income inequality, now. In this way, the problem of how to distribute an income generated by a society is dealt with on a formal level, and conceived as being no different from describing any other “distribution of frequencies” occurring in a technical process. Distribution of income, in the abstract statistical approach, is treated as ”dispersion”, as a pure measurement issue
implicitly postulated as ideal, namely equality of incomes. “The problem with which we are concerned is basically that of comparing two frequency distributions f(y) of an attribute y which for convenience (sic!) I shall refer to as income.” (Atkinson 1980, p. 23)
The purely statistical approach, and absence of economic theory, has its consequences. Firstly, it implicitly defines an illusionary political ideal, namely equality of all incomes. If a lower Gini coefficient is preferable to a high one, and if there is no other theoretical bound a Gini coefficient of zero appears as the best of all distributional states, implicitly while, secondly, no way, or method, of how to attain that ideal may be deduced from the research. It needed a political breakthrough such as the book written by Thomas Piketty (2014) to bring the issue of income distribution back into the academic economics arena, and the proposition of an unconditional basic income is a result of that new social movement. Yet, the simplistic academic approach to the distribution of a nation’s income ‐ as a mere problem of measuring a quantitative variable appearing under statistical disturbances ‐ has not failed to produce its simplistic counterpart, in the political arena: “At the root of our present preoccupation with equality is the instinctive notion that differences somehow need to be justified. But although this is very frequently asserted there is no obvious reason…why it should be so. Why should equality …be the point of reference from which any existing distribution of resources must be measured?...An equal society of a kind which had never existed in the recorded history of mankind save among the most primitive nomadic hordes, became the norm by which all advanced societies were to be measured and judged. Only when one remembers this striking sleight of hand is it possible to understand why Professor Atkinson for example should have it found unnecessary to devote no more than one page of a book wholly concerned with describing real or imagined inequalities, to explaining what was wrong with them.” (Keith, J. and J. Sumption 1979, p. 83) And the authors continue: “The Professor’s view rests ultimately upon a false analogy between the distribution of wealth and the sharing out of cakes, which frequently adorns editorials and political speeches. The analogy runs something like this. If a mother has baked a cake for her five children and she divides it into five equal parts, nobody will expect her to justify this division. Only if she divides it unequally will an explanation be expected. The explanation may be that the largest slice goes to the best‐behaved child, or to the neediest, but explanation of some sort there must be. What, asks the egalitarian, is the explanation for a distribution of national wealth, which accords
neither with perceived merit nor with need? The notion that all men are the same except that some happen to have more money than others is simply untrue, and it is implicitly recognized to be untrue by everyone who suggests that a controlled economy is a rout to an equal society. By and large, differences of wealth do represent real differences of economic aptitudes; they also reflect real differences in the value of individual contributions to the total wealth which exists in a society… He owes it to his own talents, not to the society in which he lives, and if somebody else proposes to take it away from him, it is incumbent upon that other to advance some satisfactory reason for his proposal.” (p. 87f) Whatever one thinks of the general battle against “egalitarianism” in which the authors indulge with their book at large, their critique that a simple strive for equality in terms of a smaller Gini‐index cannot form the basis of an intelligent and convincing income policy in a developed economy is hard to refute. That purpose requires more of theory, evidently, but also more tools of statistics describing the actual state of affairs. Concerning the first issue, the political side of the matter, it is true that little material is found that may be of help, in the actual teaching of economics. Here it is worth, rather, to look into a neighbouring social science discipline, such as sociology (Groß 2008) or political science (Bolz 2009). Concerning the second issue of enhancing statistical information, we propose to compile a social accounting matrix as a macroeconomic complement to the microeconomic Gini‐index. The Gini‐index is a count of independent and non‐interacting individuals, the atoms – so to speak ‐of a society. It represents each individual with his income, alone. A social accounting matrix, in contrast, constructs a macroeconomic context around the individual household, in the same way as national accounts and input‐output tables serve as a framework for studying the economic actions of individual enterprises and businesses. While the classical schemes of national accounts and input‐output tables focus on the production and circulation of goods and services a social accounting matrix explicates generation and circulation of the corresponding flows of income in all its different forms and ways of payment.
“All men are created equal.” Does that first sentence of the declaration of independence imply equality of personal incomes? Evidently not, or the historic practice of the United States would have to be judged unconstitutional. On the contrary, a society consists of, and joins individuals of very different characters and capabilities, one of the variables by which to distinguish them being their
theory of “The structure of social inequality” (Vanfossen 1979) An example of designing such a structure is given by table 1.
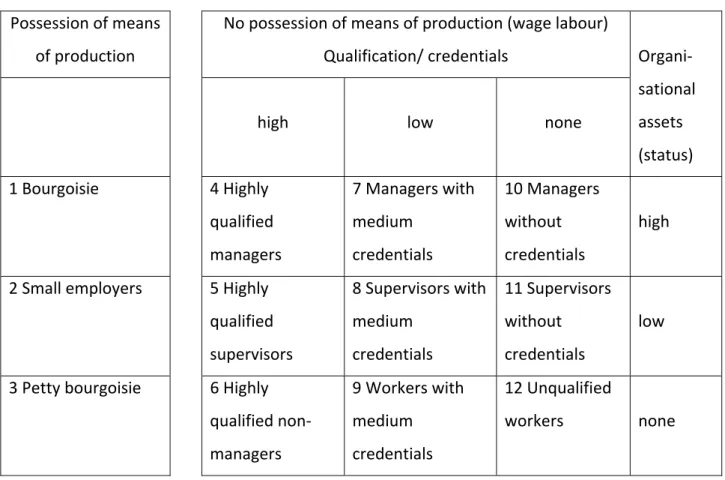
The table distinguishes two classes of households existing in a society, the owners of means of production on the one hand, and the non‐owners, on the other. The latter are the majority of people and they earn their living by working for the owners, receiving a wage in return. That simple dichotomy must be diversified, in order to reflect the actual complexity of a society in more than one dimension. If the economic Gini‐index is to be criticized for its one‐dimensionality, the simple dichotomy of owner and non‐owner is also inadequate as a description of a developed economy. Further dimensions are articulated in the table. The “Bourgoisie” owns enough capital to employ other workers, they do not necessarily work themselves. The “Small employers” may employ other workers, but work themselves, as well. Households of the “Petty bourgoisie” own just enough capital for making a living, themselves, but are unable to employ further labour.
The other, larger group of non‐owners may be further divided in two dimensions, one is the organizational power over subordinates (the vertical direction in table 1) and the other is credentials of qualification (horizontal direction in table 1). Groups 4, 5, and 6 have in common high qualification, but they differ in respect to the power they exert within their organization, such as the number of workers they control, for example. Managers 4 stand above the supervisors 5, and group 6 employees do not manage at all, performing highly qualified work, nevertheless. Groups 7, 8, and 9 follow the same pattern except that their members have lower credentials of qualification. By the same logic, you have finally a group of workers, shown in the last column to the right whose members have no credentials, at all, but work at different levels of an organizational hierarchy. The two dimensions of qualification and organizational power are independent, so the table suggests, although an empirical correlation may, of course, be observed in reality. Table 1 is not the only way to classify and structure a given society; other schemes exist, and are used (Lepsius 2015). Nevertheless, it is sufficient for demonstrating that equality of different incomes in the sense of minimising a national Gini‐index is not a sensible political or economic goal to attain, in itself, but that other variables must be taken into account in order to assess equality or inequality of incomes within in a developed economy in a meaningful way.
Table 1 Class structure of a society
Source: E. O. Wright, quoted from M. Groß (2008) p.84
Table 1 expresses an inequality, not in terms of a quantity (“income”), but in quality (“qualification”). Statistically speaking, a population over which you distribute income is not homogeneous, as is supposed in the Gini‐index; in using that index, we compare as one says, apples with pears. The SAM approach allows to deal with that inhomogeneity, if only at an aggregated level. Enterprises and households are grouped in a specific classification derived from, or similar to, the one shown in table 1, and substantiate the fact of inhomogeneity, and thus incomparability, at the macroeconomic level. There are two theoretical goals discussed in income politics: one is equality of all incomes, across the economy, implied by the Gini‐index. The other one is known as the poverty approach, where you recognise the difficulty of comparing different social positions, and are satisfied with guaranteeing a certain minimum level of income for every citizen, which is also a way of expressing a certain equality between them. The project of an unconditional basic income belongs to the latter. In this paper, we develop a method for assessing the feasibility and consequences of an unconditional basic income for a modern, open economy, at the macroeconomic level, using the Possession of means of production No possession of means of production (wage labour) Qualification/ credentials Organi‐ sational assets (status)
high low none
1 Bourgoisie 4 Highly qualified managers 7 Managers with medium credentials 10 Managers without credentials high 2 Small employers 5 Highly qualified supervisors 8 Supervisors with medium credentials 11 Supervisors without credentials low 3 Petty bourgoisie 6 Highly qualified non‐ managers 9 Workers with medium credentials 12 Unqualified workers none
can measure, and perhaps model, the impact on the economic activity of a country and on its economic institutions of new policy measures, such as introducing an unconditional basic income. We begin with some remarks about the roots and evolution underlying the idea of an unconditional basic income (Section 2). We then construct the circuit of income flows that underlie and feed the macro economy (Section 3). To conclude, we analyse the impact if such an income is quantified, using macroeconomic aggregates of institutional sectors and socio‐economic groups of households, taking the German and the Portuguese economies as examples (Sections 4 and 5, respectively). The purpose of the paper is not to argue for, or against, an unconditional basic income, but to offer an analytical tool with which to calculate and assess the possibilities and consequences of the proposal, for a national economy as a whole. 2. Unconditional basic income: an old idea in new disguise Within the simple three‐polar economy discussed by Francois Quesnay, the role of income is well defined and simple. The peasant class must be fed, in order to enable it to work, the artisans in towns are sterile, they consume what they produce, and income of the economy consists of the economic surplus, namely the rent received by the lords and owners of land, only. Today’s picture of an economy looks different, but in one aspect, it is still alike. Income is not a one‐way affair, but it circulates within the economy among the economic institutions, and the speed with which it circulates is just as important as its size. Not bad harvests are the imminent dangers, but slumps in the circulation of commodities, and as a result, of income. Basic income, in the world of Quesnay, would be the cost of keeping the peasant class alive and able to perform their work. It is conditional on that task. Income of the feudal class is also conditional in that it is coupled to the ownership of and authority over productive land. The modern version of this twofold conditioning is well expressed by the national accounts (table 2). First, there is the claim of labour, registered in the account “generation of income”, because that is what labour does. The account then defines the “operating surplus” remaining with the producing unit after having paid its producers. All kinds of property income (interest, dividends, and rents) are paid out from it, and received in addition, as well, ‐ resulting in a balance defined as “primary income”. Finally, all transfers paid and received are registered on the “secondary distribution account”, yielding “disposable income” as its balance. It
is this disposable income, which stands in the center of distribution analysis, at present, and its modification is the topic of unconditional basic income. Table 2 Logical sequence of national income measures Expenditures Revenues Generation of Income Account Compensation of employees Operating surplus Value added generated Primary Distribution Account Property income paid Primary income Operating surplus Property income received Secondary Distribution Account Transfers paid Disposable income Primary income Transfers received At this point, the microeconomic point of view and its macroeconomic complement diverge. The economic man, the figure represented by a utility maximizing individual takes his disposable income as given and decides about how to spend it. Disposable income is in focus here because it is deemed to represent a measure of welfare. What happens in the economy before that income is put at the disposition of some individual citizen is irrelevant, in that view. The macroeconomic view, in contrast, begins before that. Recognising that fact that income is generated by production of goods and services, only, the different ways of forming and distributing it among the economic units of an economy stand in the center of attention. In this perspective all institutional units of an economy are related to one another by way of different kinds of income flows, forming an open or closed but at any rate a full and complex economic circuit, among themselves. Not maximization is the aim, but rather regularity of incomes over time, avoidance of gluts or crises of the value flow. It is a much more dynamic concept than the microeconomic view, and based on national accounts while the microeconomic view uses household ledgers as it main source of statistical information and set of
explanatory variables. This paper takes the macroeconomic approach attempting to integrate the microeconomic aspect into it.
The concept of unconditional basic income has become increasingly popular among economists, managers, activists and entrepreneurs as an alternative to traditional social policy. Instead of providing social benefits in an emergency situation, or unemployment or old age, government would pay every adult the same amounts as a lump sum in the future – around 1,000 ‐ 1,200 Euros a month. There would then be no social benefits, no Hartz IV (Germany’s long‐term jobless benefits), and most likely no pension or unemployment insurance. This universal basic income promises, so the idea, each person the freedom to decide if they want to be employed, to do volunteer work – or do nothing at all. It relieves politicians of the worry about unemployment. In addition, it gives companies an elegant way to carry out job cuts. Jobs that fall victim to technological change or globalisation are no longer a problem, as those affected are financially secure and can look after their children at home. Nevertheless, the basic income may be turn out to be unfeasible. The reason for this, of course, is financing. Its costs are difficult to quantify, but it is certain that they will be high. Just how income and wealth should be taxed to pay for it remains an open question. Radically transforming the social system to a basic income would be the greatest financial experiment in recent history.
The idea is controversial, and discussed in all corners of the political arena. There are people who support it, on the left wing as well as on the right wing of the political spectrum, and there is opposition on both sides as well (Neuendorff et al. 2009). Two observations motivate people to consider the idea. The trickle‐down theory that economic growth will reach the poor, once it has begun with the rich is no longer true. Wages have stagnated over the last decades while high property incomes have thrived. On the other hand, the equally old idea of hard work as a sufficient lever to a satisfactory income has been disappointing. In contrast, the economic assumption of work as “disutility” as something that is and must be compensated by the wage also has lost credibility. When asked whether they would continue going to work with a basic income between 70 and 80 percent of the German population would continue going to work. (Handelsblatt 2018)
A crucial point is the effect of the new measure on the labour market. It decouples work from income, in spite of the fact that income is generated only through work. The incentive to work, of being paid for the disutility of doing it, will be suspended and it is unknown how this will affect the
supply of labour. It may be that people, being lazy by nature, will stop working, and not do anything (Hüther 1991). It may also be, in contrast, that the assured minimum existence allowance sets free forces for self‐determined and self‐satisfying work: make up your own company, join in public unpaid social activities, raise and care for children or parents (Götz and Goehler 2010). On the demand side, wages may shrink, may also become more equal, as the subsistence level is guaranteed. Another area of concern is finance. Where should the money to pay for the basic income come from? If it is taxes, how and on what should those taxes be levied? Would that create more or less equality? On the social side, a main argument is that a basic income would eliminate poverty in an otherwise rich society, and thus enhance solidarity and communal interest. The question is then what to do with those institutions that have been created in history, precisely, for that purpose. Table 3 summarises schemes, which have been proposed for Germany. The estimated amounts vary between 400 and 2000, averaging around 1000 € per month. The required finance lies between 306 and 731 billion € per year, to be raised, essentially by means of a flat tax on all other gross income. Social benefits of health and nursing care are not reduced, but covered by insurance. In response to what they would do in case of receiving an unconditional basic income a sample of 600 working people answered: 50 percent would continue working, 20 percent would wait and see, 6 percent look for a different job, 15 percent would work less hours per week and 10 percent would stop working. 60 percent of the sample find a basic income makes sense, they believe, however, that 30 percent of their fellow citizens would quit their job, while only 15 percent of the respondents would quit themselves if they had a basic income of 1250 € per month. (Handelsblatt 2018). Table 3 Schemes of unconditional basic income proposed for Germany Author Monthly Amount Yearly
Requirement Financial Resources Left Party 2014 540 € under age of 16 1080 € over age 16 474 bill. € 33.5 percent fee on all gross incomes SPD County Rhein‐Erft 2010 500 € under age of 18 800 € over age 18 731 bill. € 50 percent flat tax on all gross incomes, basic income deducted from tax bill
Author Monthly Amount Yearly Requirement Financial Resources Emmler/Poreski (Greens) 2008 400 € under age of 18 500 € over age 18 plus 360 € for housing and heating 327 bill. € 25 percent flat tax on all gross incomes D. Althaus (CDU) 2010
400 € plus costs for
housing and heating 306 bill. € 40 percent flat tax, increase value added tax to 19 percent Th. Straubhaar 2017 600 € to 2000 € depending on amount Flat tax Israel/Mai (Pirates) 2012 900 € including lump sum for housing 566 bill. € 50 percent flat tax and 15 percent additional tax for housing R. Carls 2016 500 € under age of 18 1100 €above age of 18 63 bill. € 1) 62.5 percent flat tax, only one class, no deductions 1) Probably a printing error, given the other estimates, 630 bill. €, perhaps. Source: Handelsblatt (2018) The political argument goes like this: If some other group of people controls resources necessary to an individual's survival, that individual has no reasonable choice other than to do whatever the resource‐controlling group demands. Before the establishment of governments and landlords, individuals had direct access to the resources they needed to survive. But today, resources necessary to the production of food, shelter, and clothing have been privatized in such a way that some have gotten a share and others have not. Therefore, this argument goes, the owners of those resources owe compensation back to non‐owners, sufficient at least for them to purchase the resources or goods necessary to sustain their basic needs. This redistribution must be unconditional because people can consider themselves free only if they are not forced to spend all their time doing the bidding of others simply to provide basic necessities to themselves and their families. Under this argument, personal, political, and religious freedom are worth little without the power to say no. Basic income provides an economic freedom, which—combined with political freedom, freedom of belief, and personal freedom—establish each individual's status as a free person.
Both sides, proponents and opponents, agree that an unconditional basic income implies a major alteration, if not completely new construction of the system of income distribution. The national accounts are only inadequately prepared to deal with the matter. They focus on production and circulation of commodities between industries and users, as exemplified in traditional input‐output tables. The microeconomic complement, household statistics of household income and expenditure are also insufficient as they ignore the sources and mutual transformation of one form of income into another within the economy, at large: Wages are paid to households, these pay taxes to government, form which salaries to other households are paid. These again pay interest to banks, which also pay salaries as well as taxes etc. Circulation not of products, but of incomes within a national economy is hardly reflected in ordinary national accounts, and even less in input‐output tables. The social accounting matrix, in contrast, is built expressly to serve that purpose. It forms the proper analytical and statistical tool employed in this paper. An estimated social accounting matrix for Germany is used to calculate the effect of different schemes of a basic income proposed on the economy as a whole, and its households, in particular. To give an example: assume you want to raise the income of all households disposing of less than 900 Euros per month above that level, the matrix reveals from which income generated this transfer is to be financed within the present distribution structure. In turn, although Portugal does not have a history identical to that of Germany with regards to the preparation of proposals for an unconditional basic income, identical effects are calculated, using a social accounting matrix, with an estimated disaggregation for low income households.
3. Macroeconomic analysis: the national distribution of income flows
Conventional income studies take households, or individuals, of a population as their object of investigation, collecting data about sources of their income, and the manner of spending it. They summarise their findings by way of a statistical measure of dispersion, usually the Gini‐index. The method corresponds to a microeconomic approach to economics. It is well known, however, that a microeconomic approach does not grasp the working mechanism of a full national economy where income of households and its expenditure are closely related to, and embedded in, a complex network of interrelated flows of value of different kinds, and among different institutions, and
income is distributed, circulating, and regathered in regular motion. A simple example may illustrate the matter. Goetz, W. and A. Goehler (2010) propose an unconditional basic income of 1000€/month be paid to every member of a nation. The existing present system of conditional social security transfers should abolished, at the same time, and the new unconditional basic income replacing it be financed by way of a value added tax. Table 4 suggests some simple figures for studying the proposal. It identifies three types of institutions. There are the corporations organising production, general government organising social order, and households organising individual people. Let these be distinguished in two groups (following table 4) called households A and households B. Rows of table 4 contain receivables, and columns the payables of a sector. Corporations receive operating surplus of 30 generated in production (see table 2), and in this simple example the surplus is not distributed but completely retained in the form of capital formation. Value added tax of 20 is levied by general government, 20 and 80 are earned by household groups A and B as employment compensation. Total value added generated, (and distributed in the form of these three components) is 170. There is one form of redistribution: Households B pay social security contributions of 10 to government, and government redistributes the amount as social benefit to households A. Table 4 Blackboard example of a matrix describing a national circuit of income distribution (billions of a national currency) Corpor‐ ations General Govern‐ ment House‐ holds A House‐ holds B Compens. of em‐ ployees Value added tax Opera‐ ting sur‐ plus Total reven‐ ues Corporations 30 (‐?) 30 General Government 10 (‐ 10) 20 (+ 10) 30 Households A 10 20 (‐?) 30 Households B 80 (‐?) 80 Disposable income 30 20 30 70 Total outlays 30 30 30 80
The Goetz‐Goehler proposal is indicated by figures in brackets. You cancel the expenditure of 10 by households B and increase value added tax by the same amount. The inevitable question is then: Does the increase in value added tax go at the expense of labour (employment income, 20 ‐?, 80 ‐ ?), or capital (operating surplus, 30 ‐?), or both, given that total value added does not change by the measure? You cannot plan a certain distribution of disposable income without answering the question as to its re‐partition at the stage of generation. Table 4 is not a full Social Accounting Matrix in the standard sense in which it is understood today (see Section 5), but an excerpt of its distributional part. It has been structured in the way of an input‐ output table. The II. Quadrant is assumed as being exogenous to the system. It represents final use of products, in input‐output analysis, while here under the purpose of income analysis, it represents generation of value added. The endogenous circulation of products (in input‐output analysis), or incomes (here), is captured by the I. quadrant. The III. Quadrant, finally, contains value added resulting from circulation of products, in input‐output analysis, and it exhibits disposable income resulting from circulation of property and transfer incomes here. We now apply the same formalism, which is used for analysing circulation of products to analysing circulation of incomes. Let Z
zijbe the matrix of primary and secondary incomes payed, and received by economic sectors (I. Quadrant), let V
vik be the matrix of income generated, in its different forms of value added (II. Quadrant), and let Y
yij be a matrix of disposable income, (III. Quadrant). The purpose of the following algebra is to define a fourth matrix Q
qik , which maps different forms of value added generated re)directly into sectors’ disposable income, (1) Q Y V Z M . The mapping is performed in the following way. Compile a matrix of distributional coefficients (2)
i ij ij s z a A where s
si represents the sum of a line i,(3)
k ik j ij i z v s s . Define a corresponding coefficient matrix of disposable income by (4)
j ij ij s y b B . In input‐output analysis equations 1 to 4 are interpreted as mapping final use of products into the matrix of value added components. They answer the question, for example, of how much value added is generated by the exports of an economy, or by its fixed capital formation. In a similar way, table 4 suggests a mapping of value added components into disposable income distributed, by defining a matrix Q in the following way:(5) Q = B (I‐A)‐1V
Appendix I shows the resulting matrix for Germany. We call it “incidence matrix”, because it expresses the amount of a specific value added component, generated in the economy, and falling into a particular sector’s disposable income (“incidence”). Matrix Q exhibits the amount of value added components contained in disposable income of each institutional sector or social stratum of households. 4. Approach applied to Germany A Social Accounting Matrix for Germany has been prepared, and published, by the Federal Statistical Office only once, for the year 2000; we take it as a point of departure. Yet, in order to derive a workable incidence matrix of income flows, it must be disaggregated in similar detail, as it is customary to do for input‐output tables when monitoring the flow of products through an economy. The table we have estimated is too large to be included in a paper. The income incidence matrix Q derived from it is exhibited in the appendix. Table 5 gives a summary. It shows income received by households before and after the distribution process, for each income stratum, separately. The lowest income group living with less than 900 Euros/month of net income receive 1.6 billion Euros from self‐employment before, and retain 1.4 billion after, the distribution process. They earn 1.1 bill. Euros/year as compensation of employment, themselves, and another 1.1 bill. Euros from wages of other households groups through redistribution, altogether 2.2 bill. Euro/year after
distribution. Hence, part of their disposable income originates in wages of other household groups. Their major source of income are the economic institutions. 3.5 billion Euros/year have been generated as value added tax, and last, but not least 4.8 billion Euros come out of corporations’ operating surplus, both of which households had no share in, before distribution, of course. The highest income layer of households (5000 – 18000 euro/month) earns 78.4 billion dollars, ‐ half of total self‐employment income ‐ before distribution, directly, loses part of it in the further distribution process (78.4 ‐64.3 = 14.1), and it also loses some wage income. 195.7 billion Euros, however, are acquired out of the operating surplus of companies. Half of total operating surplus goes to that group, an empirical support of the social structure designed in table 1. Secondary distribution has mollifies the initial cleavage, but primary distribution dominates. Table 5 Incidence of components of value added before and after distribution (bill. euro/year) Households with net income between …and… (euro/month) Income from self‐ employed Compensation of employees Value‐ added tax Operating surplus before after before after after after
0 ‐900 1.6 1.4 1.1 2.2 3.5 4.8 900 ‐ 1300 3.2 4.1 7.6 9.6 4.5 26.0 1300 – 1500 2.7 3.0 6.0 6.8 2.7 21.1 1500 – 2000 5.0 6.0 21.8 22.0 5.5 28.9 2000 – 2600efigur 9.4 10.0 31.4 30.4 6.6 43.7 2600 ‐ 3600 17.2 16.8 72.3 63.9 11.7 74.9 3600 – 5000 25.3 21.9 102.5 83.8 13.5 89.5 5000 ‐ 18000 78.4 64.3 76.5 68.4 21.5 195.7 Total 142.8 127.5 319.2 287.1 69.5 484.6 Source: Federal Statistical Office (2015) and own calculation The figures must not be read as an adequate description of the actual German economy, in this precision, the may serve, rather, as an illustration of what might occur in an economy constructed in similarity to it. The underlying social accounting matrix is a first estimate, no more. This is not the place to discuss the economic pros and cons of an unconditional basic income. We raise, and briefly answer, in a cursory way, some issues, as an illustration of how a social accounting
matrix, and the income incidence matrix derived from it, may be yield a truly macroeconomic analysis of the matter.
a) The yearly finance required for the envisaged unconditional income payments is estimated to lie between 306 (D. Althaus) and 731 (SPD county Rhein‐Erft) billion Euros (table 3). National income has been estimated 3184 billlion Euros in our SAM (Appendix I). The project touches on roughly ten percent of that sum, not an easy amount to re‐allocate. If it is decided, it cannot be introduced from one year to the next, probably, but only in a stepwise fashion over the span of a decade or more if it is to grow to that size.
b) The required finance must be raised by means of a tax, essentially, where all authors agree on a “flat” tax, levied on gross incomes with rates varying between 25 percent (Emmler/Poreski) and 62.5 percent (R. Carls). Income of government is not taxed, private income is the sum of employment compensation and operating surplus, namely 2850 billion Euros in our SAM. The government revenue gained from that tax lies between 710 and 1781 billion Euros. The first figure may be feasible, the second is rather unlikely to happen. c) Besides the mere size of the project there are questions about its institutional compatibility, with existing social security schemes, in particular. Present social security payments amount to 280 billion Euros. It is hardly conceivable that both schemes exist side by side. The question of how to integrate them must be answered, in the project. Our incidence matrix (appendix I) shows that reducing social security payments (as part of wages), and increasing value added tax instead, by 1 Euro would raise disposable income of general government by 57 cents, and lower income of the three richest groups of households by 47 cents. It is not certain a national parliament would vote for such a change. d) One of the side‐effects of an unconditional basic income, so it is feared, or hoped, is a lowering of wages paid by employers. The point can be studied by means of the incidence matrix shown in table 5. Lower wages mean higher profits. But higher profits in contrast mean higher taxes, so the effect may be mollified. An initial decrease of wages by 1 Euro will shrink to 89 cent (287.1/319.2) and so will the gain resulting in operating surplus when distribution and redistribution are taken into account.
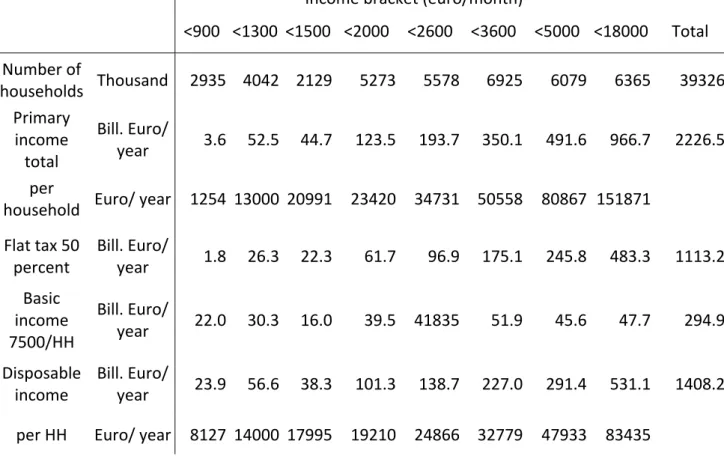
Table 6 shows a more elaborate experiment. It simulates the macroeconomic effect of introducing a flat tax of 50 percent on primary income combined with the payment of an unconditional basic income of 7500 Euros/household/year, in replacement of present social security schemes. The proposal is revolutionary in dealing with established institutions (“It does not help to stabilize the walls when the whole house is about to crumble,” Straubhaar 2018, p.7), but is it economically feasible? Households in the lowest income group have their income rise from 1254 to 8127 Euros/year, an almost 7‐fold increase. Households in the richest bracket, in contrast, see their income shrink from 151 thousand to 83 thousand Euros per year. The turning point from households receiving to households paying an income transfer is around 14000 Euros per year. The net amount retained by general government levying the tax is 1113 billion dollars of which it retains (1113 – 294 =) 819 billion Euros for its own purposes. The total amount of tax paid by households is 464 billion Euros in our social accounting matrix. That is far apart, but a tax of 483 billion dollars, which make up half of the total amount alone is unlikely to be paid by the top income group. Actually, the proposal is not 7500 Euros per household, but that amount per person. The number of persons is roughly twice the number of households in Germany. Basic income deducted would double, consequently, and the borderline between income receiving and income paying households would lie between2000 and 2600 Euros/month. Income of general government would shrink to about 500 billion Euros, which reflects the amount it receives, at present. In summary, after this brief and cursory analysis, the proposal seems to lie within the limits of the described economy. Other proposals may be tried, and compared the same way, once a reliable social accounting matrix is at hand.
Deciding on an unconditional basic income is a political rather than an economic matter, mainly, but it must be done with due regard to existing macroeconomic distribution structures. A social accounting matrix describing that structure can be of great use for exploring projects of basic income and carrying out thought experiments. Statistical offices ought to be encouraged to prepare them.
Table 6 Effect of a flat tax of 50 percent on primary income of households combined with an unconditional income of 7500 Euro/household/year Income bracket (euro/month) <900 <1300 <1500 <2000 <2600 <3600 <5000 <18000 Total Number of households Thousand 2935 4042 2129 5273 5578 6925 6079 6365 39326 Primary income total Bill. Euro/ year 3.6 52.5 44.7 123.5 193.7 350.1 491.6 966.7 2226.5 per household Euro/ year 1254 13000 20991 23420 34731 50558 80867 151871 Flat tax 50 percent Bill. Euro/ year 1.8 26.3 22.3 61.7 96.9 175.1 245.8 483.3 1113.2 Basic income 7500/HH Bill. Euro/ year 22.0 30.3 16.0 39.5 41835 51.9 45.6 47.7 294.9 Disposable income Bill. Euro/ year 23.9 56.6 38.3 101.3 138.7 227.0 291.4 531.1 1408.2 per HH Euro/ year 8127 14000 17995 19210 24866 32779 47933 83435 5. Approach applied to Portugal2 a) The SAM framework The SAM presented here is consistent with the rules and nomenclatures of the latest version of the SNA (ISWGNA, 2009). This is a version of the Author, which was a result of research supported mainly by R. Stone (namely, 1986, 1981, 1973), G. Pyatt (namely, 1991, 1991a, 1988), and G. Pyatt and J. Round (namely, 1985). Following the convention, our SAM is a square matrix, with equal row and column sums, in which, inflows are entries in rows, and outflows are entries in columns. Its adaptation to the SNA also allows 2 Part of this Section is also in Santos S. (2018) Using a Social Accounting Matrix for analysing institutions' income: A case from Portugal". In: Gokten, S. and Gokten, P. (eds) ‐ Sustainability Management in 21st Century, InTechOpen (open access book), London (UK). (forthcoming)
us to state that the former describe resources, incomes, receipts or changes in liabilities, and net worth; whereas the latter describe uses, expenditures, or changes in assets.
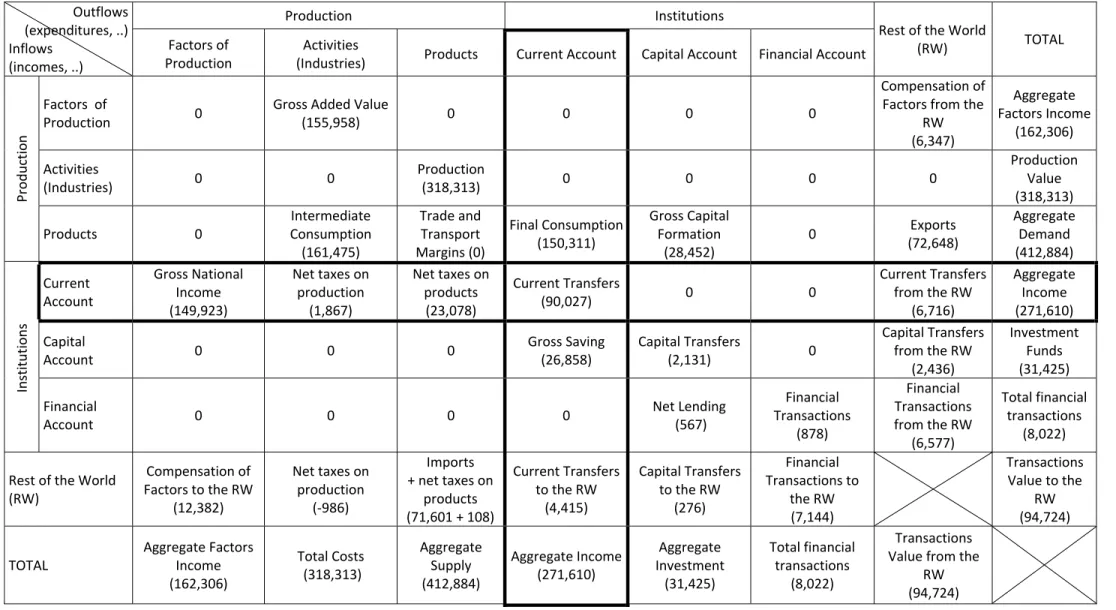
Table 7 represents a so‐called “macro SAM”, representing the highest aggregated level allowed by the national accounts, following a top‐down method. From that level, the accounts (rows‐columns) can be broken‐down into categories without losing the initial consistency. Numbers between brackets correspond to an application to Portugal in 2015, and can be used to illustrate how the activity of a country in a specific year is portrayed with this macro SAM. Therefore, with production and institutions’ accounts representing the (domestic) economy and the underlying transactions, an extended “circular flow of income” can be identified and specified. On the other hand, by means of the rest of the world account, the transactions between the (domestic) economy and that of abroad can be identified. Let us first take a snapshot of the activity of Portugal in 2015, as described below.
At the level of production accounts, the factors of production account shows the aggregate or primary income generated in 2015, which is also designated as compensation of the factors of production, namely of labour and capital, which was in the sum of 162,306 million Euros. Reading in rows, this amount was respectively composed of 155,958 and 6,347 million Euros, received from domestic activities and from the rest of the world. Reading in columns, this amount was composed of 149,923 and 12,382 million Euros, paid to domestic institutions and to the rest of the world, respectively.
In turn, continuing at the level of the production accounts, the activities account shows, respectively, the production value and the total costs associated with the process of production, which totalled 318,313 million Euros. In rows, this amount represents the output of goods and services. In columns, it is comprised of 155,958 million Euros of compensation of factors of production, 161,475 million Euros of intermediate consumption, 1,867 million Euros of net taxes on production received by the Portuguese Government, and – 986 million Euros of net taxes on production received by European Union institutions.
Finally, still at the level of the production accounts, the products account shows the main components of the aggregate demand and supply of the goods and services in the Portuguese economy in 2015, which amounted to 412,884 million Euros. Reading in rows, the aggregate demand was composed of 161,475 million Euros of intermediate consumption, 150,311 million
of exports. Reading in columns, the aggregate supply was composed of 318,313 million Euros of the output of goods and services, 23,078 million Euros of net taxes on products received by the Portuguese Government, ‐ 108 million Euros of net taxes on products received by the institutions of the European Union5, and 71,601 million Euros of imports – the last two being added in the same cell. The trade and transport margins also feature as a component in the products account, which amounts to zero at this level of disaggregation. At the level of the domestic institutions accounts, in the current account, the aggregate income of the Portuguese institutions in 2015 is shown, which amounted to 271,610 million Euros. The origin of this income is shown in rows, with the following composition: 149,923 million Euros of compensation of the factors of production received by domestic institutions; 1,867 and 23,078 million Euros of net taxes on production and net taxes on products, respectively ‐ both received by the Portuguese government, and; 90,027 and 6,716 million Euros of current transfers within domestic institutions and from the rest of the world, respectively. In turn, the destination or use of that same income is shown in columns, with the following composition: 150,311 million Euros of final consumption; 90,027 and 4, 415 million Euros of current transfers within domestic institutions and to the rest of the world, respectively, and; 26,858 million Euros of gross savings.
The capital account, apart from showing the net lending (or borrowing) of institutions, also shows information regarding acquisitions less disposals of non‐financial assets (or the various types of investment in non‐financial assets) and capital transfers, which amounted to 31,425 million Euros. Reading in rows, this amount represents investment funds, and was composed of: 26,858 million Euros of gross savings, and; 2,131 and 2,436 million Euros of capital transfers within domestic institutions and from the rest of the world, respectively. Reading in columns, this amount represents aggregate investment and was composed of: 28,452 million Euros of gross capital formation; 2,131 and 276 million Euros of capital transfers within domestic institutions and to the rest of the world, respectively, and 567 million Euros of net lending.
The financial account represents the net flows associated with the acquisition of financial assets and the incurrence of liabilities, underlying which is the above‐mentioned net lending. These flows amounted to 8,022 million Euros. Reading in rows, this amount is composed of 567 million Euros of net lending, 878 million Euros of net financial transactions within domestic institutions, and 6,577 million Euros of net financial transactions from the rest of the world. Reading in columns, besides
the net financial transactions between domestic institutions (878 million Euros), this amount also includes 7,144 million Euros of net financial transactions to the rest of the world. The rest of the world account shows all the transactions between resident and non‐resident actors in the accounts described above (production and domestic institutions), or between the Portuguese economy and the rest of the world in 2015, which amounted to 94,724 million Euros. Thus, the row represents the flows to the rest of the world, with the following composition: 12,382 million Euros of compensation of factors of production, – 986 million Euros of net taxes on production (taxes received minus subsidies paid by European Union institutions), 71,493 million Euros of imports (71,691 million Euros), to which is added net taxes on products (‐ 108 million Euros, of taxes received, minus subsidies paid by European Union institutions), 4,415 million Euros of current transfers, 276 million Euros of capital transfers, and 7,144 million Euros of financial transactions. In turn, the columns show the decomposition of the flows from the rest of the world, as follows: 6,347 million Euros of compensation of factors of production; 72,648 million Euros of exports; 6,716 million Euros of current transfers; 2,436 million Euros of capital transfers, and; 6,577 million Euros of net financial transactions.
Therefore, as can be checked in the structure of an integrated economic accounts table of the national accounts3, practically all the flows measured by the latter are covered by the SAM – the
grand totals in the above‐presented macro SAM; other levels of disaggregation in SAMs constructed for specific studies, always respecting those grand totals.
Table 7. A macro SAM of Portugal in 2015 (in millions Euros). Outflows (expenditures, ..) Inflows (incomes, ..) Production Institutions Rest of the World (RW) TOTAL Factors of Production Activities
(Industries) Products Current Account Capital Account Financial Account
Productio n Factors of Production 0 Gross Added Value (155,958) 0 0 0 0 Compensation of Factors from the RW (6,347) Aggregate Factors Income (162,306) Activities (Industries) 0 0 Production (318,313) 0 0 0 0 Production Value (318,313) Products 0 Intermediate Consumption (161,475) Trade and Transport Margins (0) Final Consumption (150,311) Gross Capital Formation (28,452) 0 Exports (72,648) Aggregate Demand (412,884) Institutions Current Account Gross National Income (149,923) Net taxes on production (1,867) Net taxes on products (23,078) Current Transfers (90,027) 0 0 Current Transfers from the RW (6,716) Aggregate Income (271,610) Capital Account 0 0 0 Gross Saving (26,858) Capital Transfers (2,131) 0 Capital Transfers from the RW (2,436) Investment Funds (31,425) Financial Account 0 0 0 0 Net Lending (567) Financial Transactions (878) Financial Transactions from the RW (6,577) Total financial transactions (8,022) Rest of the World (RW) Compensation of Factors to the RW (12,382) Net taxes on production (‐986) Imports + net taxes on products (71,601 + 108) Current Transfers to the RW (4,415) Capital Transfers to the RW (276) Financial Transactions to the RW (7,144) Transactions Value to the RW (94,724) TOTAL Aggregate Factors Income (162,306) Total Costs (318,313) Aggregate Supply (412,884) Aggregate Income (271,610) Aggregate Investment (31,425) Total financial transactions (8,022) Transactions Value from the RW (94,724) Sources: Statistics Portugal (INE); Portuguese Central Bank (Banco de Portugal) [own calculations, from: Appendix II]
On the other hand, as practically all the flows observed and measured by the National Accounts are included in this version of the SAM, it is possible to calculate and/or extract from it the main macroeconomic aggregates that are usually considered. The following description is based on Table 7. Gross Domestic Product (GDP) can be calculated using the three known approaches: the production approach ‐ in which intermediate consumption (161,475) is subtracted from production, or from the output of goods and services (318,313), adding the net taxes on products (23,078 ‐ 108); the expenditure approach ‐ in which final consumption (150,311), gross capital formation (28,452), and net exports (72,648 – 71,601) are added; and the income approach ‐ in which net taxes on production and imports (23,078 ‐ 108 + 1,867 ‐ 986) are added to the gross added value (155,958). The Portuguese GDP in 2015 was 179,809 million. GDP is the income generated in the domestic economy by residents and non‐residents, added to the total net taxes on production and imports, to be valued at market prices. Gross Domestic Product can be converted into Gross National Product or Income (GNI), by adding the compensation of factors of production (labour and capital) received from the rest of the world (6,347), and by deducting the compensation of factors of production (labour and capital) and net taxes on production and imports sent to the rest of the world (12,382 – 986 ‐ 108). GNI can also be calculated directly from the SAM by adding the compensation of factors received by domestic institutions to the net taxes on production and on products received by domestic institutions (149,923 + 1,867 + 23,078). The corresponding amount for Portugal in 2015 was 174,868 million Euros. GNI is the income generated in the domestic economy and in the rest of the world by residents, added to the part received by the general government of net taxes on production and imports, to be valued at market prices. Disposable Income (DI) can be calculated by adding the net current transfers received by domestic institutions (6,716 ‐ 4,415) to GNI. In our application for Portugal, this was 177,168 million Euros. Gross Saving and Net Lending or Net Borrowing are usually presented with the above macroeconomic aggregates, which are items that are provided directly by the SAM and, in the case of Portugal in 2015, were 26 858 and 567 million Euros, respectively, with the last being Net Lending. Representing the capital and financial accounts the investment in non‐financial and financial assets,
going to be on the current or aggregate income of institutions. Thus, let us focus our attention on the current account of institutional sectors, highlighted with a thicker borders in Table 7.
b) The origin and the use of institutions’ aggregate income
From the reading of the macro SAM presented above, is possible to see that the results of the study of the institutions’ income, in general, and of the effects of a social policy measure that affects
households’ income – such as the introduction of an unconditional basic income, which, in
particular, involves the current or aggregate institutions’ income, which assumes the disaggregation of the institutions’ current account. On the other hand, as illustrated in Table 7, because the main source of the institutions’ aggregate income is GNI, that is to say, the compensation of factors of production received by residents or the income generated by them in the (domestic) economy and abroad, the factors of production account should also have some disaggregation.
According to the SNA nomenclatures and the available information provided by the national accounts, the disaggregation of the factors of production account are going to be divided into ‘labour’ and ‘others’ (factors of production), with the former (labour) including the compensation of employees, and the latter (others) including the compensation of employers and own‐account (or self‐employed) workers, as well as the compensation of capital, namely property income. In turn, although five main institutional sectors can be identified in the institutions’ current account,
considering the purpose of the research is to study the effects of the introduction of an
unconditional basic income, this disaggregation is going to be divided into: ‘households’ ‐ “all
physical person in the economy”, distinguishing ‘low income households’4, from ‘other households’;
‘(general) government’ ‐ with the political responsibility of redistributing income, and; ‘others’ ‐ the non‐financial and financial corporations and non‐profit institutions serving households.
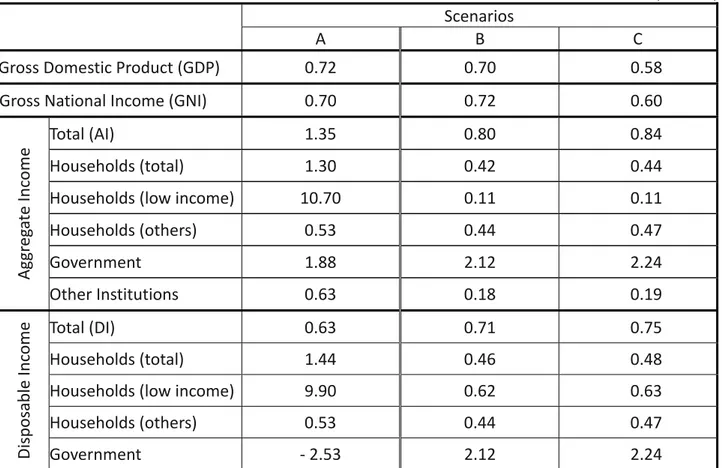
Following the application to Portugal, Tables 8 and 9 represent the result of this disaggregation regarding, respectively, the origin (rows) and use (columns) of the aggregate income, which can be found in the totals of these tables – the amounts between brackets in the cells of the row and the
4 This disaggregation is an estimate, calculated from the Household Budget Survey ‐ 2015/16, published by Statistics Portugal. In this estimate the total income and expenditure of that Survey was adapted to the universe of the National Accounts and the ‘low income households’ were identified as being those with an income lower that the national minimum wage. The following assumptions were also adopted: the total expenditure is equal to the total disposable income and, therefore, there is no gross saving; there are no current transfers from, and to, the rest of the world; the