Católica Lisbon School of Business and Economics
Columbia Sportswear Company
Equity Valuation
Afonso Manuel Vasconcelos de Brito Elvas, 152113194
Advisor: Professor José Carlos Tudela Martins
Dissertation submitted in partial fulfilment of requirements for the degree of Master of Science in Business Administration, at the Universidade Católica Portuguesa, June 2015
Columbia Sportswear Co. (COLM
)
BUY
Positive Trend is to continue
Columbia Sportswear Company
Columbia is a global company operating in the apparel and footwear industry. The firm targets 5 primary outdoor brands, being the most important the one that gives the name to the group. As it was founded in the U.S., this is the most important region for the group’s revenues. Nonetheless, the brands are available through several distribution channels and in nearly 100 countries. Key Data Market Cap ($ mn) 3.110,14 Shares Outstanding (mn) 69,83 Current Price ($) 44,54 Price Target ($) (DCF) 62,21
Implicit Price Variation 39,67%
Investment Case
The 2014 results were remarkable, as revenue increased by 24,66% in comparison with the previous year 2013. The China Joint venture that has started operating in January of 2014 was the main responsible for that boom. Besides, the PrAna acquisition, and the growing in Direct to consumer sales, which enables greater margins were also relevant factors for the 2014 bright results.
The increase in the direct to consumer segment is expected to maintain over the next years. This is especially true for sales through E-Commerce that have been gaining a more relevant size and that trend is to continue.
The ERP (Enterprise Resource Planning) system, which has started in Canada during 2012 and extended to the US market this last year, was responsible for the growth in Gross Margins by diminishing the operating costs. In 2015 and 2016, LAAP and EMEA will be the next segments to be covered by the software. Given this, I expect the expenses (as percentage of sales) to continue declining until 2019.
The integration of PrAna, following the acquisition, within the company will enable it to take advantage of the already accomplished Columbia’s distribution channel. I believe that this will positively affect that brand’s sales.
The already seen improvement in the European macro environment, where population have a great buying power and is willing to acquire outdoor products is forecasted to increase revenue in the next few years.
Research Analyst Afonso Elvas
(+351) 914 667 090 afonsoelvas@gmail.com
Last year COLM’s price performance
30 32 34 36 38 40 42 44 46 48 50 D ec /1 3 Ja n /1 4 Feb /1 4 M ar /1 4 A p r/ 1 4 M ay /1 4 Ju n /1 4 Ju l/ 1 4 A u g/ 1 4 Sep /1 4 O ct /1 4 N o v/ 1 4 D ec /1 4 83,32% 7,91% 5,70% 0,50% 2,56%
Columbia Sportswear Brand Sales 2014
Columbia Sorel Mountain Hardwear Other prAna
investment case are discriminated in the following page. Next, a relative valuation, through the EV/EBITDA multiple is also presented but one should notice that the DCF is the main model.
Target Price and Risks
To value Columbia Sportswear Co. I used the FCFF method. The key inputs to the valuation model were a WACC of 7,87% and a perpetuity growth of 2%.
From the DCF model, an implicit price of $ 61,21 was reached. The target price and the variation in comparison with the current stock value, as of 31 December 2014, made me released a Strong Buy Investment Recommendation
Upside Risks:
- Expand the Direct to consumer to other geographies (since it is much more present in U.S. and Canada) - Mitigate the dependence on sales seasonality by
continuously increasing the proportion of other product’s varieties on the company’s sales.
- Penetrate Tier 3 and Tier 4 cities in China, which are until date dominated by local players.
- Possible trend of outdoor clothes becoming fashion and people start using it on a daily basis.
Downside Risks:
- Efficiencies’ programs with lower than expected results. - European macroeconomic environment to continue
weakening.
- Latin American macroeconomic and politic environment to continue deteriorating
- Warm winters that would negatively impact the company’s sales.
- Later Wholesalers’ Orders affecting Columbia’s demanding planning and subsequently sales and gross profit. WACC 7,87% PV FCFF 1606,1 TV (g=2%) 5195,7 PV (TV) 2258,1 EV 3864,2 - Net Debt -421,6 - Minority Interest Subsidiaries 11,6
Equity 4274,2 Shares Outstanding 69,8 Share Price 61,21 0 500 1000 1500 2000 2500 2010 2011 2012 2013 2014 (US$ millions)
Geographic Segment Net Sales
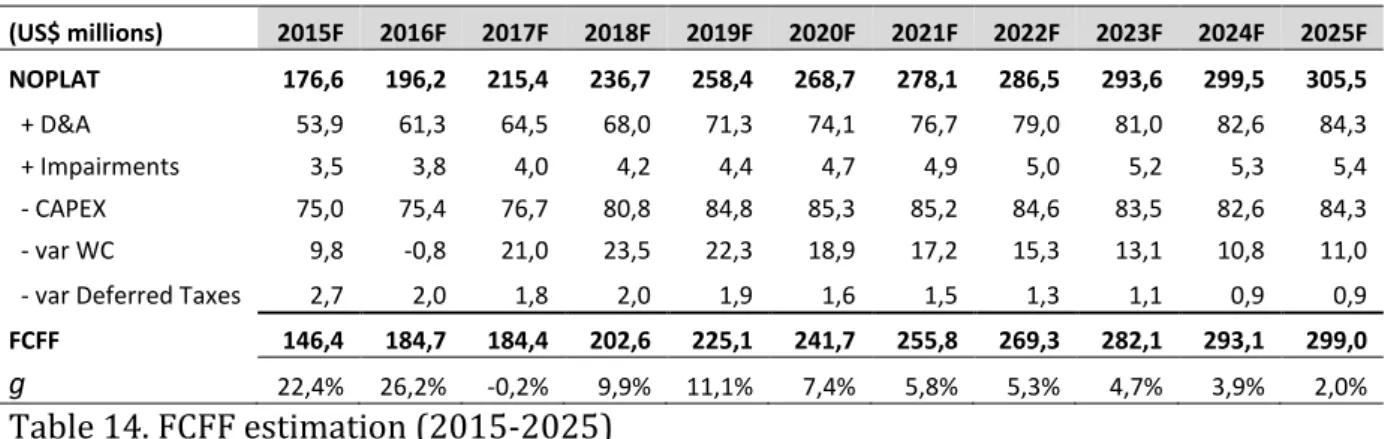
(US$ millions) 2015F 2016F 2017F 2018F 2019F 2020F 2021F 2022F 2023F 2024F 2025F Net Sales 2289,6 2431,5 2556,1 2695,0 2826,9 2940,0 3042,9 3134,2 3212,6 3276,8 3342,4 Cost of sales 1236,4 1300,9 1354,7 1414,9 1470,0 1528,8 1582,3 1629,8 1670,5 1703,9 1738,0 Gross Profit 1053,2 1130,6 1201,4 1280,1 1356,9 1411,2 1460,6 1504,4 1542,0 1572,9 1604,3 D&A 57,7 61,3 64,5 68,0 71,3 74,1 76,7 79,0 81,0 82,6 84,3 Impairment PPE 3,5 3,8 4,0 4,2 4,4 4,7 4,9 5,0 5,2 5,3 5,4 Net S,G&A 755,5 802,3 843,4 889,3 932,8 970,1 1004,1 1034,2 1060,1 1081,3 1102,9 Net Licensing Income (7,58) (8,05) (8,46) (8,92) (9,36) (9,74) (10,08) (10,38) (10,64) (10,85) (11,07)
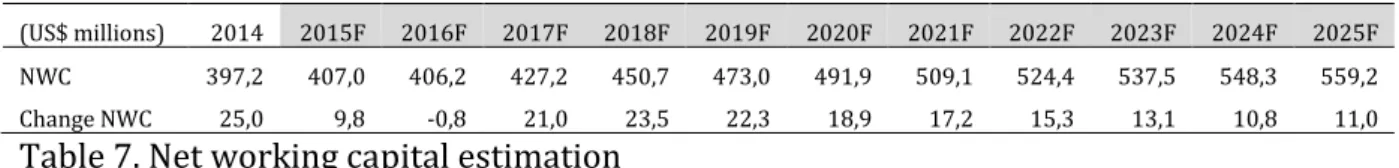
Operating Income 247,6 275,1 301,9 331,8 362,2 376,7 389,9 401,6 411,6 419,8 428,2 Tax 28,66% 28,66% 28,66% 28,66% 28,66% 28,66% 28,66% 28,66% 28,66% 28,66% 28,66% NOPLAT 176,6 196,2 215,4 236,7 258,4 268,7 278,1 286,5 293,6 299,5 305,5 + D&A 53,9 61,3 64,5 68,0 71,3 74,1 76,7 79,0 81,0 82,6 84,3 + Impairments 3,5 3,8 4,0 4,2 4,4 4,7 4,9 5,0 5,2 5,3 5,4 - CAPEX 75,0 75,4 76,7 80,8 84,8 85,3 85,2 84,6 83,5 82,6 84,3 - var WC 9,8 -0,8 21,0 23,5 22,3 18,9 17,2 15,3 13,1 10,8 11,0 - var Deferred Taxes 2,7 2,0 1,8 2,0 1,9 1,6 1,5 1,3 1,1 0,9 0,9
FCFF 146,4 184,7 184,4 202,6 225,1 241,7 255,8 269,3 282,1 293,1 299,0
Discount FCFF 137,0 161,6 150,9 155,1 161,2 161,9 160,2 157,8 154,6 150,3 143,4
Multiples Valuation:
For the multiples valuation I consider the EV/EBITDA ratio, both for 2014 and 2015. The comparable companies’ ratios and the Target share prices using the multiples are presented next.
Peer Group EV/EBITDA
2014 2015F VF CORP 15,83 13,01 WOLVERINE WORLD WIDE
INC 11,18 11,11
ASICS CORP 11,57 14,98 PUMA SE 12,20 9,18 DECKERS OUTDOOR CORP 8,18 6,79 ADIDAS AG 7,97 9,95 UNDER ARMOUR INC-CLASS A 33,37 26,10 HANESBRANDS INC 14,89 14,00
Average 14,40 13,14
COLUMBIA SPORTSWEAR 10,52 11,54
EV to EBITDA (2014) 14,40x EV to EBITDA (2015) 13,14x
EBITDA (US$ million) 8252,86 EBITDA (US$ million) 281,07
Enterprise Value 3640,4 Enterprise Value 3693,3
- Adjustments (413,47) - Adjustments (413,47)
Equity 4053,9 Equity 4106,7
Shares Outstanding 69,83 Shares Outstanding 69,83
The aim of this Thesis is to evaluate Columbia Sportswear Company’s stock at 31 December 2014. In this way, to apply the most adjustable methodology I carry out a research among consensual valuation models. I conclude for company’s case DCF-WACC and Relative Valuation are the appropriate ones. Over the recent years, it is seen that company’s positive performance in global outdoor market increased market share. Being future perspectives optimistic resulting in a price target of US$ 61,21. Difference between market price, US$ 44,54, and price target led me to recommend a Buy position for Columbia Sportswear’s stock. A sensitivity analysis for the most critical variables was done and I note that WACC and perpetuity growth variations highly affect DCF-WACC model output. Regarding, comparison with Goldman Sachs we achieved similar investment recommendation.
This thesis means more than knowledge and research. It is the end of a long cycle where I just can remember positive experiences. Given this I would like to acknowledge to some people.
Firstly, I would like to express my gratitude to my advisor, Professor José Carlos Tudela Martins, for all availability, guidance and review during thesis. I am thankful for the support, loyalty and motivation given by my mates: Henrique, “Manolo” and Rui. I also want to acknowledge Ron Pharm, director of investor relations department, for all availability, support and shared information.
At last, this thesis is for my family, girlfriend and friends, whose support was always unconditional.
TABLE OF CONTENTS
1 Introduction ... 10
2 Literature Review ... 11
2.1 Introduction – Valuation Importance ... 11
2.2 Valuation Methods ... 12
2.2.1 Relative Valuation ... 12
2.2.2 Discounted Cash Flow ... 14
2.2.3 Excess Return Models – Economic Value Added ... 18
2.2.4 Contingent Claim Valuation... 19
2.2.5 Further Components in DCF Valuation ... 20
2.3 Conclusion ... 24
3 Industry Analysis ... 25
3.1 Industry Overview ... 25
3.2 Weather Seasonality ... 25
3.3 Consumer Spend Patterns and Innovation ... 25
3.4 Industry General Framework ... 26
3.5 Market Structure ... 27
4 Company Analysis... 29
4.1 Company Overview ... 29
4.2 Trademarks ... 29
4.3 Distribution Channels and Product Manufacturing ... 30
4.4 Geographic Mix ... 30
4.5 Company’s Strategic Growth ... 32
5 Financial Statements Reorganization and Valuation Estimates ... 33
5.1.1 Reorganizing Income Statement ... 33
5.1.2 Reorganizing Balance Sheet ... 33
5.2 DCF Estimation ... 33
5.2.1 Net Sales ... 33
5.2.2 Cost of Sales ... 36
5.2.4 Depreciation and Amortization ... 37
5.2.5 Net Licensing Income ... 37
5.2.6 Impairments of Property Plant and Equipment ... 38
5.2.7 Tax Rate ... 38
5.2.8 Capital Expenditures ... 38
5.2.9 Net Working Capital ... 39
5.2.10 Net Taxes ... 40
5.3 Income Statement Estimation ... 40
5.3.1 Stock Based Compensation ... 40
5.3.2 Interest Income and Expense ... 40
5.3.3 Non Controlling Interest ... 41
5.4 Balance Sheet Estimation ... 41
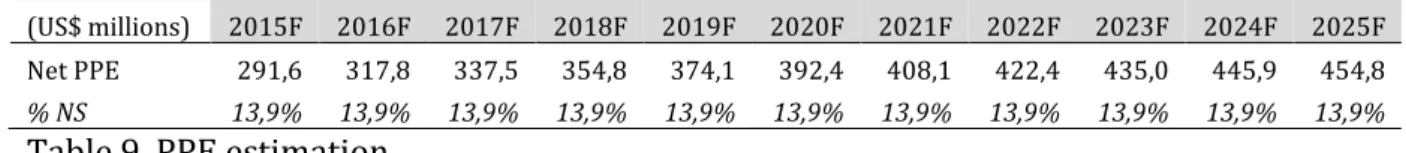
5.4.1 Property, Plant and Equipment ... 41
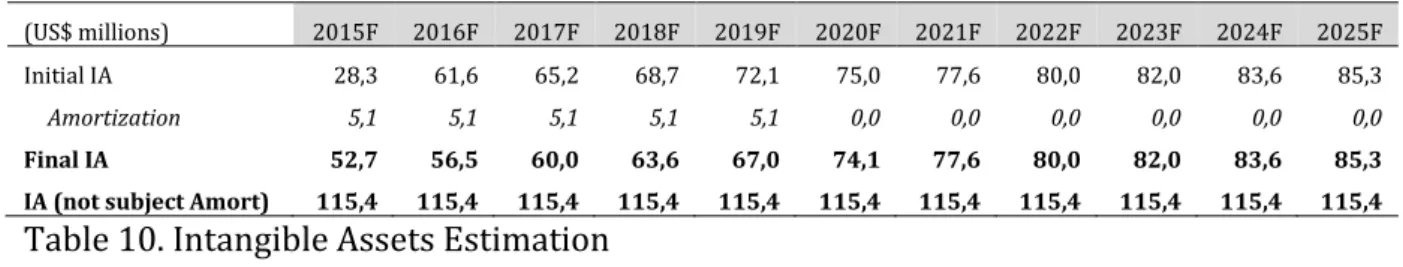
5.4.2 Intangible Assets ... 41
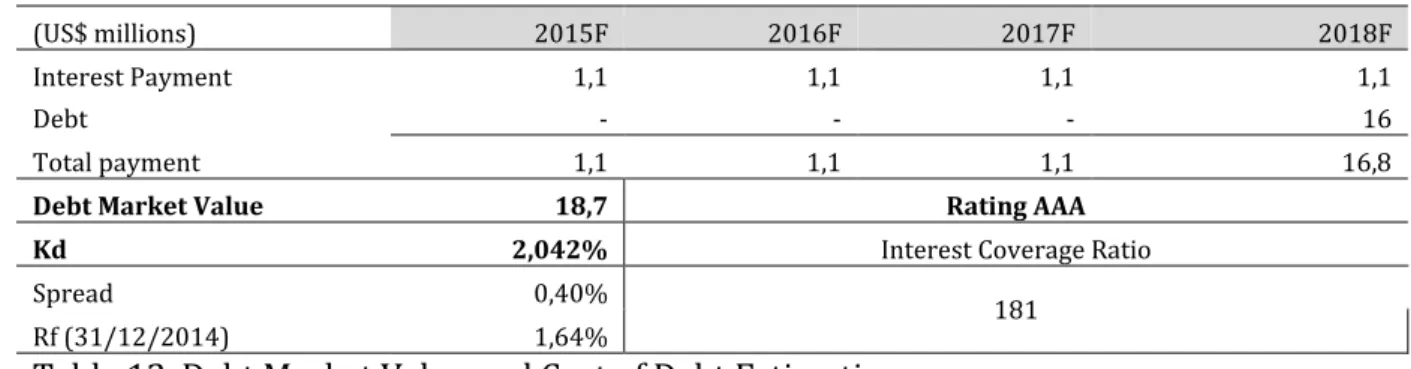
5.4.3 Long-Term Debt ... 42
5.4.4 Retained Earnings ... 42
6 Valuation ... 43
6.1 Discounted Cash Flow ... 43
6.1.1 WACC ... 43
6.1.2 Free Cash Flow Firm ... 45
6.1.3 Present Value, Terminal Value and Adjustment ... 45
6.2 Multiples Valuation ... 46
6.2.1 Peer Group ... 46
6.2.2 Multiples Application ... 47
6.3 Valuation Final Conclusions ... 48
7 Sensitivity Analysis ... 49
8 Comparison Investment Bank Report ... 50
9 Conclusion ... 52
Appendices ... 53
Appendix A: Multiples ... 53
Appendix C: Outdoor Companies Sales Seasonality ... 55
Appendix D: Macroeconomic Advise ... 56
Appendix E: Turbodown and ThermoBall Technology ... 57
Appendix F: ATP Index and Columbia Co. monthly growth rate ... 58
Appendix G: Outdoor participation United States ... 58
Appendix H: European Outdoor Market Sales ... 59
Appendix I: Chinese Apparel Players Battle for Market Position Across Cities ... 59
Appendix J: Columbia History Contextualization ... 60
Appendix K: Columbia Sportswear Brand Sales ... 60
Appendix L: Product Category Net Sales... 61
Appendix M: Columbia Sportswear Net Sales ... 61
Appendix N: Income Statement Estimation ... 62
Appendix O: Balance Sheet Estimation ... 63
Appendix P: Net Sales Estimation and Growth Rates ... 64
Appendix Q: Historical Cost of Sales margin (2008-2014) ... 64
Appendix R: Historical SGA Expenses margin (2008-2014) ... 65
Appendix S: Net Licensing Income Estimation ... 65
Appendix T: Net Working Capital Estimation ... 66
Appendix U: Net Taxes Estimation ... 67
Appendix V: Property, Plant and Equipment Estimation ... 67
Appendix W: Columbia Sportswear Capital Structure (2000-2014) ... 68
Appendix X: Discounted Cash Flow Estimation ... 69
1 Introduction
This Dissertation aims applying and developing theoretical Equity Valuation knowledge. Regarding this, I will evaluate Columbia Sportswear Company’s stock at 31th December 2014. All research done in the next chapters will determine whether stock price is undervalued, overvalued or at the price. At the end, an investment recommendation would be given.
First, I will present the most relevant literature and methodology on Equity Valuation. The main goal of this chapter is to define which kind of models is adjusted for Columbia Sportswear characteristics.
Secondly, I will perform an Industry and Company overview to study both perspectives macro and microenvironment. Therefore, before performing the valuation is essential to have deep knowledge about market characteristics, trends and company’s position.
Third, I present the estimation and valuation chapters. In first part, it is going to be incurred forecasting for all relevant items for valuation purposes. Afterwards I will apply valuation models selected in the literature review.
At last, a Sensitive Analysis will be performed to test variables impact in the main model. Following, a comparison between my valuation and an equity research report from an investment bank.
2 Literature Review
2.1 Introduction – Valuation Importance
Valuation of firms is an exciting topic. It is attractive for all agents that are connected to finance world as investors, managers, regulators and researchers, who are regularly confronted with the question “What is the value of a particular firm?” (Kruschwitz and Löffler, 2006). There is not a right answer, the value of the firm may vary due to a multitude reasons. (Fernandez, 2007).
Therefore, Valuation is the art of estimating the future economic benefits that a certain investment can provide. Valuation follows a process, according to Stowe et al (2007), which includes understanding the company to be valued, forecasting the company’s performance, and selecting the appropriate valuation model. It plays a big role in Corporate World, especially during mergers and acquisitions.
According to Fernandez (2007), valuation has a wide sort of purposes:
In company buying and selling: set a maximum price for buyer and minimum price for seller
Valuation of listed companies: set a target price for shares and take a decision between sell, buy or hold
Public offerings: justify the price of the offered shares
Inheritances and Wills: compare share’s value with that of the other asset
Compensation schemes based on value creation: measure managers value creation
Identification of value drivers: identification and rank the factors that affect company value
Strategic decisions on the company’s continued existence: decisions for the future of the company continue in the business, sell, merge, milk, grow or buy other companies
Strategic planning: measure the impact of company’s possible policies and strategies
shareholders are more demanding and managers need to react, in sense, to maximize shareholders wealth and the value of the firm. Currently, managers need to be aware of valuation methods, in order to be able to maximize investors’ wealth and to determine the value of the company.
2.2 Valuation Methods
In order, to determine the value of the firm analysts use a wide range of methods. Selecting, applying and interpreting the most accurate is important in investment analysis and valuation (Stowe et al, 2007). In line with Professor Damodaran (2007), there are four approaches for valuation: relative, discounted cash flow, liquidation and accounting, and contingent claim valuation. In the same way, Fernandez (2007) classifies valuation methods with six groups named in a different manner.
Firstly, Relative Valuation, a ratio that expresses the value of the company in relation to a certain variable, is used to compare with a group of companies or industry average. In a simple way, we look at the market value of a similar asset to realize the value an asset (Damodaran, 2007).
Secondly, Discounted Cash Flow valuation, as the name indicates, is based on future cash flows to figure out firm value. These cash flows are discounted back to today using the appropriate cost of capital (Frykman and Tolleryd, 2003).
Liquidation and Accounting valuation, third approach, “valuing the existing assets of a firm with accounting estimates or book value often used as a starting point”, (Damodaran, 2007).
Finally, Contingent Claim valuation uses option-pricing models to measure the value of the company, for instance Black Scholes model. The method is indicated for industries where the investment is intensive and there is a high degree of uncertainty (Frykman and Tolleryd, 2003).
2.2.1 Relative Valuation
In relative valuation, as the name suggests, asset is valued according to the value of similar assets in the market. Comparison is done through multiples, ratios that express
firm value in relation to a specific variable such as revenues, earnings, or book value. Multiples are efficient, in the way, are easy to compute, and a great complementary approach of a complex model for instance DCF.
Thus, multiples are divided in two basics groups: enterprise and equity multiples. Enterprise multiples express the value of the entire enterprise, typical examples are EV/EBITDA and EV/SALES. Equity multiples express the value of the shareholders’ claims, commonly identified with p of price, or market capitalization, most traditional equity multiple is Price/Earnings.
Multiples can be very useful to value a firm due to the simplistic way that they can be estimated. However, we must have in mind certain precautions, as choosing the appropriate multiple and compute it correctly. Following Frykman and Tolleryd (2003), in order, to calculate a relative multiple are required several steps: first identification of an appropriate variable for valuing the company, second select comparable companies, third adjust for differences between companies, fourth calculate multiple of the peer group and finally apply it to a chosen company to estimate enterprise value/equity.
In relation to which kind of multiples should be used it is proved empirically by Liu et al (2001), whenever is possible it is preferred to apply forward-multiples instead of historical multiples. Multiples are more accurate when are based in forecasts than in historical data. In accordance with Koller et al (2005), enterprise multiples are the most reliable and less susceptible to manipulation. The famous price to earnings is a criticism target of several researchers, in the way, it is vulnerable to different capital structures, tends to be higher on unlevered firms, and in addition is based on earnings, which don’t take into account non-operating items. An alternative to PER, is EV/EBITDA which isn’t affected by changes in capital structure and, “depends on ROIC and growth”.
Choosing a proper peer group is a challenging task, which distinguishes high-level analysts from common ones. Being in the same industry it is not sufficient there are companies in the same industry completely different in terms of growth, capital structure and risk. Koller et al (2005), suggests comparable companies with similar prospects of return on invested capital and growth rate. Damodaran (2007), has an
identical view about the comparable firms, mentions that peer group members should be similar to the valued firm in terms of cash flows, growth potential and risk.
In order, to reach accurate valuation results with multiples sometimes adjustments are needed. As Frykman and Tolleryd (2003) defend, “truly diligent investor will be sure to adjust the multiple for all possible value-affecting differences between the companies”. Regarding EV to EBITA should be adjusted for non-operating items an example is excess cash, since interest is excluded from EBITA cash should be excluded from enterprise value. In Appendix A are presented sales and book value multiples.
2.2.2 Discounted Cash Flow
“We buy most assets because we expect them to generate cash flows for us in the future”, Damodaran (2007)
The most commonly used stand-alone valuation model is the discounted cash flow model (Frykman and Tolleryd, 2003). It is consider an absolute model that specifies an asset’s intrinsic value. According to Damodaran (2007) and Fernandez (2007), DCF model determines the company value by estimating future cash flows and discount them at a certain rate that reflects their riskiness. The discount rate shall assume a higher value when evaluating risky assets and lower value in the opposite case. Thus, cash flow prediction should be done carefully for each period, since it affects directly asset valuation. Considering Fernandez (2007), the general method for cash flow discounting is given by the following expression:
V = 𝐶𝐹1 1 + 𝑘+ 𝐶𝐹2 (1 + 𝑘)2+ 𝐶𝐹3 (1 + 𝑘)3… 𝐶𝐹𝑛+ 𝑉𝑅𝑛 (1 + 𝑘)𝑛 (1)
Where: 𝐶𝐹𝑖 = cash flow generated by the company in the period i.
𝑉𝑛 = residual value of the company in the year n. k = appropriate discount rate for the cash flows’ risk.
𝑔 = constant growth rate after year n.
The DCF model can be computed through several different approaches. Following Stowe et al (2007), based on cash flow three different returns can be considered:
Dividends (Dividend Discount Model) Free Cash Flow (FCFEquity and FCFFirm) Residual Income
There is a fourth approach regarding DCF, it is Adjusted Present Value (APV) that is useful to value business operations, mainly when there are changes in capital structure. The aim of APV is to value, separately, the effects of debt. Luehrman (1997) defends, “APV is exceptionally transparent: you get to see all the components of value in the analysis”.
Concerning, the DCF approaches presented above, this thesis is going to approach: Dividend Discount Model, Free Cash Flow to the Equity, Free Cash Flow to the Firm and Adjusted Present Value. Dividend Discount model is discussed on Appendix B.
Free Cash Flow to Equity (FCFE) Valuation
Free cash flow to the Equity approach values directly company’s equity, as the Dividend Discount Model. According to Damodaran (2007), “one way to describe a free cash flow to equity model is that it represents a model where we discount potential dividends rather than actual dividends”.
𝐸𝑞𝑢𝑖𝑡𝑦 = ∑ 𝐹𝐶𝐹𝐸𝑡 (1 + 𝑘𝑒)𝑡 𝑡=∞ 𝑡=1 (2) Where, 𝐹𝐶𝐹𝐸𝑡 = 𝐹𝑟𝑒𝑒 𝐶𝑎𝑠ℎ 𝐹𝑙𝑜𝑤 𝑡𝑜 𝑒𝑞𝑢𝑖𝑡𝑦 𝑖𝑛 𝑦𝑒𝑎𝑟 𝑡 𝑘𝑒 = 𝑐𝑜𝑠𝑡 𝑜𝑓 𝑒𝑞𝑢𝑖𝑡𝑦
Thus to compute shareholder’s equity the free cash flow to equity is discounted at the cost of equity (𝑘𝑒), which represents the inherent risk of dividends. For Stowe et al (2007), FCFE “is the cash flow available to the company’s common equity holders after all operating expenses, interest, and principal payments have been paid and necessary investments in working and fixed capital have been made”. The formula is given by:
𝐹𝐶𝐹𝐸 = 𝑁𝑒𝑡 𝐼𝑛𝑐𝑜𝑚𝑒 − 𝐶𝑎𝑝𝑖𝑡𝑎𝑙 𝐸𝑥𝑝𝑒𝑛𝑑𝑖𝑡𝑢𝑟𝑒𝑠 + 𝐷𝑒𝑝𝑟𝑒𝑐𝑖𝑎𝑡𝑖𝑜𝑛𝑠 − 𝐶ℎ𝑎𝑛𝑔𝑒 𝑖𝑛 𝑛𝑜𝑛 𝑐𝑎𝑠ℎ 𝑤𝑜𝑟𝑘𝑖𝑛𝑔 𝑐𝑎𝑝𝑖𝑡𝑎𝑙 − (𝐷𝑒𝑏𝑡 𝑟𝑒𝑝𝑎𝑦𝑚𝑒𝑛𝑡𝑠 − 𝑁𝑒𝑤 𝐷𝑒𝑏𝑡 𝐼𝑠𝑠𝑢𝑒𝑑)
(3)
In the case of Columbia Sportswear Co. there is a low leverage, being the ratio of debt to equity equal to 1,36%, at September 30, 2014. Assuming firm’s future strategy is to remain or reduce debt to equity level, it is expected equity close to asset value. Since debt amount is very low, FCFF and FCFE valuation models must be nearby.
Free Cash Flow to the Firm (FCFF) Valuation
The FCFF approach values the company as a whole, equity and debt. As a result, to obtain firm value, free cash flow to the firm must be discounted at the weighted average cost of capital (WACC). FCFF is considered the available cash flow to all investors: equity holders, debt holders and non-equity investors. WACC is the combined cost of all investors. The value of the company can be written as the present value of the FCFF:
𝐹𝑖𝑟𝑚 𝑉𝑎𝑙𝑢𝑒 = ∑ 𝐹𝐶𝐹𝐹𝑡 (1 + 𝑊𝐴𝐶𝐶)𝑡 𝑡=∞ 𝑡=1 (4) Where, 𝐹𝐶𝐹𝐹𝑡= 𝐹𝑟𝑒𝑒 𝐶𝑎𝑠ℎ 𝐹𝑙𝑜𝑤 𝑡𝑜 𝑡ℎ𝑒 𝑓𝑖𝑟𝑚 𝑖𝑛 𝑦𝑒𝑎𝑟 𝑡 𝑊𝐴𝐶𝐶 = 𝑊𝑒𝑖𝑔ℎ𝑡𝑒𝑑 𝑎𝑣𝑒𝑟𝑎𝑔𝑒 𝑐𝑜𝑠𝑡 𝑜𝑓 𝑐𝑎𝑝𝑖𝑡𝑎𝑙
In the above formula is considered a multi stage period where for each period the cash flows are forecasted and discounted at WACC. As stated by Stowe et al (2007), Free cash flow to firm is defined as the “cash flow available to the company’s suppliers of capital after all operating expenses have been paid and necessary investments in working capital and fixed capital have been made”. The FCFF formula is given by:
𝐹𝐶𝐹𝐹 = 𝐴𝑓𝑡𝑒𝑟 𝑡𝑎𝑥 𝑜𝑝𝑒𝑟𝑎𝑡𝑖𝑛𝑔 𝑖𝑛𝑐𝑜𝑚𝑒 − 𝐶𝑎𝑝𝑖𝑡𝑎𝑙 𝐸𝑥𝑝𝑒𝑛𝑑𝑖𝑡𝑢𝑟𝑒𝑠 + 𝐷𝑒𝑝𝑟𝑒𝑐𝑖𝑎𝑡𝑖𝑜𝑛𝑠
− 𝐶ℎ𝑎𝑛𝑔𝑒 𝑖𝑛 𝑛𝑜𝑛 𝑐𝑎𝑠ℎ 𝑤𝑜𝑟𝑘𝑖𝑛𝑔 𝑐𝑎𝑝𝑖𝑡𝑎𝑙 (5)
Adjusted Present Value (APV)
APV valuation model follow Modigliani and Miller literature, which proposes that in a perfect market the company’s choice of financial structure would not affect the value of
the assets. However, market imperfections as taxes and distress costs, affect enterprise value.
Therefore, adjusted present value is considered as an alternative of WACC, every time the company’s capital structure changes constantly. Hence, it is considered more accurate to estimate components separately step by step and evaluate their impact on firm’s value. It gives the manager a sense of how leverage is affecting the company, positively and negatively.
In APV method, company’s value is calculated by separating “the effects on value of debt financing from the value of the assets of a business”(Damodaran, 2007). According to Fernandez, the firm value using this model is computed by adding two values: first the value of the firm unlevered and secondly the value of debt benefits minus costs. The value of the firm corresponds to:
𝑉𝑎𝑙𝑢𝑒 𝑜𝑓 𝑏𝑢𝑠𝑖𝑛𝑒𝑠𝑠
= 𝑉𝑎𝑙𝑢𝑒 𝑜𝑓 𝑏𝑢𝑠𝑖𝑛𝑒𝑠𝑠 100% 𝑒𝑞𝑢𝑖𝑡𝑦 𝑓𝑖𝑛𝑎𝑛𝑐𝑖𝑛𝑔 + 𝑃𝑟𝑒𝑠𝑒𝑛𝑡 𝑣𝑎𝑙𝑢𝑒 𝑜𝑓 𝐸𝑥𝑝𝑒𝑐𝑡𝑒𝑑 𝑇𝑎𝑥 𝐵𝑒𝑛𝑒𝑓𝑖𝑡𝑠 𝑜𝑓 𝐷𝑒𝑏𝑡 − 𝐸𝑥𝑝𝑒𝑐𝑡𝑒𝑑 𝐵𝑎𝑛𝑘𝑟𝑢𝑝𝑡𝑐𝑦 𝐶𝑜𝑠𝑡𝑠
(6)
Regarding the inputs of the previous formula, first step is to compute the value of the firm without debt, where the expected FCFF must be discounted at the unlevered cost of equity. It is similar to WACC-DCF, just changes the discount rate:
𝑉𝑎𝑙𝑢𝑒 𝑜𝑓 𝑈𝑛𝑙𝑒𝑣𝑒𝑟𝑒𝑑 𝐹𝑖𝑟𝑚 = ∑ 𝐹𝐶𝐹𝐹𝑡 (1 + 𝑘𝑢)𝑡 𝑡=∞ 𝑡=1 (7) 𝑘𝑢 = 𝑢𝑛𝑙𝑒𝑣𝑒𝑟𝑒𝑑 𝑐𝑜𝑠𝑡 𝑜𝑓 𝑒𝑞𝑢𝑖𝑡𝑦
Next steps are estimated the effects of leverage interest tax shields and bankruptcy costs. Both of them are affected, positively and negatively, by leverage level. There is a controversial discussion among researchers regarding the discount rate for the interest tax shields. Myers (1974) defends that interest tax savings must be discounted at the cost of debt, assuming that interest tax shields must have the same risk as debt. While Harris and Pringle (1985), proposed discounting these tax savings at the cost of unlevered capital. Fernandez (2004) defends that the consistent way to estimate tax
shields is “the difference between the present values of two different cash flows: flows to the unlevered firm and the flows to the levered firm”. In agreement with Modigliani and Miller (1963) and Myers (1974), interest tax shields should be discounted at the cost of debt:
𝑃𝑉(𝑖𝑛𝑡𝑒𝑟𝑒𝑠𝑡 𝑡𝑎𝑥 𝑠ℎ𝑖𝑒𝑙𝑑𝑠)= 𝐷 ∗ 𝑡𝑐 (8)
Where,
𝐷 = 𝐷𝑒𝑏𝑡 𝑡𝑐 = 𝑇𝑎𝑥 𝑅𝑎𝑡𝑒
Finally step, is to calculate the expected bankruptcy costs. In theory it is the product between probability of bankruptcy and present value of bankruptcy costs.
𝑃𝑉 𝑜𝑓 𝐸𝑥𝑝𝑒𝑐𝑡𝑒𝑑 𝐵𝑎𝑛𝑘𝑟𝑢𝑝𝑡𝑐𝑦 𝑐𝑜𝑠𝑡 = (𝑃𝑟𝑜𝑏𝑎𝑏𝑖𝑙𝑖𝑡𝑦 𝑜𝑓 𝐵𝑎𝑛𝑘𝑟𝑢𝑝𝑡𝑐𝑦)(𝑃𝑉 𝑜𝑓 𝐵𝑎𝑛𝑘𝑟𝑢𝑝𝑡𝑐𝑦 𝐶𝑜𝑠𝑡) (9)
Computing expected bankruptcy costs seems an easy calculation but it is not possible to estimate directly the two inputs. In compliance with Damodaran (2007), there are two ways to calculate probability of bankruptcy, first by estimating the bond ratings and use the empirical estimates of default probabilities of each rating and secondly use a statistical to estimate the probability of default based upon the firm’s observable at each level of debt. The bankruptcy costs provide a difficult challenge and can be direct and indirect.
In sum, Adjusted Present Value presents separately the effects of finance the firm with debt and equity. It is advised to use APV valuation approach, whenever company’s capital structure is not constant. On the other hand, if capital structure is stable the value of the firm should be similar for DCF-WACC and APV.
In Columbia Sportswear Case I am not going to apply APV model since capital structure is stable. Over the last years Columbia presented a capital structure entirely financed by equity. Appendix U presents Columbia historical capital structure.
2.2.3 Excess Return Models – Economic Value Added
Excess return models, based on Damodaran (2007) literature, “have their roots in capital budgeting and the net present value”. Cash flows are separated according to the
cash flow return nature: normal and excess. The value of the project/company is written as: 𝑉𝑎𝑙𝑢𝑒 𝑜𝑓 𝑡ℎ𝑒 𝑝𝑟𝑜𝑗𝑒𝑐𝑡 = 𝐶𝑎𝑝𝑖𝑡𝑎𝑙 𝐼𝑛𝑣𝑒𝑠𝑡𝑒𝑑 𝑖𝑛 𝑡ℎ𝑒 𝑓𝑖𝑟𝑚 𝑡𝑜𝑑𝑎𝑦 + 𝑃𝑉 𝑜𝑓 𝑒𝑥𝑒𝑐𝑒𝑠𝑠 𝑟𝑒𝑡𝑢𝑟𝑛 𝑐𝑎𝑠ℎ 𝑓𝑙𝑜𝑤𝑠 𝑓𝑟𝑜𝑚 𝑏𝑜𝑡ℎ 𝑒𝑥𝑖𝑠𝑡𝑖𝑛𝑔 𝑎𝑛𝑑 𝑓𝑢𝑡𝑢𝑟𝑒 𝑝𝑟𝑜𝑗𝑒𝑐𝑡𝑠 (10)
There are several versions of excess return models, I will analyze the most common one, economic value added (EVA). According to Foundations of Economic Value Added, EVA model differ from other DCF models “because it provides a direct measure of the value added of the invested capital”. The EVA is a measure of the value created by a project, it is given by the return minus cost times the invested capital.
𝐸𝑉𝐴 = (𝑅𝑒𝑡𝑢𝑟𝑛 𝑜𝑛 𝐶𝑎𝑝𝑖𝑡𝑎𝑙 𝐼𝑛𝑣𝑒𝑠𝑡𝑒𝑑 − 𝐶𝑜𝑠𝑡 𝑜𝑓 𝐶𝑎𝑝𝑖𝑡𝑎𝑙) 𝑥 𝐶𝑎𝑝𝑖𝑡𝑎𝑙 𝐼𝑛𝑣𝑒𝑠𝑡𝑒𝑑 (11)
In compliance with Koller et al (2010), EVA method is a derivation of the DCF model, to assure equivalence there are several rules that must be followed as invested capital should be of the beginning-of-year, same invested-capital number for both economic profit and ROIC. EVA can be valued as follow:
𝑉𝑎𝑙𝑢𝑒 = 𝐼𝑛𝑣𝑒𝑠𝑡𝑒𝑑 𝐶𝑎𝑝𝑖𝑡𝑎𝑙0+ ∑ 𝐼𝑛𝑣𝑒𝑠𝑡𝑒𝑑 𝐶𝑎𝑝𝑖𝑡𝑎𝑙𝑡−1× (𝑅𝑂𝐼𝐶𝑡− 𝑊𝐴𝐶𝐶) (1 + 𝑊𝐴𝐶𝐶)𝑡 ∞ 𝑡=1 (12)
As it is presented by the formula, value of the firm is equal to the invested capital plus the present value of all future value created. The firm is able to generate profit if the return on capital exceeds the cost of capital. In the case, that they are equal the value of operations will equal to invested capital. As it derives from FCFF it is discounted taking into account all enterprise risk. Regarding Excess Return Model it is not going to be applied to value Columbia Sportswear as it is considered a performance evaluation model it is easy to manipulate to reach positive performances (Tebogo 2011).
2.2.4 Contingent Claim Valuation
Contingent Claim Valuation, also know as option theory, is considered “a powerful tool in investment intensive industries”, which involve a high degree of uncertainty, energy and R&D intensive industries (Frykman and Tolleryd, 2003). Option valuation is used to decide whether or not to take a certain project/asset. According to Trigeorgis (1995), “an options approach to capital budgeting has the potential to conceptualize and
quantify the value of options from active management”. This ability reflects the flexibility to react on unexpected event and abandon projects that seam not to be profitable. Most common option pricing models the Binomial and Black-Scholes model. In the case of Columbia Sportswear I am not going to apply this method since it is not appropriate to value company’s operations.
2.2.5 Further Components in DCF Valuation WACC
Weighted average cost of capital is “the most common way to estimate the required rate of return for a company’s suppliers of capital” (Stowe et al, 2007). WACC reflects the risk of the whole company as it includes a weighted average of required rates of return of equity and debt, adjusted to interest tax shields.
𝑊𝐴𝐶𝐶 =𝐷(1 − 𝑡) 𝑉 𝑘𝑑+
𝐸
𝑉𝑘𝑒 (13)
In order, to compute WACC we need to take into account firm’s capital structure, cost of debt, cost of equity and company’s marginal income tax rate. Capital structure it can look an easy task but it requires attention, as value of debt and equity should be market value. The value of equity can be computed directly by multiplying company’s shares outstanding by the stock price. On the other hand, according to Frykman and Tolleryd (2003), to value debt there are several alternatives as calculating the net present value of all future debt payments, including debt full payment or using recent transaction by the company.
Cost of Equity (Ke)
The cost of equity represents the return of investing on the company for shareholders. It “comprises two components - the risk-free interest that investors earn on a risk-free investment and an additional yield that is appropriate for the level of risk that the investor takes when investing in the company” (Frykman and Tolleryd, 2003). There are several ways to compute the cost of equity as capital asset pricing model (CAPM), Fama-French three-factor model and Arbitrage Pricing Theory model (APT). Following Koller et al (2010), these three models differ in the way they define the risk, CAPM defines risk as stock’s sensitivity to the market and Fama-French defines risk as a stock’s sensitivity
to the stock market, a portfolio based on firm size and a portfolio based on book-to-market ratios. Therefore in order to estimate the cost of equity I will use the CAPM as it is considered the best model for developing WACC to use in a company valuation.
The cost of equity, through CAPM, is equal to:
𝑘𝑒= 𝑟𝑓+ 𝐵𝑒(𝑟𝑚− 𝑟𝑓) (14) Where, 𝑟𝑓 = 𝑟𝑖𝑠𝑘 − 𝑓𝑟𝑒𝑒 𝑟𝑎𝑡𝑒 𝑜𝑓 𝑟𝑒𝑡𝑢𝑟𝑛 𝐵𝑒 = 𝐸𝑞𝑢𝑖𝑡𝑦 𝐵𝑒𝑡𝑎 (𝑟𝑚− 𝑟𝑓) = 𝑚𝑎𝑟𝑘𝑒𝑡 𝑟𝑖𝑠𝑘 𝑝𝑟𝑒𝑚𝑖𝑢𝑚 Risk-Free Rate
The risk-free rate usually is associated with government bond or Treasury bill of the company’s country. The recommended maturity for the bond is between 10 and 15 years the duration that matches the investment horizon. In Columbia Company case for the risk-free rate I am going to use US 10 years treasury bonds, as the firm‘s home country is United States.
Market Risk Premium
The market risk premium is given by the average difference of investing in a risky asset (shares) and investing in a risk-free application (Treasury Bonds). Based on Koller et al (2010), there are three methods to estimate market risk premium: measuring historical returns, using regression analysis to project expected mrp and using DCF valuation. None of this models is able to estimate precisely market risk premium, literature on this topic defends that it varies from five to six percent for firms traded in S&P 500.
Equity Beta
Equity Beta, according to CAPM, measures how much the company stock and market move together. To estimate precisely, firstly it is estimated a raw beta and then through peer group the beta is improved. The raw beta is computed by:
𝐵𝑒= 𝐶𝑜𝑣(𝑅𝑒, 𝑅𝑀) 𝑉𝑎𝑟(𝑅𝑀) (15) Where, 𝑅𝑒 = 𝐶𝑜𝑚𝑝𝑎𝑛𝑦 𝑠𝑡𝑜𝑐𝑘 𝑟𝑒𝑡𝑢𝑟𝑛𝑠 𝑅𝑀 = 𝑆𝑡𝑜𝑐𝑘 𝑀𝑎𝑟𝑘𝑒𝑡 𝑟𝑒𝑡𝑢𝑟𝑛𝑠
In compliance with Koller et al (2010), several empirical studies lead to the conclusion that the measurement period of raw regressions should include at least 60 data point/periods and be based on monthly returns (example: five years of monthly returns). In this case, Columbia stock returns should be regressed against S&P 500, as it is considered value weighted index well-diversified portfolio for United States.
Therefore, Beta estimation is more accurately, agreeing to Koller et al (2010), when it is considered an unlevered industry beta and then relevering the industry beta to the company’s target capital structure. Companies in the same industry are exposed to similar operating risk, so they have similar operating betas. In order to estimate equity beta based on unlevered beta the following formula is given:
𝐵𝑒= 𝐵𝑢(1 +
𝐷
𝐸) (16)
As equity beta varies with operating and financial risk, it depends from the company’s operating beta times leverage factor. Shareholders of a company with more debt face greater risk, and this increase is reflected in a greater equity beta.
Cost of Debt (Kd)
Cost of debt, according to Frykman and Tolleryd (2003), is the interest that a company has to pay at the moment it is funded by lenders. Thus, it should be considered the current market cost of debt and not the historical cost at which the company have borrowed its money.
Damodaran (2012), defends that the cost of debt, it is determined by the following variables:
1. Risk Free Rate: cost of debt is directly associated with risk free rate, increase in riskless means increase in cost of debt;
2. Default risk of the company: “As the default risk of firm Increases, the cost of borrowing money also increase”.
3. Tax advantage associated with debt: interest is tax deductible, after-tax cost of debt is a function of tax rate.
The simplest scenario, to estimate the cost of debt it is by using the yield to maturity of company’s bonds, which “should be calculated on liquid, option-free, long-term debt” Koller et al (2010). The YTM is considered the discount rate of the bond’s coupon (future promise cash flows) can be computed using the following formula:
𝐵𝑜𝑛𝑑 𝑃𝑟𝑖𝑐𝑒 = 𝐶𝑜𝑢𝑝𝑜𝑛 (1 + 𝑌𝑇𝑀)+ 𝐶𝑜𝑢𝑝𝑜𝑛 (1 + 𝑌𝑇𝑀)2+ ⋯ + 𝐹𝑎𝑐𝑒 + 𝐶𝑜𝑢𝑝𝑜𝑛 (1 + 𝑌𝑇𝑀)𝑁 (17)
An alternative way consists on estimating the cost of debt through companies’ debt rating and associated default spreads. Estimating cost of debt through yield to maturity is recommended for companies with investment grade debt, at BBB or better. In case of a lower grade, it is suggested by Koller et al (2010) to use APV approach.
For firms without available information about their rating, Damodaran (2012) purposes two alternative ways. Firstly, looking at the recent borrowing history, to get a sense of the types of default spreads being charged. Alternatively estimating a synthetic rating based upon company’s financial ratios. For Columbia company situation I am going to select the second suggestion given by professor Damodaran.
Terminal Value
Terminal Value, or Continuing Value, is essential to any valuation as it accounts for a large proportion of company’s total value. It is important to compute TV because after certain years, forecasting becomes less accurate and difficult to estimate. Terminal Value, according to Frykman and Tolleryd (2003), represents “the free cash flows from the year after the last year of the explicit period to perpetuity” discounted back to today. It is calculated when a firm reaches steady state and starts growing at a constant rate 𝑔𝑛. The firm value can be written as (Damodaran 06):
𝐹𝑖𝑟𝑚 𝑉𝑎𝑙𝑢𝑒 = ∑ 𝐹𝐶𝐹𝐹𝑡 (1 + 𝑊𝐴𝐶𝐶)𝑡 𝑡=∞ 𝑡=1 +𝐹𝐶𝐹𝐹𝑛+1⁄(𝑊𝐴𝐶𝐶 − 𝑔𝑛) (1 + 𝑊𝐴𝐶𝐶)𝑛 (18)
After the explicit period, when the free cash flows assume a stable growth, the value of the company to perpetuity is calculated. In line with Damodaran (2007), g, which is considered the expected growth rate in free cash flow should not the growth rate of the economy in the long term.
2.3 Conclusion
Following a deep research regarding valuation methods for firms, it is time to select, based on the literature review, the most reliable methods to evaluate Columbia Sportswear Company. As I meant previously it is essential to have knowledge about which valuation method to apply to a certain company.
In addition, I will use DCF-WACC model to value Columbia Sportswear. Based in the literature Columbia Sportswear does not meet any limitation to apply DCF. In this way, I will estimate the model in two growth stages: unstable and stable.
Besides that I will estimate Columbia Sportswear price using relative valuation to provide insights between Columbia and its peer group. I will consider EV/EBITDA, since it is the most appropriate for company’s features. Peer group will be selected within a cluster analysis.
In conclusion, I am going to valuate Columbia Sportswear through two distinct models, a principal model DCF-WACC and a crosschecking direct method, multiples valuation.
3 Industry Analysis
3.1 Industry OverviewColumbia Sportswear Company is inserted in the apparel, footwear and accessories industry. It particularly operates in outdoor, active lifestyle apparel and footwear industry. According to Joshua T Bennett (2014), “The outdoor industry is inherently difficult to define as it is at the intersection of several complementary segments of larger industries”, it is considered a hybrid market with a large range of participants and products. Following Joshua’s definition, this chapter will abroad several industries, which are directly connected and useful to explain outdoor market situation. In the analysis are going to be presented the most relevant features that affect outerwear industry: weather seasonality, consumers spend partners and innovation. Finally an industry framework and market structure description will be presented.
3.2 Weather Seasonality
Outdoor industry is highly dependent on weather conditions. Whenever weather conditions for a particularly season vary significantly from the normal trends, sales for the seasonal products may be adversely affected. Unseasonable weather conditions represent, for the companies, excess inventory forcing the companies to sell products at discounted price. In Columbia Sportswear case the sales are highly dependent on cold-weather seasons, which can be affected significantly by global warming cold-weather trends.
In outdoor industry sales tend to be unequal distributed over the year. It is noticeable that outdoor companies’ sales are more significant during the second semester of the year. Outerwear companies tend to focus in cold weather products, which will lead to greater revenue in the winter. To explain sales seasonality during the year I pick a group of companies whose main business are outdoor products Appendix C.
3.3 Consumer Spend Patterns and Innovation
Being outdoor industry, inserted in consumer discretionary sector, is directly exposed to consumers’ purchase power. According to Columbia Sportswear1, their market is
“heavily dependent…upon discretionary consumer shopping and spending patterns”.
Consumer purchase power is directly related with countries’ macroeconomic situation, consequently in Appendix D it is given a brief macroeconomic advice for major geographic regions: US, Europe and China.
Moreover, in almost every sector product innovation is crucial and outdoor industry is not an exception. Key players’ battle to have top products and increase consumer awareness. According to Columbia, innovative products enables outdoor enthusiasts to enjoy “activities longer in greater comfort by keeping them warm or cool, dry and protected”. Appendix E displays two examples of developed technology in outdoor industry.
3.4 Industry General Framework
In order to analyse Columbia Sportswear share evolution I related it with S&P 500 and Apparel and Textile Products (ATP) index. ATP index was created by me and consists in United Sates apparel and textile firms, with a market capitalization greater than one billion dollars. In Graph 1 it can be seen that in the last five years Columbia stock and ATP index growth performance was greater than S&P 500 index. This means that apparel industry over the last five years presented greater growth rates than total industry average. Regarding Columbia stock and ATP index. Appendix F shows both trends.
Graph 1: ATP index, S&P 500 index and Columbia Co. Share (2010-2015). Source: Bloomberg Data 0 500 1000 1500 2000 2500 0 20 40 60 80 100
jan/10 jan/11 jan/12 jan/13 jan/14 jan/15
U S$ (S&P 500 In d ex) U S$
3.5 Market Structure
Outdoor industry is considered as part of sportswear industry. These two markets share several companies, which explains the strong connection between them. Globally sportswear industry is fragmented, being controlled by a small number of participants. The remaining players are smaller firms with strong local brand position, although with financial limitations to expand their business to other regions.
The prospects for the future of sportswear and outdoor industries are optimistic. Globally, consumers are raising health and wellbeing awareness, consequently increasing participation in activities related with outdoor and sports market. Besides that there is a strong connection between sportswear and fashion, a convergence of casual design with athletic performance that represents for manufactures an opportunity to enter into a new segment.
The outdoor Industry is a worldwide industry present all over the world. Major outdoor companies operate around the globe, making outdoor market highly competitive. As result, compared to other apparel and footwear markets, represents high growth opportunities. Therefore, each geographic region is at different development stage, in this way I will give a brief description of the most relevant markets: United States, Europe and China.
United States is the main outerwear market headquartering major companies. Examples of VF Corp, Columbia Sportswear and Deckers Outdoor show United States' strong contribution. According to the Outdoor Foundation2, in 2013 about 143 million
Americans participated in outdoor activities, mainly it can be explained by higher health concerns, great consumers’ purchasing power and education.
The European outdoor market, despite the crisis and negative macroeconomic situation, takes second place in terms outdoor industry development. According to the European Outdoor Group website, the European outdoor market in 2013, “is worth more than €10 billion and continues to grow”. In addition, European outdoor market is fragmented, with the top 10 countries controlling 86% of outdoor retail sales (Appendix G). Thus three market leaders are Germany, Great Britain and France. Over the last year it
presented growth rates of around 3%. European Outdoor market, despite crisis and negative macroeconomic situation
China is an emergent economy, showing negative signals but where all outdoor companies want to gain a relevant position. Although in comparison with the US it is in its infancy. Prospects for this market are high; Chinese middle classes are gaining purchasing power and outdoor activities among the population are becoming trendy. However, competition is fierce: Columbia faces competition from The North Face (owned by VF Corp) and Toread, local brand. Within the Chinese market, apparel multinationals find it difficult to expand their operations over the entire region. Tier 3 and 4 cities, smaller cities, constitute a barrier as local players dominate them. Appendix H shows the multinationals and local players, and strengths and weakness in the Chinese apparel market.
In compliance with Euromonitor forecasting for the Sportswear global market, different growth partners for the different geographic segments are expected (Graph 2). Latin America and Eastern Europe are the regions that represent the highest compound annual growth rates (CAGR). Therefore, sportswear forecasts presented can be used as a guide to estimate outdoor markets. However, they should not be taken as a fundamental trend since it is proved that the outdoor industry is at a different stage in comparison to sportswear.
Graph 2: Source: The Sportswear Revolution: Global Market Trends and Future Growth Outlook, by Euromonitor International
3,7% 16,6% 4,0% 13,6% 10,1% 8,9% 3,1% 0% 5% 10% 15% 20% Norh
America AmericaLatin EasternEurope WesternEurope Middle Eastand Africa Asia Pacific Australasia Sportswear market CAGR (2013-2017)
4 Company Analysis
4.1 Company OverviewColumbia Sportswear headquarters are located in Oregon, United States and company’s Chief Executive Officer is Timothy Boyle. Columbia Sportswear Company is a public company, traded on the NASDAQ index, in the apparel and footwear industry. Columbia's core business is the designing, sourcing, marketing and distribution of active outdoor apparel, footwear, accessories and equipment. In Appendix I is presented company’s history.
Columbia Sportswear is a global company present in approximately 100 countries and sold through several distribution channels: wholesalers, direct-to-consumer, independent and licensees. The products are branded under five primary brands: Columbia, Mountain Hardwear, Sorel, Montrail and prAna.
4.2 Trademarks
Columbia Sportswear Company owns Columbia, Sorel, Mountain Hardware, Montrail, Pacific Trail and prAna. The Columbia brand is the major brand of the company, accounting for approximately 84% of total sales as shown in Appendix J. Under the Columbia brand, the company sells all kind of outdoor products such as apparel, footwear, accessories and equipment. Sorel is the brand with the second highest volume of sales, under this brand the company sells footwear focused on fashion-forward women that look for stylish protection and comfort. The Mountain Hardwear brand's premium-priced technical products target elite alpine athletes, climbing enthusiasts and consumers who are inspired by them. Next comes prAna, the most recent acquisition, purchased for $188,467,000 in May 2014. PrAna is a lifestyle apparel brand sold through approximately 1,400 speciality and online retailers across North America. In his latest conference call, on February 12, 2015, President Tim Boyle explained to investors that the prAna brand acquisition allows for the diversification of their brand portfolio, giving access to an entire new segment of active social conscience consumers. Regarding Columbia Sportswear’s categories, apparel and footwear, are explained in Appendix K.
4.3 Distribution Channels and Product Manufacturing
Columbia products are sold through a mix of distribution channels that include wholesale, independent distributors, direct-to-consumer channels and licensees. Wholesale channels include speciality outdoor and sporting goods stores, sporting goods chains and Internet retailers. Independent distributors are common in regions where the company does not have direct sales and marketing operations.
Direct-to-consumer is a channel where products are sold to consumers through Columbia’s branded retail stores and online. It provides high visibility of the company’s brands and helps Columbia to monitor the needs and preferences of consumers. The outlet stores have an important role in the firm's inventory management, as they permit the sale of excess products and avoid inventory losses.
Licensees consist of agreements with third parties, which permit third parties to manufacture or contract to manufacture products under Columbia trademarks. The licensees operate in competitive markets such as apparel, footwear, sunglasses and watches.
Independent factories located outside the United States manufacture all products distributed and sold by the company. Production is almost entirely located in Asia Pacific, with Vietnam and China accounting for the highest share. Columbia believes that the use of independent factories enables limiting the capital expenditures and risks associated with owning such a large property. In addition, outsourcing production increases production capacity and flexibility.
4.4 Geographic Mix
Columbia Sportswear is an international organization present all over the globe. Its operations are divided into four regions: United States (US), Latin America and Asia Pacific (LAAP); Europe, Middle East and Africa (EMEA); and Canada. Each segment operates independently in terms of: design, development, marketing and distribution of outdoor apparel, footwear, accessories and equipment. Net Sales for each geographic segment are in Appendix L.
United States
The US is the geographic segment that represents the highest share of total sales, in 2014 accounting for 57% of net sales. In this region, distribution network consists of 3300 wholesales, 74 outlet retail stores, 19 branded retail stores, 5 branded e-commerce websites and licensees’ sales.
In 2014, sales in this region rose about 23%, which resulted from new brand prAna sales, increase in the wholesale and direct-to-consumer businesses. Columbia Sportswear is making a substantial investment in DTC channel, explained by the additional 21 stores.
Latin America and Asia Pacific
In this segment Columbia sells products to approximately 800 wholesales in Australia, New Zealand, Latin America and Asia. In 2014, Columbia Sportswear started to operate a joint venture with Swire Resources Limited (“Swire”), with the aim of developing firm’s business in China. JV distribution channels are 80 retail stores, e-commerce website and 50 wholesales. Columbia Sportswear controls 60% of the joint venture, being joint venture operations recognized in company’s financial statements.
Last year, net sales for the LAAP region increased 39%, about $137,2 million. The main drivers for this growth were the revenues generated by China JV, offsetting a decrease in Korean and Latin America markets. At the moment this geographic segment represents the second major source of revenue for Columbia Sportswear.
Europe, Middle East and Africa
The EMEA region in 2014 contributed 12% of net sales. In this region Columbia benefits from products sales to approximately to 4800 wholesalers, operating 6 retail stores and e-commerce websites across several European countries. This segment is the third in terms of revenue shares; in the previous two years net sales increased by 12,3%. In recent years sales in the EMEA region have been stable, which can be partially explained by the latest financial crisis affecting Europe.
Canada
The Canadian region is the geographic segment that represents the lowest share of net sales, 7% of total revenues. In this region Columbia sells products to 1000 wholesales, operates 3 outlet retail stores and an e-commerce website. Following the trend of other regions, last year Canada’s net sales increased 28%.
4.5 Company’s Strategic Growth
Columbia Sportswear is determined to achieve sustainable and profitable growth by creating innovative products, elevating consumer perception and increasing demand for their products. The growth strategies are the following:
Design innovative products that meet outdoor enthusiasts expectations. An example is the “Turbo Down” insulation, a way of providing insulation in jackets that is less expensive, warmer and more breathable than competing brands.
Expand direct-to-consumer channel: build a network of first line branded retail stores, expand outlet stores and launch an e-commerce platform. A sales rise in this channel mean higher margins.
Create strong marketing programs and advertisement campaigns, in order to differentiate Columbia brands from rivals.
Increase Columbia’s footwear business by offering innovative and performance-driven products. Expand distribution into leading footwear retail channels.
Improve European market performance by creating product variety and marketing programs that are consistent with Columbia's global focus on innovative products.
Columbia is implementing a new enterprise resource planning (ERP) system that supports operations and financial reporting. The new ERP system is already operating in Canada and the United States; the next phase is to implement ERP for international distributors.
5 Financial Statements Reorganization and Valuation Estimates
After acquired all knowledge regarding industry and company analyses, it is time to start looking at Columbia Sportswear’s statements. Financial statements are organized according to the accounting principles applied by each firm. Thus from a valuation perspective, adjustments for past statements items are needed in order to forecast future statements accurately. In Columbia’s case, for valuation purposes, reorganization was applied in Income Statement and Balance Sheet. Thus in this chapter, before forecasting future items, I will proceed with the reorganization of financial statements.5.1.1 Reorganizing Income Statement
Income statement main adjustments are done in Cost of sales and Selling General and Administrative (SGA) items. In both cases stock based compensation, derivative contracts, and, depreciation and amortization expenses are deducted. Loss on disposals of PPE and transaction costs from JV and prAna, are also not considered in SGA item. After the readjustment the income statement is prepared to forecast future items based on historical data. Reorganized income statement can be found in Appendix N.
5.1.2 Reorganizing Balance Sheet
In Balance Sheet case fewer adjustments are made, since it is better organized for valuation purposes. In this way, adjusted items are prepaid expenses and accrued liabilities, which included derivative contracts recognized as non-operating item. The reorganized Balance Sheet is presented in Appendix O.
5.2 DCF Estimation
Now Columbia’s company financial statements are prepared and adapted to estimate valuation items. Next step is to forecast future inputs used in DCF-WACC valuation. I am going to consider an eleven years explicit period, from 2015 to 2025. Balance Sheet and Income Statement will be estimated for five years period.
5.2.1 Net Sales
Net sales estimation is fundamental in equity valuation, due to the way it affects the majority of operating items. Columbia’s net sales estimation is divided in two stages:
first five years by geographic region, last six years as a whole. During the final six years it is expected a decrease in net sales growth approaching steady state.
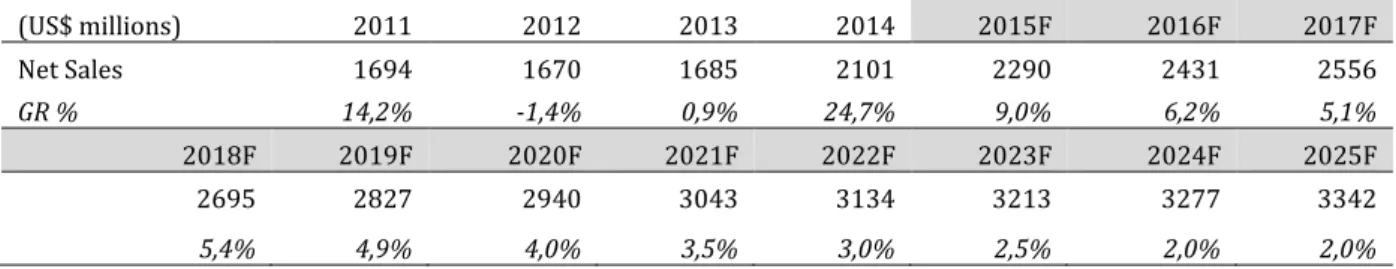
In a general view, during 2014 Columbia sales had a great performance increasing 25%. For this contributed China JV, new brand prAna and direct-to-consumer channel. Hence in future the positive trend is expected to continue but not at the same rate. Moreover, Columbia ability to raise net sales is highly connected to the kind of products offer to customers. In Table 1 are forecasted total Columbia Sportswear net sales for the next eleven years. In Appendix P are predicted net sales by geographic segment.
(US$ millions) 2011 2012 2013 2014 2015F 2016F 2017F Net Sales 1694 1670 1685 2101 2290 2431 2556 GR % 14,2% -1,4% 0,9% 24,7% 9,0% 6,2% 5,1% 2018F 2019F 2020F 2021F 2022F 2023F 2024F 2025F 2695 2827 2940 3043 3134 3213 3277 3342 5,4% 4,9% 4,0% 3,5% 3,0% 2,5% 2,0% 2,0%
Table 1. Net Sales Estimation
5.2.1.1.1 United States
United States is the major source of revenues for Columbia Sportswear, represents more than half of sales. During last year company had invest intensively in US direct-to-consumer channel and supply chain management. Branded stores and websites doubled and at the moment are the major growth drivers in US region.
Moreover, according to February conference call is expected a “high-teen” percentage growth for US market in 2015. This raise is coming from direct-to-consumer channel, prAna and Sorel brands. Regarding DTC, e-commerce last year increased 40% and it is expected to continue the positive trend. In prAna case, it is expected to benefit from Columbia Sportswear’s, valuable, distribution channels. As result, I predict for 2015 a net sales growth equal to 2014 organic growth of 17%.
Furthermore, in subsequent years it is expected a decrease in net sales growth. Since prAna has covered all US market and DTC channel reaches maturity stage. In 2016, I expect a 9% growth and on subsequent years a net sales increase of 6% to 5%.
5.2.1.1.2 LAAP
In LAAP region the main growth driver is China JV. In the past, this segment has faced negative contribution in net sales from North Korea and Latin America. In North Korea, it is considered a competition issue, since Columbia Sportswear is facing difficulties to adapt to this market. In Latin America case, the negative macroeconomic environment it is not permitting company’s net sales rise.
In addition, for the year 2015, Columbia Sportswear expectations are not optimistic regarding net sales growth. According to the company’s conference call, it is predicted decrease in sales growth about “mid-single digit decline”. In this way, I expect a decrease of 4% in net sales driven from JV slowdown, and North Korea and Latin America negative impact.
Considering further years, I predict an improving in LAAP region. In this line, Columbia Sportswear prAna internationalization to other geographic segments means growth opportunity. Resulting in a sales growth recover of 2%, 4%, 5% from 2016 to 2019.
5.2.1.1.3 EMEA
In EMEA segment the European countries are the net sales main contributors. Recently, macroeconomic scenario in this region is not the best. Western European countries are recovering from the financial crisis and, Russia and Ukraine are in conflict.
Having in consideration negative environment in EMEA, Columbia Sportswear recommends a “mid-single digit decline” in net sales for 2015, driven by mid-digit growth in Europe offset by Russian market. So I assume a 4% sales decrease in 2015.
In addition, for remaining years I calculate growth rate based in a weighted average by region. I split the segment in three regions: Western Europe, Eastern Europe, and Middle East and Africa. Since there is not any public information about Columbia’s sales inside EMEA, I assumed 10% of sales for MEA and remaining 90% for Europe. Inside European market, I assumed that Columbia Sportswear sales are allocated in the same way as European Outdoor Group, appendix H. In this way, EE and WE, weight in the segment is
respectively, 70% and 20%. Resulting in a CAGR of 4,6%, 2016-2019, according to Euromonitor3 estimations.
5.2.1.1.4 Canada
Canada represents the smaller segment in terms of net sales. It is a developed country, where outdoor activities participation rates are high. Consequently, Columbia Sportswear invests great amounts in Canadian market. Company’s distribution channels are well established and Canada was the first region where the new supply chain software was installed.
For the year 2015, Columbia predicts “mid-single digit USD growth” in Canada. In compliance with Euromonitor3 report, I assume a CAGR of 3,4%, 2015-2019. In the
same way I expect an increase in DTC business, precisely e-commerce.
5.2.2 Cost of Sales
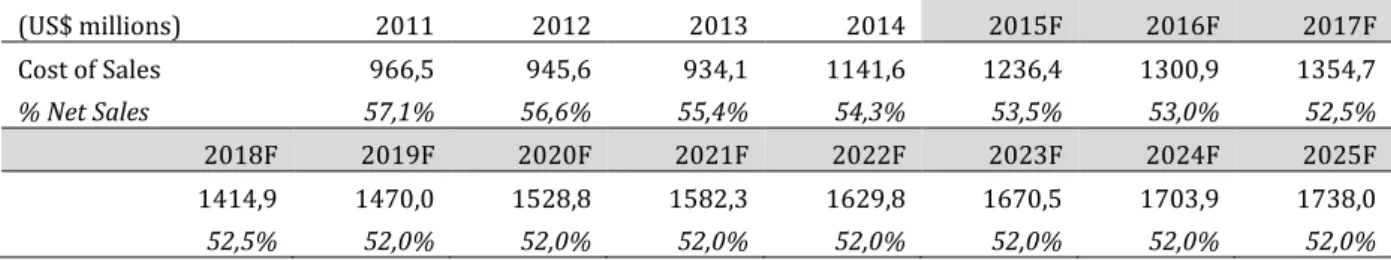
Cost of sales item, after the reorganization incurred, includes all direct product costs and costs related to shipping, duties and importation. It is highly dependent from Columbia’s ability to generate revenues.
Analysing previous years cost of sales, can be conclude that there is a decreasing trend (Appendix Q), which can be mainly explained by Columbia investment in direct-to-consumer channel. In general, sales through DTC provide higher margins than wholesales and other distribution channels. In this way, in the future I expect that cost of sales margin decreases until 2019, at the time DTC and supply chain investments are assumed to end. (US$ millions) 2011 2012 2013 2014 2015F 2016F 2017F Cost of Sales 966,5 945,6 934,1 1141,6 1236,4 1300,9 1354,7 % Net Sales 57,1% 56,6% 55,4% 54,3% 53,5% 53,0% 52,5% 2018F 2019F 2020F 2021F 2022F 2023F 2024F 2025F 1414,9 1470,0 1528,8 1582,3 1629,8 1670,5 1703,9 1738,0 52,5% 52,0% 52,0% 52,0% 52,0% 52,0% 52,0% 52,0%
Table 2. Cost of Sales estimation
3The Sportswear Revolution: Global Market Trends and Future Growth Outlook, by Euromonitor International