U
NIVERSIDADE DEL
ISBOAF
ACULDADE DEM
OTRICIDADEH
UMANAP
OSTPRANDIAL
G
LUCOSE
R
ESPONSES
I
N
T
RAINED
O
LDER
A
DULTS
:
E
FFECTS
O
F
B
REAKING
-U
P
S
EDENTARY
T
IME
A
ND
2
W
EEKS
D
ETRAINING
Dissertação elaborada com vista à obtenção do Grau de Mestre em
Exercício e Saúde
Orientador: Professor Doutor Luís Fernando Cordeiro Bettencourt Sardinha
Presidente
Doutora Maria de Fátima Marcelina Baptista, professora associada com agregação da Faculdade de Motricidade Humana da Universidade de Lisboa;
Vogais
Doutor Luís Fernando Cordeiro Bettencourt Sardinha, professor catedrático da Faculdade de Motricidade Humana da Universidade de Lisboa;
Doutora Analiza Mónica Lopes Almeida Silva, professora auxiliar com agregação da Faculdade de Motricidade Humana da Universidade de Lisboa.
I
NÊSR
IBEIRO DOSR
AMOSC
ORREIA3
Acknowledgements/Agradecimentos
Passados quase dois anos e meio, chegou o momento de agradecer a algumas pessoas que, de alguma forma, me ajudaram neste percurso tão importante da minha vida pessoal e profissional.
Primeiramente, gostaria de agradecer ao meu orientador Professor Doutor Luís Bettencourt Sardinha por me ter convidado a preparar e implementar, de raiz, um projeto de investigação. O rigor e excelência que me transmitiu diariamente permitiram-me crescer enquanto pessoa e profissional. Agradeço-lhe a confiança e oportunidade.
Júlia e Sofia, as minhas companheiras de viagem. Obrigada por terem entrado nesta aventura comigo, por terem partilhado comigo, durante estes 18 (sim, dezoito!) meses, todos os momentos bons e menos bons! Cresci e aprendi bastante com vocês. Foi puxadinho, mas acho que demos conta do recado! Agradeço-vos pela equipa que formámos.
Ana Mil-Homens, obrigada pelo esforço e pelo carinho que depositaste num projeto que, com o passar das semanas e dos meses, também se foi tornando um bocadinho teu. Obrigada por todas as trocas de turno e por todas as vezes que, mesmo depois de uma noite de trabalho, aparecias no Lab4 com a alegria do costume.
Todo este trabalho teria sido impossível sem a participação dos nossos queridos atletas. Tenho por todos vós uma enorme gratidão e admiro-vos por, de forma voluntária, terem disponibilizado bastante tempo da vossa vida pessoal para nos ajudarem a implementar este exigente projeto. Este trabalho também é vosso!
4 Diana, Pedro e João, do fundo do meu coração, agradeço-vos pela incansável ajuda que me deram durante toda esta viagem. A ti Diana, agradeço-te pela forma como, desde o início, me acolheste no laboratório e também por toda a ajuda que disponibilizaste para o projeto, mesmo não podendo estar tão presente no dia-a-dia do mesmo. A ti Pedro, obrigada pelo espírito crítico e pelo rigor que colocas diariamente em tudo o que fazes e que, ao mesmo tempo, procuras transmitir aos outros que contigo trabalham. És uma referência! A ti João, agradeço-te por teres contribuído decisivamente para o sucesso desta missão. Desde o recrutamento dos participantes até à conceção do documento final, foste incansável. Obrigada pela calma e confiança que me transmitiste, e por teres sempre uma solução para os problemas que surgem. És incrível!
Megan, como já dominas isto, agradeço-te em português. Apesar de ter sido a tua pior disciplina na escola, como costumas dizer, garanto-te que falas muito bem inglês! E ajudaste-me a melhorar o meu, obrigada por isso! Thanks Boss!
Professora Cristina e Professora Catarina, obrigada pela disponibilidade com que nos receberam no laboratório e por toda a ajuda que nos deram com as “questões dos sangues”. Paralelamente, agradeço ao Dr. Rogério Ribeiro e à Rita Andrade pelo auxílio com as análises de sangue e pelo esclarecimento de várias dúvidas que foram surgindo ao longo do projeto. Agradeço ao Dr. Jorge Magalhães pela disponibilidade que teve para me ajudar numa das fases mais importantes do trabalho: a análise dos dados.
Dra. Joana Reis! Chegou a sua vez! Não me vou alongar muito porque sei que és muito chorona e porque também existem poucas palavras para te agradecer por toda a ajuda que já me deste até hoje. Obrigada por me teres ensinado tudo de fisiologia, obrigada por dizeres que estou tão bonita hoje, obrigada por gritares comigo “Oh William
5 não chutes”! És fortíssima! (E relaxa…que a época não acaba sem o Gudelj marcar de fora da área!).
A todos os meus amigos e colegas de mestrado que me acompanharam nesta caminhada, em especial à Sofia Franco e ao André Gonçalves. Ao João Valente, por ser como um irmão, por me apoiar em tudo e sempre. E à Catarina Mendes, por ser uma das pessoas que mais estimo nesta vida, por ser uma referência para mim e por me aturar diariamente com todas as minhas parvoíces e maus humores.
Finalmente, agradeço à minha família! Em especial à minha mãe, ao meu pai e à minha Kikas. Agradeço-vos por aquilo que sou hoje, por nunca me deixarem ir abaixo e por se envolverem neste projeto como se fosse vosso. Espero continuar a ser para vós um motivo de orgulho! Obrigada por tudo!
6
Table of Contents
Figures and Tables ... 8
Abbreviations ... 9 Abstract ... 11 Resumo ... 13 Introduction ... 15 Literature Review ... 17 1. Sedentary behavior ... 17 1.1.Definitions ... 17
1.2.Epidemiology of Sedentary Behavior ... 19
1.3.Observational and Experimental Studies... 21
1.3.1. Observational studies ... 21
1.3.2. Experimental studies... 23
2. Glycemic Control ... 26
2.1.Insulin ... 26
2.1.1. Production and release ... 27
2.2.Glycemic control: the role of insulin and muscle contraction ... 29
2.3.Carbohydrates ... 30
2.3.1. Glycemic response to a meal ... 31
2.4.Breaking-up sedentary time: effects on postprandial glucose ... 33
3. Detraining ... 35
3.1.Overall effects ... 35
3.2.Effects on glycemic control and insulin sensitivity ... 37
4. Thesis Purpose ... 39
Methodology ... 41
7
2. Study Design ... 43
2.1. Intervention protocol ... 45
2.2. Experimental protocol and laboratory conditions ... 46
2.3. Detraining period... 47
3. Baseline and follow – up assessments ... 47
3.1. Anthropometric measures ... 47
3.2. Body composition measurements... 48
3.3. Cardiorespiratory fitness ... 49
4. Objective Measures of Sedentary Time and Physical Activity ... 49
5.1. Oral Glucose Tolerance Test ... 51
6. Continuous Glucose Monitoring ... 52
7. Mixed standard meals ... 52
8. Statistical Analysis ... 53
Results ... 54
Discussion ... 60
Strengths and Limitations ... 68
Conclusions ... 69
Future Work ... 69
Reference List ... 70
Appendix A – Inclusion/Exclusion Questionnaire ... 81
8
Figures and Tables
Figures List
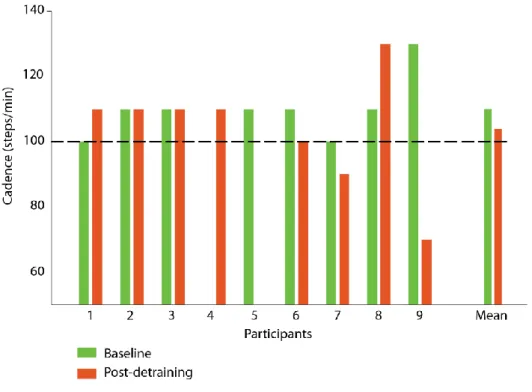
Figure 1 - Participants recruitment ... 42 Figure 2 - Intervention Guide ... 44 Figure 3 - Data from Activpal regarding the intensity of breaks performed during protocols (individual and mean values). 15s epochs were used. The 100 steps/min is the threshold for the moderate intensity PA. ... 56 Figure 4 - Mean glucose profiles (± SD) over 7 hours for each moment (baseline and post-detraining) for both protocols (CON and INT). Standardized meals were consumed at the beginning of the protocol and after 3 hours. The dashed line represents the MG values and shaded area represents the SD. Blue and yellow shades depict the glycaemic response for the CON and INT conditions, respectively. ... 57
Tables List
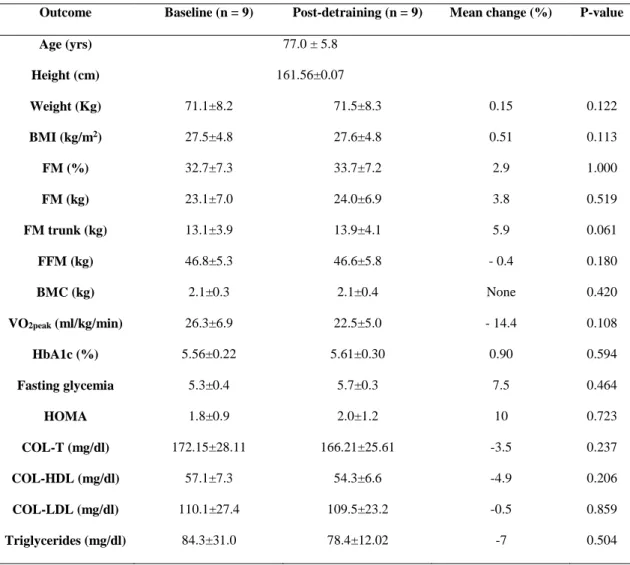
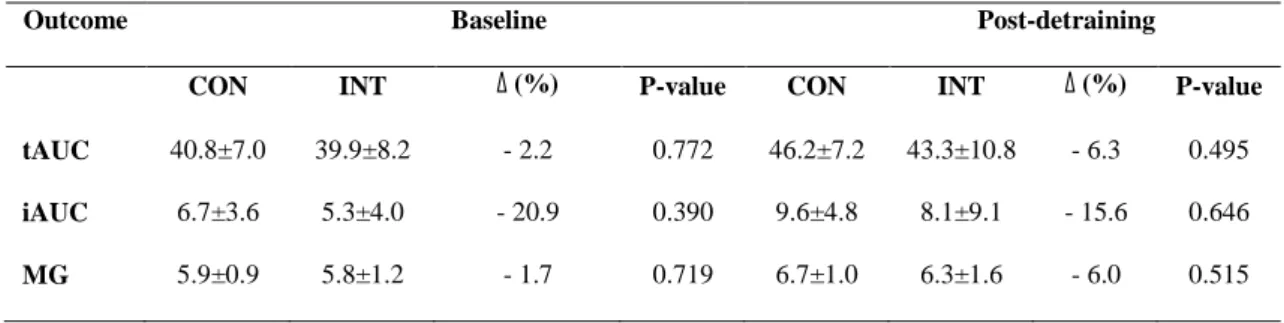
Table 1 - Changes between baseline and post-DT moments regarding demographic variables, body composition, HOMA values, and CRF level. 95% confidence interval. ... 55 Table 2 - Accelerometer data of free-living and DT periods. 95% confidence interval. 55 Table 3 - Baseline and post-detraining postprandial responses for both protocols ... 58 Table 4 - Postprandial responses obtained in both protocols (CON and INT) during baseline and post-detraining. ... 59
9
Abbreviations
ACSM American College of Sports Medicine
Akt Protein kinase B
CG Glycaemic control
CGM Continuous glucose monitoring
CHO Carbohydrates
CON Uninterrupted sitting protocol CRF Cardiorespiratory fitness
DXA Dual-energy x-ray absorptiometry
FM Fat mass
GEE Generalized estimated equations GIP Gastric inhibitory polypeptide GLP-1 Glucagon-like peptide - 1 GLUT4 Glucose transporter 4
HOMA Homeostasis model assessment
HOMA-IR Homeostasis model assessment – insulin resistance iAUC Positive incremental area under the curve
INT Breaking up sitting protocol
MG Mean glucose
MVPA Moderate to vigorous physical activity OGTT Oral glucose tolerance test
PA Physical activity
10
PPG Postprandial glucose
SB Sedentary behavior
ST Sedentary time
tAUC Total area under the curve VO2max Maximal oxygen consumption
11
Abstract
Regularly interrupting sedentary behavior (SB) with activity breaks may attenuate postprandial glucose (PPG) excursions and improve glycemic control.
Purpose: We aimed to determine the effect of interrupting 7 hours of prolonged sitting with brief bouts of moderate physical activity (PA) (alternating between up/down stairs and sit/stand up from the chair) on postprandial glucose (PPG) responses in comparison with uninterrupted sitting. In addition, we aimed to study the effects of 2 weeks of detraining (DT) on PPG on both protocols.
Methods: Non-diabetic, trained older adults (n = 9; 5 males), aged 77.0±5.8 years, were recruited for a randomized crossover trial with two treatments performed in two different training conditions: 1) uninterrupted sitting protocol (CON); 2) seated with 2-minutes bouts of moderate PA every 30 minutes (INT). Both protocols were performed in a trained condition and after 2 weeks of DT. In the early morning of each trial, participants did an oral glucose tolerance test (OGTT) and 2 blood samples were collected (fasting and after 2 hours); 2.5 hours after, participants began the protocol and two standardized meals were provided (0 hours and at 3 hours). An iPro2 continuous glucose monitoring (CGM) system recorded the average interstitial glucose concentration every 5 minutes. Positive incremental area under the curve (iAUC) and total area under the curve (pAUC) for glucose as well as mean glucose (MG) were calculated using Matlab. Differences between both protocols and between the two different moments were examined using generalized estimation equation (GEE), adjusting for sex and age (CI 95%).
Results: No differences were found between CON and INT protocols at baseline (tAUC: 40.8±7.0 mmol/l/h vs. 39.9±8.2 mmol/l/h, ∆ -2.2%, p = 0.772; iAUC: 6.7±3.6 mmol/l/h
12 vs. 5.3±4.0 mmol/l/h, ∆ 20.9%, p = 0.390; MG: 5.9±0.9 mmol/l vs. 5.8±1.2 mmol/l, ∆ -1.7 %, p = 0.719), neither in post-detraining period (tAUC: 46.2±7.2 mmol/l/h vs. 43.3±10.8 mmol/l/h, ∆ -6.3%, p = 0.495; iAUC: 9.6±4.8 mmol/l/h vs. 8.1±9.1 mmol/l/h, ∆ -15.6%, p = 0.646; MG: 6.7±1.0 mmol/l vs. 6.3±1.6 mmol/l, ∆ -6.0%, p = 0.515). Moreover, no differences were found when baseline and post-detraining moments were compared (tAUC: CON, ∆ 13.2%, p = 0.055; INT, ∆ 8.5%, p = 0.401; iAUC: CON, ∆ 43.3%, p = 0.100; INT, ∆ 52.8%, p = 0.343; MG: CON, ∆ 13.6%, p = 0.056; INT, ∆ 8.6%, p = 0.390).
Conclusions: Although considerable percentage differences were observed in glucose responses in the two protocols and in the two moments of evaluation (trained and after 2-week detraining), according to the sample size and after statistical tests brief interruptions of sedentary time (ST) of moderate-intensity PA does not seem to acutely modify PPG response in trained older adults. Also, 2 weeks of DT were not sufficient to promote changes in PPG.
Keywords: sitting time, physical inactivity, breaks, glycemic control, continuous glucose monitoring, older adults
13
Resumo
A interrupção frequente do comportamento sedentário com breves períodos de atividade física pode atenuar os aumentos pós-prandiais da glicémia e melhorar o controlo glicémico.
Objetivo: Investigar os efeitos da interrupção do comportamento sedentário, realizando breves interrupções de 2 minutos de atividade física de intensidade moderada a cada 30 minutos (durante 7 horas), na resposta pós-prandial da glicémia e compará-los com os efeitos da adoção de um padrão contínuo de sedentarismo. Complementarmente, investigou-se também o efeito de 2 semanas de destreino na resposta pós-prandial da glicémia quando ambos os protocolos de sedentarismo foram repetidos.
Métodos: Participaram nesta investigação 9 pessoas idosas saudáveis (5 homens), sem diabetes diagnosticada e treinados, com 77.0±5.8 anos. Foi adotado um modelo randomizado cruzado com dois protocolos: 1) comportamento sedentário contínuo (CON); 2) comportamento sedentário interrompido a cada 30 minutos com atividade física de intensidade moderada (subir/descer escadas e sentar/levantar da cadeira) (INT). Ambos os protocolos foram realizados quando os participantes estavam normalmente treinados e após as 2 semanas de destreino. Na manhã de cada protocolo, foi realizado um teste de tolerância oral à glucose e duas amostras de sangue foram recolhidas (em jejum e após 2 horas). Duas horas e meia depois, iniciou-se o protocolo e duas refeições padrão foram disponibilizadas aos participantes (0h e 3h). Um sistema de monitorização contínuo de glicémia (iPro2) foi utilizado para registar os valores médios de glucose intersticial. A área debaixo da curva incremental, a área debaixo da curva total e o valor médio de glucose sanguínea foram calculados usando o Matlab. Para testar a existência
14 de diferenças entre protocolos e entre os dois momentos, foram utilizadas equações de estimação generalizadas (IC 95%), ajustando-se para o sexo e a idade.
Resultados: Não foram encontradas diferenças entre CON vs. INT quer no período pré-destreino (tAUC: 40.8±7.0 mmol/l/h vs. 39.9±8.2 mmol/l/h, ∆ -2.2%, p = 0.772; iAUC: 6.7±3.6 mmol/l/h vs. 5.3±4.0 mmol/l/h, ∆ -20.9%, p = 0.390; MG: 5.9±0.9 mmol/l vs. 5.8±1.2 mmol/l, ∆ -1.7%, p = 0.719) quer no período pós-destreino (tAUC: 46.2±7.2 mmol/l/h vs. 43.3±10.8 mmol/l/h, ∆ -6.3%, p = 0.495; iAUC: 9.6±4.8 mmol/l/h vs. 8.1±9.1 mmol/l/h, ∆ 15.6%, p = 0.646; MG: 6.7±1.0 mmol/l vs. 6.3±1.6 mmol/l, ∆ -6.0%, p = 0.515). Adicionalmente, não se registaram diferenças quando os períodos pré e pós destreino foram comparados (tAUC: CON, ∆ 13.2%, p = 0.055; INT, ∆ 8.5%, p = 0.401; iAUC: CON, ∆ 43.3%, p = 0.100; INT, ∆ 52.8%, p = 0.343; MG: CON, ∆ 13.6%, p = 0.056; INT, ∆ 13.6%, p = 0.390).
Conclusões: Embora se tenham observado consideráveis diferenças percentuais nas variáveis investigadas nas duas condições experimentais e nos dois momentos de avaliação quando as pessoas estavam treinadas ou sujeitas a um período de 2 semanas de destreino, de acordo com a dimensão da amostra e a aplicação das apropriadas provas estatísticas, a interrupção do comportamento sedentário por breves períodos de atividade física de intensidade moderada parece não alterar, de forma aguda, as respostas pós-prandiais da glicémia em idosos que treinam regularmente. Paralelamente, observou-se que 2 semanas de destreino não foram suficientes para alterar as respostas pós-prandiais da glicémia.
Palavras-chave: tempo sentado, inatividade física, interrupções, controlo glicémico, monitorização contínua da glicémia, idosos
15
Introduction
Technological evolution and increasing industrialization have contributed to humans being gradually replaced by machines in several contexts (e.g. workplace). Therefore, it is no longer necessary to perform physically demanding tasks involving high energy expenditure. In fact, the adoption of a sedentary lifestyle is transversal to all ages, from adolescence to more advanced ages and is associated with several diseases (Patterson et al., 2018; Santos et al., 2018).
In recent years, the issue of sedentarism has gained relevance in the scientific field and several investigations have been carried out, knowing that regardless of levels of physical activity (PA), more time spent in sedentary behavior (SB) and watching TV is associated with a higher risk of developing chronic diseases such as cardiovascular disease, cancer, and type 2 diabetes mellitus (Patterson et al., 2018). Although much of the current knowledge is derived from observational studies, more recently several authors have intensified experimental studies, which has allowed the ability to establish cause-effect relationships between the adoption of a sedentary lifestyle and its consequences for health, as well as the mechanisms that are underlying these relationships.
Most of the experimental findings derived from randomized cross-over trials aim to understand the acute effects of the interruption of SB on glycemic or lipid profile (Benatti & Ried-Larsen, 2015). However, further experimental trials are needed to strengthen the body of evidence by diversifying the samples used and the protocols applied, thereby allowing some of the remaining doubts to be clarified (e.g. ideal frequency of interruptions, intensity and/or duration of the breaks).
16 In Portugal, according to data from 2012, only 36% and 4% of children aged 10-11 years and 16-17 years, respectively, were considered sufficiently active (Baptista et al., 2012). In adulthood, the results show that 70% of adults and only 35% of older adults achieve daily recommendations of PA (Baptista et al., 2012). Based on this, it is well recognized the need to implement strategies that promote an increase in PA levels and consequently a decrease in sedentary pursuits. Therefore, more scientific evidence is needed to reinforce the benefits of a healthy lifestyle and also the hazards associated with low PA levels or temporary reduction in it, as happens, for instance, during the summer vacations.
With this work, we intend to increase the body of evidence related to the SB research field, focusing on two distinct but complementary topics: the benefits of interrupting SB and the potential hazards associated with brief discontinuation of PA on postprandial (PP) responses in older adults who train weekly.
Structurally, this thesis includes a review of the literature that addresses the issue of sedentarism, regarding epidemiological data, assessment methods, observational and experimental data. Then, the glycemic control (GC) issue will be described, namely the mechanisms of insulin production and signaling, the postprandial glucose (PPG) response and how frequent interruptions of SB may influence this metabolic response. Finally, the literature review concludes with a description of the overall effects of detraining (DT) and also its effects on PPG. Subsequently, the methodology, the results and a brief discussion of the results will be presented. Finally, the main conclusions, limitations of the investigation and the future work implications will be outlined.
17
Literature Review
1. Sedentary behavior
1.1.Definitions
SB entails any conscious behavior performed in a sitting or reclining position, in which the energy expenditure is set between 1.0 and 1.5 METS (Pate, O'Neill, & Lobelo, 2008; SBRN, 2012). SB has emerged as a risk factor for several health-related conditions and nowadays it is known that people spend more time in SB – when compared to past generations – mainly due to technological innovations, such as television, computers, video games, and the increased use of the personal car for commuting (Owen, Sparling, Healy, Dunstan, & Matthews, 2010). Therefore, over the past decade, the research carried out in this field has significantly increased, providing observational and experimental evidence of the detrimental effects of spending too much time in sedentary pursuits.
More recently, studies have shown that SB is a much more complex issue since it is more important to consider the way we accumulate our SB throughout the day, rather than the total amount of time spent in such activities. Thus, the concepts of bout of sedentary time (ST), break in ST, and sedentary pattern arose. Generally, while a sedentary bout represents a period of uninterrupted ST, a sedentary break corresponds to a non-sedentary bout in between two sedentary bouts. Sedentary pattern represents the way in which ST is accumulated throughout the day and usually two patterns could be defined: continuous, when someone accumulates ST in extended prolonged bouts and discontinuous when someone accrues ST with frequent interruptions and in short bouts (Tremblay et al., 2017).
18 PA could be defined as any bodily movement produced by skeletal muscle that increases energy expenditure above rest, whereas the term “exercise” represents a subcategory of PA, with a specific plan and structure aimed to achieve a health goal or a performance target (Caspersen, Powell, & Christenson, 1985). Current PA guidelines advocate that adults and older adults must perform at least 150 minutes/week of moderate intensity PA, or 75 minutes/week of vigorous intensity PA or a combination of both recommendations mentioned (WHO, 2010). On the other hand, when an individual does not meet established PA recommendations, he/she is considered inactive, which does not mean that he/she is necessarily sedentary and vice-versa. For a better understanding of the differences between both concepts, it is important to look at the definitions. Considering the aforementioned definitions, it is recognized that SB is part of the same energy expenditure spectrum of PA, whereas physical inactivity refers to non – compliance with PA guidelines (WHO, 2010). Consequently, a person can be physically active and also sedentary, such as a woman who works in an office, seated most of the day, but who performs 1 hour per day (> 150 min/week) of PA after work. However, the opposite is also possible, because someone can be inactive but not be considered sedentary, such as a men who spends the entire day standing and walking at work, but who does not accomplish the ACSM’s PA recommendations.
Thus, SB and inactivity are distinct constructs that must be seen as different health risk factors and particularly from the 1950s, SB has emerged itself as a risk factor for health (van der Ploeg & Hillsdon, 2017). Hamilton and colleagues proposed the “inactivity physiology paradigm” to highlight the discrepancies between these two concepts and to reinforce the importance of studying each one separately (Hamilton, Hamilton, & Zderic, 2004; Hamilton, Healy, Dunstan, Zderic, & Owen, 2008).
19 Undeniably, exercising too little is different from sitting too much and, as such, has its own consequences. A study conducted on rats showed that some genes are more sensitive to PA, whereas other genes and molecular processes are compromised by physical inactivity through mechanisms that are different from those related to exercise (Bey et al., 2003; Hamilton et al., 2008). Currently, physical inactivity is already considered itself as a possible cause for more than 35 chronic diseases. It speeds biological aging and increases the prevalence, from 30 to 50%, of cardiovascular disease, type 2 diabetes mellitus, breast and colon cancer, dementia and depression (Booth, Roberts, Thyfault, Ruegsegger, & Toedebusch, 2017).
The effects of SB on health outcomes seem to be independent of PA levels, which means that a person who spends a lot of time in sedentary activities, even if considered physically active, is not fully protected from the detrimental effects of this behavior, regardless of sex, age, body mass index or energy expenditure (Gonzalez, Fuentes, & Marquez, 2017). If we look at ACSM guidelines, we realize that it only covers 30 minutes a day, that is, about 2.1% of all 24 hours. If we consider that each person usually sleeps 8 hours per night, this means that 15.5 hours remain to be considered (Hamilton et al., 2008). Therefore, it is essential to continue to disclose the importance and the benefits of achieving international PA guidelines, but also to raise the awareness that it might be equally important to reduce ST.
1.2.Epidemiology of Sedentary Behavior
SB has been studied using different methods, which can be categorized into objective and subjective. Among the objective methods, accelerometers (e.g. Actigraph accelerometers), posture monitors (e.g. Activpal), and heart rate monitors combined with movement sensing (e.g. Actiheart) stand out; Diaries and self – reported questionnaires
20 are the most prominent subjective methods (Atkin et al., 2012). Using either a pedometer or an accelerometer physical activity monitoring device, when someone takes <5000 steps/day is considered sedentary, 5000-7499 steps/day is considered low active, and ≥ 7500 steps/day (of which at least 3000 steps/day should be performed at moderate to vigorous physical activity (MVPA)) is considered physically active (Tudor-Locke, Craig, Thyfault, & Spence, 2012). In addition, an activity of < 100 counts per minute measured by the accelerometers is usually used to define SB (Matthews et al., 2008).
Generally, adults and older adults report that they spend about 5 – 6 h/day (Bauman et al., 2011) and > 4 h/day in SB, respectively, when using subjective data (Harvey, Chastin, & Skelton, 2015). However, when objective methods are used, ST recorded tends to be higher, with adults spending about 50-60% of their daily time in sedentary activities (Healy, Matthews, Dunstan, Winkler, & Owen, 2011), while older adults spend almost 70% (Judice, Silva, & Sardinha, 2015). Regarding the Portuguese population, the results show that, when considering youth, about two thirds of the day corresponds to ST; with the transition to adulthood, it should be noted that men and women show different trends: relative to children, women decrease their ST while men show an increase; however, with aging the ST increases in both sexes (Baptista et al., 2012). Recent data have strengthened the results published in 2012, showing that in Portugal, ST represents 57.7%, 60.2% and 65.2% of wear time for boys, adult men, and older men, respectively. In girls, adult females, and older women, 61.1%, 56.5% and 63.8% of their wear time is spent in sedentary pursuits, respectively (Santos et al., 2018). This study has shown that adult females spent more time in light intensity and moderate to vigorous activities in comparison with girls, which does not happen with males who decrease their PA levels throughout their lifetime (Santos et al., 2018).
21 1.3.Observational and Experimental Studies
1.3.1. Observational studies
Observational data published in the last two decades suggest that time spent in SB is associated with all-cause mortality, and several non-communicable diseases, including cardiovascular disease (Sattelmair et al., 2011), diabetes (Avery, Flynn, van Wersch, Sniehotta, & Trenell, 2012), cognitive function and several types of cancer (Shen et al., 2014). For instance, a study conducted in 33,723 women found that watching TV for more than 5 hours per day (vs. < 5 hours/day) was associated with an increased risk for endometrial cancer (Friberg, Mantzoros, & Wolk, 2006). Using a similar approach, Patel et al. (Patel, Rodriguez, Pavluck, Thun, & Calle, 2006) observed that women who spent more than 6 hours per day on TV viewing had 55% greater risk for developing ovarian cancer in comparison with those who spent less than 3 hours/day. More recently, Cong et al. (Cong et al., 2014), observed that the risk of colon cancer was 30% higher among sedentary people, independently of PA levels based on 23 observational studies (longitudinal and case-control).
In line with several prospective studies, meta-analysis, and reviews of prospective cohorts, it might be stated that the longer the time spent in SB, the greater the risk for all-cause and cardiovascular mortality (de Rezende, Rey-Lopez, Matsudo, & do Carmo Luiz, 2014; Patterson et al., 2018; Thorp, Owen, Neuhaus, & Dunstan, 2011). In 2010, an Australian research group showed that for each hour a day spent watching TV was associated with an increased odds of 11% and 18% for all-cause mortality and for cardiovascular disease, respectively (Dunstan et al., 2010). Moreover, the same study compared people who watch TV ≥ 4 hours/day vs. < 2 hours/day and concluded that those who accumulated more TV time had 46% and 80% higher risk for all-cause mortality and
22 cardiovascular disease, respectively (Dunstan et al., 2010). A recent meta-analysis, while using a dose-response approach, aimed to establish a relationship between ST and TV-viewing with different health-related outcomes (all-cause mortality, cardiovascular mortality and type 2 diabetes mellitus incidence), based on adjusted and non-adjusted models for PA (Patterson et al., 2018). The results suggest that more than 6 – 8 hours/day in ST and more than 3 – 4 hours/day watching TV are the thresholds for which the risk for all-cause mortality and cardiovascular mortality increase significantly (Patterson et al., 2018). As far as older adults are concerned, a longitudinal study in older men underpinned the associations between mortality and ST and reported that 30-minute increments in ST increase the risk of all-cause mortality by 15% (Jefferis et al., 2018).
Regarding the diabetes, it is known that increasing TV viewing by 2 hours a day is associated with a 20% increased risk for developing type 2 diabetes, even when adjusting for nutritional aspects (Grontved & Hu, 2011). In other health-related outcomes, ST has been detrimentally associated with waist circumference, fasting triglycerides, HDL – cholesterol, and C – reactive protein (Healy et al., 2011). These results are in agreement with the Maastricht based study, which reported that an extra hour of ST was associated with a 39% increased risk for metabolic syndrome (van der Berg et al., 2016). As far as the SB patterns are concerned, for each 1-hour increment in sedentary bouts (duration of 10 to 20 minutes), there is a 48% increased risk for being abdominally obese (Judice et al., 2015). However, for every additional hourly break in ST, the odds of having abdominal obesity decrease by 7% (Júdice, Silva, Santos, Baptista, & Sardinha, 2015). Also, in older adults, interrupting ST more frequently improves physical function in older adults, regardless of total ST, MVPA, and other potential confounders (Sardinha, Santos, Silva, Baptista, & Owen, 2015).
23 1.3.2. Experimental studies
Beyond the above-mentioned observational studies, several experimental trials have been carried out to support the idea that reducing ST is paramount. However, there are some conflicting results given that some studies concluded that a decrease in ST promotes significant improvements in health biomarkers, whereas some findings did not support this relationship.
Significant improvements were reported for glycemic and insulinemic responses in 19 physically inactive nondiabetic overweight and obese individuals when prolonged sitting was briefly interrupted with light- and moderate-intensity walking every 20 minutes, without any differences between both walking protocols. These authors documented that breaking up sitting time lowers insulin iAUC by 23% and plasma glucose iAUC by 24% (Dunstan et al., 2012). In a secondary analysis using the same sample, it was reported that uninterrupted sitting has pro-coagulant effects, since it promotes increases in fibrinogen, plasma volume, hemoglobin as well as in hematocrit values. These deleterious effects were counteracted when ST was actively interrupted (Howard et al., 2013).
Moreover, the beneficial effects of sitting less and frequently breaking up this behavior were also observed in diabetic patients (Dempsey, Owen, Yates, Kingwell, & Dunstan, 2016). When SB was interrupted with brief bouts of light-intensity walking or simple resistance activities (e.g. half-squats), glucose and insulin iAUC were attenuated by 39% and 36-37%, respectively (Dempsey, Larsen, et al., 2016). Interestingly, the benefits acquired throughout the day might persist through the night period until the next morning (Dempsey et al., 2017).
24 Although other studies have had similar findings to those described above (Fletcher et al., 2018; McCarthy, Edwardson, & Davies, 2017a; Peddie et al., 2013; Thorp et al., 2014), some investigations did not document the same results (Blankenship, Granados, & Braun, 2014; Hansen, Andersen, Vinther, Pielmeier, & Larsen, 2016). For instance, frequently interrupting sitting with 2 minutes of light-intensity walking (i.e. every 20 minutes) in 14 healthy, normal weight adults assigned to 2.5 hours of prolonged sitting, resulted in no significant improvements in glucose iAUC when compared to the uninterrupted sitting protocol (Hansen et al., 2016). Possibly, the conflicting results might be due to the different protocols that were applied and to the different samples used.
Besides that, the optimal intensity of breaks remains unclear. For instance, a significant 11% reduction in iAUC was found when prolonged periods of sitting were interchanged with standing breaks every 30 minutes (Thorp et al., 2014). In contrast, Bailey and colleagues (Bailey & Locke, 2015) compared the effects of prolonged sitting, sitting plus standing interruptions (2 minutes each half hour) and sitting plus light-intensity walking interruptions (2 minutes each half hour) on PPG in 10 healthy non-obese adults and significant changes were reported only for the walking breaks. On the other hand, when sitting was interrupted with the same frequency and intensity in a sample of healthy young people, neither low-intensity breaks nor those that were moderate had any impact on PP responses (Saunders et al., 2013). As suggested in a review of experimental studies, these findings probably indicate that sedentary individuals can benefit from breaks of standing or low intensity, while more active and healthy people need to interrupt SB with higher intensity breaks (Benatti & Ried-Larsen, 2015).
25 In a hybrid trial (face to face and online intervention) to reduce SB, it was reported by the participants that they increased their PA levels and decreased their SB which resulted in a reduction of waist circumference, a risk factor for several diseases such as type 2 diabetes (Adams, Davis, & Gill, 2013).
In an elegantly designed randomized crossover trial, Duvivier et al. (Duvivier et al., 2013) aimed to examine the effects of excessive sitting on circulating lipids, while using three distinct conditions (4 days each): 1) sitting regime (participants were instructed to sit 14 hours/day); 2) exercise regime (researchers asked the participants to replace 1 hour of sitting by 1 hour of vigorous supervised cycling, totaling 13 hours/day sitting); 3) minimal intensity PA (participants should replace 6 hours of sitting with 4 hours of walking and with 2 hours of standing, with a total of 8 hours/day of sitting). The increased energy expenditure was assured between the second and third conditions vs. the first regime. The results suggest that tAUC for triglycerides (22%), non – HDL cholesterol (10%) and apo B concentrations (8%) were significantly lower after the minimal intensity PA when compared with sitting. Additionally, the exercise condition had no effect on the health-related outcomes, when compared with the sitting regime. Thus, it seems to be an effective strategy to replace sedentary activity with walking/standing, rather than replacing it for just one hour per day of exercise (Duvivier et al., 2013).
Using a different approach, MacEwen et al. (MacEwen, Saunders, MacDonald, & Burr, 2017) used a 12-week randomized controlled trial to analyze the impact of standing desks on several outcomes. The participants were divided into 2 groups: 1) stand desk group; 2) seated desk group. As expected, the experimental group (1) decreased their total daily time and work daily time spent in SB. However, this behavioral change did not
26 correspond to improvements in health biomarkers such as blood pressure, triglycerides, cholesterol, fasting glucose, HbA1c or vascular health (MacEwen et al., 2017). With a similar protocol, while also using standing desks to reduce time in the sitting position, Graves et al., (E. F. Graves, C. Murphy, Shepherd, Cabot, & Hopkins, 2015) observed that the standing desk strategy was a feasible option to reduce ST, without posing discomfort or pain to the participants. However, they also found no significant improvements in cholesterol, endothelial function and diastolic blood pressure (E. F. Graves et al., 2015).
2. Glycemic Control
2.1.Insulin
In 1889, Minkowski and van Mering recognized the existence of a substance that when released by the pancreas was responsible for the homeostasis control of several systems, including the GC (Bliss, 1993). Three decades later, this molecule was finally isolated which allowed a more detailed study and, for the first time, it was named “insulin”. It was not until 1922, that the first study related to insulin action was carried out in humans (Wilcox, 2005). Insulin is an anabolic peptide hormone that is released by the beta cells located in the pancreatic islets of Langerhans (Qaid & Abdelrahman, 2016). In addition to being essential in glucose homeostasis, insulin also plays a role in the lipid and protein metabolism, since it increases lipogenesis, suppresses lipolysis and promotes the uptake and incorporation of amino acids into protein, while inhibiting its degradation (Qaid & Abdelrahman, 2016; Wilcox, 2005). This hormone has mitogenic effects contributing to cell division and growth (Wilcox, 2005), prevents apoptosis and protects cells from oxidative stress (Marshall, 2006). Below, the mechanisms of synthesis, release, and action of insulin will be further explained.
27 2.1.1. Production and release
Insulin release assumes a biphasic nature and a pulsatile fashion subdivided into two distinct phases. The first phase is characterized by a marked increase in insulin release, which was already stored in secretory granules (reaches the peak in 3-5 minutes and lasts for almost 10 minutes). The second phase is slower and sustained and reflects the release of both stored insulin remaining in the granules and newly synthesized insulin (Moore, Cherrington, & Wasserman, 2003; Wilcox, 2005). Insulin secretion can be regulated by 2 different pathways: nutrient and non-nutrient secretagogues (Wilcox, 2005). These two physiological mechanisms are described below.
Nutrient secretagogues
Proinsulin is synthesized in the ribosomes on the rough endoplasmic reticulum and is then carried to the Golgi apparatus, where it undergoes maturation processes into insulin and C – peptide. Afterward, this hormone will be released through exocytose through a glucose-dependent manner. Indeed, glucose is the main responsible factor for the first phase of insulin secretion, as this macromolecule enters the pancreatic beta cells and starts a series of metabolic cascades. First, the glucose is sensed and phosphorylated by glucokinase into glucose-6-phosphate, which in turn through the Krebs cycle generates ATP. The production of ATP promotes closure of the K+ATP channels and a consequent cellular membrane depolarization that culminates with the opening of the calcium channels. Therefore, there is an increase in intracellular calcium that triggers exocytosis of protein complexes where insulin is stored and, consequently, induces the pulsatile secretion of this hormone (Tokarz, MacDonald, & Klip, 2018; Wilcox, 2005).
Fatty acids also control insulin secretion through a mechanism similar to glucose. In a fasting state, the fatty acids are converted into acyl-CoA and undergo beta-oxidation
28 within the mitochondria which help to maintain insulin secretion levels. However, when a carbohydrate-containing meal is consumed, fat oxidation is inhibited and the transport of acyl-CoA to the mitochondria is blocked, thus its cytosol levels increase which leads to an increment of intracellular calcium concentration that stimulates insulin exocytosis (Newsholme & Krause, 2012). Finally, it is important to emphasize that the proteins, namely amino acids, also seem to influence glucose-stimulated insulin secretion, in a similar way to mechanisms already described above, which involve depolarization of the cellular membrane by increasing the intracellular calcium levels. Among the different amino acids, arginine, L-glutamine, intracellular L-glutamate and L-alanine are the most prominent (Newsholme & Krause, 2012).
Non-nutrient secretagogues
The non-nutrient secretagogues pathways may act via neural stimuli, through cholinergic (regulation of the cephalic phase of insulin production that occurs when food is smelled, seen or acutely ingested) and adrenergic transmissions (Wilcox, 2005). Regarding cholinergic mechanisms, it is relevant to highlight the importance of acetylcholine, an important neurotransmitter that plays a crucial role in the activation of muscarinic receptors that are recognized for its relevance in metabolic functions, namely in the regulation of B-cells activity (Molina et al., 2014). In its turn, adrenergic transmissions are related to alfa and beta-receptors that inhibit and enhance insulin release, respectively (Porte, 1967; Wilcox, 2005).
Additionally, non-nutrient secretagogues also encompasses peptide hormones that are implicated in insulin release such as glucagon-like peptide-1 (GLP-1) and gastric inhibitory polypeptide (GIP). These incretins are secreted by the intestine upon ingestion of glucose and act on the pancreas promoting beta-cell proliferation and insulin secretion
29 (Yabe & Seino, 2011). In contrast, somatostatin and adrenocorticosteroids are responsible for decreasing insulin levels (Wilcox, 2005).
2.2.Glycemic control: the role of insulin and muscle contraction
Insulin, as a hormone, acts in different tissues and organs such as muscle, adipose tissue, liver, brain, endothelium, pancreas, pituitary gland, kidney, gonads, and bone (Wilcox, 2005). However, for the purpose of this thesis, it is important to clarify the role of insulin in the liver but mainly in muscle. In the hepatic organ, insulin inhibits glucose output (gluconeogenesis) by activating protein kinase B (Akt) (Czech, 2017), whereas in the muscle it regulates the metabolism of carbohydrates (CHO) by promoting the absorption of glucose, that is, enhances entry of glucose into cells and increases the storage of glucose as glycogen, thereby lowering blood glucose levels (Qaid & Abdelrahman, 2016; Wilcox, 2005). For this purpose, insulin binds to its receptor on cell membranes and activates insulin – signaling cascade to PI3K (phosphoinositide 3-kinases) and Akt that promotes the remodeling of actin cytoskeleton (a structure that is essential for maintaining the shape of cells) and triggers the traffic of vesicles that store GLUT – 4, respectively. Taken together, these actions will culminate in the translocation of GLUT – 4 from intracellular pools to the cell surface (Tokarz et al., 2018). Once coupled to the cell membrane, GLUT – 4 provides the entry of the glucose into the cells to be used for energy production or for energy storage. For this reason, GLUT-4 is considered the main glucose transporter and a key determinant of its homeostasis (Huang & Czech, 2007).
In addition to insulin-dependent glucose uptake, it is also important to highlight that glucose control can also be mediated by muscle contraction and in an independent – insulin manner. During dynamic exercise, skeletal muscle glucose uptake can increase as
30 much 50-fold. Local factors such as calcium concentration, calcium calmodulin-dependent protein kinase, reactive oxygen species, nitric oxide and AMP-activated protein kinase (AMPK) are involved in this process. These mechanisms are related to each other and through various enzymatic reactions favor the translocation of GLUT-4 to the membrane independent of insulin action, leading to glucose uptake (Merry & McConell, 2009). Moreover, muscle contraction is also involved in actin cytoskeleton adaptation that is crucial for glucose uptake (Tokarz et al., 2018).
2.3.Carbohydrates
Through food, we obtain the necessary nutrients for vital functions and daily life activities, of which, we highlight macromolecules such as CHO, lipids, and proteins. Commonly referred as sugars, CHO represent the main source of energy for humans and are classified as monosaccharides, disaccharides or polysaccharides. We will focus on glucose, which is the most known molecule responsible for providing energy for the human body since it can be used directly by cells. Glucose, also plays an important role on energy storage and temperature regulation, for instance, it can be stored as glycogen in liver and muscles, like free-fatty acids in adipose tissue, or even provide carbon skeletons to synthesize non-essential amino acids (Katch, McArdle, & Katch, 2011). For these several reasons, it is desirable that glucose is available in optimal concentrations for cells and that the production mechanisms of this molecule are properly coordinated. Generally, glucose can be obtained in two distinct pathways, either exogenous or endogenous. The first is related to glucose obtained through feeding, particularly with foods that have high levels of CHO. The endogenous pathway comprises metabolic processes including glycogenolysis that involves lysis of muscle and hepatic glycogen transforming it into glucose; and gluconeogenesis which refers to the process of “new”
31 glucose synthesis trough non-glucose sources, mainly by amino acids (carbon skeletons) (Schutz, 2011).
2.3.1. Glycemic response to a meal
Glucose homeostasis reflects the balance between the rate of glucose appearance (glucose that enters in circulation) and the rate of glucose disappearance (glucose that leaves circulation), and achieving this balance varies depending on whether the person is in fasting or in feeding condition (Ang & Linn, 2014). When considering a fasting condition, the glucose that is circulating is dependent on the one produced by the liver through glycogenolysis. However, in the feeding condition, the liver mainly promotes glucose uptake and storage (instead of glucose release), whereas the blood glucose relies mainly on the absorption process (Ang & Linn, 2014).
The term PP means after the meal, hence, PPG reflects the response of blood glucose levels to a given meal. In non-diabetic individuals, PPG levels reach its peak about 60 minutes after the meal, where it rarely exceeds 140 mg/dl and then returns to pre-prandial values within 2-3 hours. This process occurs despite the continuous absorption of CHO that lasts 5 to 6 hours after the food intake (ADA, 2001). However, when PPG surpasses 140 mg/dl, the individual is considered to be in PP hyperglycemia and/or at risk of developing type 2 diabetes mellitus. PP hyperglycemia coincides with an impairment of the first-phase insulin response, a decrease in peripheral insulin sensitivity and an increase in hepatic glucose output after meals due to insulin deficiency (Maffettone, Rinaldi, & Fontanella, 2018).
As aforementioned, these physiological changes during the PP period are influenced by CHO absorption, and it is known that the consumption of complex CHO
32 attenuates glycemic responses, inhibits endogenous glucose production and increases splanchnic glucose uptake (Ang & Linn, 2014; Crapo, Reaven, & Olefsky, 1977). Nevertheless, other several aspects regulate PPG such as glucagon and insulin secretion and the combined effects of these two hormones on hepatic and peripheral metabolism, as well as the quantity and quality of the food ingested, namely the nutritional composition (ADA, 2001; Reaven, 1979; Rozendaal et al., 2018). For instance, when analyzing the PP responses to three different isocaloric nutritional meals, Klaauw et al. (van der Klaauw et al., 2013) observed that the meal with the highest percentage of CHO, was responsible for a superior increase in insulin response when compared to those with a lower percentage of CHO. On the other hand, the meal that included the highest percentage of protein had the highest values of GLP – 1.
Another important factor to consider when addressing the glycemic response is the time of the day that the meal is consumed. Indeed, there are differences in PPG response between breakfast, where people are usually in fasting condition, and lunch or dinner (Jarrett, Baker, Keen, & Oakley, 1972). For instance, breakfast is characterized by a less pronounced PPG response, when compared with meals throughout the rest of the day. In fact, the literature suggests that the PPG response in the evening could be at least fivefold larger than those in the morning (Van Cauter, Shapiro, Tillil, & Polonsky, 1992). Some of the physiological mechanisms that may explain this differentiated response are related to higher beta cells responsiveness (about 20% higher vs. lunch and dinner taken together), the disposition index (insulin sensitivity x insulin secreted), insulin action, as well as a lower hepatic insulin extraction observed at breakfast (Saad et al., 2012). Another possible explanation lies on the circadian rhythms, which are physiological and behavioral cycles with 24 hours, generated by the suprachiasmatic nucleus located in the
33 anterior hypothalamus (Zee, Attarian, & Videnovic, 2013). The circadian rhythms are synchronized with earth’s rotation and are influenced by changes in light, temperature, and weather during the day. These rhythms exert influence on body temperature, feeding, hormone secretion, glucose homeostasis and cell-cycle regulation (Zee et al., 2013). For instance, it is observed that the release of incretins such as GLP – 1 and GIP seems to be regulated by a biological clock, since they present a diurnal pattern in which there is a more pronounced release of these hormones during the morning period (Lindgren et al., 2009). In addition, it is known that during the morning there are less insulin resistance levels (Morgan, Shi, Hampton, & Frost, 2012) accompanied by an increase of insulin-dependent transporter GLUT-4 expression in skeletal muscle (Basse et al., 2018).
2.4.Breaking-up sedentary time: effects on postprandial glucose
Although the physiological mechanisms that explain the improvement in GC from breaking up ST have not been widely studied and described, it is assumed that GLUT-4 translocation mediated by muscle contraction during the breaks explains, in part, the benefits that derive from it. In fact, breaking up ST with short periods of PA seems to induce some metabolic effects on the muscle that mediate the movement of GLUT-4 to the cell surface through the mechanics already mentioned (Bergouignan et al., 2016). Moreover, these interruptions contribute to the activation of glycogen synthase that promotes glucose storage. PGC-1α may be another key element in this process. Through muscle contraction performed during the breaks, the expression of this protein increases and mitochondrial biogenesis is promoted, which results not only in an increase in cellular respiration and consequent glucose oxidation but also in stimulation of GLUT-4 migration (Bergouignan et al., 2016; Ojuka et al., 2002)
34 The energy expenditure resulting from the breaks may also explain its physiological benefits. Judice et al. tried to characterize the energetic cost of frequent sit to stand movement and determined that one single transition increases the metabolic rate approximately 35% above the sitting position, which represents 0.32 kcal for each transition (Judice, Hamilton, Sardinha, Zderic, & Silva, 2016). A recent study conducted on physically inactive adults reported that breaking up SB every 20 minutes with 30 seconds of squats increased energy expenditure by 16.6%, and promoted an increase of 33.9% total CHO oxidation in comparison with prolonged sitting (N. S. A. Hawari, Wilson, & Gill, 2018).
Remarkably, another mechanism that could explain the effects of breaks is the expression of some genes. Indeed, the interruption of SB could modify some gene expression. For instance, PDK4 (a gene involved in glucose metabolism regulation) and USP6 (gene that plays an important role in protein degradation and muscle atrophy) genes had an increase and decrease in their expression, respectively, following an intervention aimed at reducing SB through breaks (Latouche et al., 2013).
Feasible strategies for reducing and interrupting SB in everyday life include alterations in the type of transport used and the reorganization of leisure time at home and time spent in the seated position in occupational health. The reduction of SB and frequent interruptions in this behavior must be considered as behavioral strategies that are as important as fulfilling PA guidelines. This new paradigm in the SB determines an important health impact with benefits in various dimensions.
35
3. Detraining
3.1.Overall effects
DT should be understood as a partial or complete loss of anatomical, physiological or performance training. DT induces adaptations as a consequence of a reduction or cessation of the training stimulus (Mujika & Padilla, 2000a). This concept is similar to the principle of reversibility, which advocates that the interruption of an exercise stimulus promotes a reversal in all physiological adaptations (Zaryski & Smith, 2005). Obviously, loss of adaptations may occur more or less markedly depending on the duration of the reduction of the stimulus and thus, two different types of DT are considered: short-term and long-term. Generally, short-term DT is used to define periods of stimulus interruption of less than or equal to 4 weeks, while long-term characterizes periods longer than 4 weeks (Mujika & Padilla, 2000a). However, these cut-off values are not consensual, and other authors use different durations to distinguish short and long-term DT (Toraman, 2005).
DT has repercussions on physical fitness, influencing body composition, cardiorespiratory health and muscle strength (Dos Santos, Cyrino, Antunes, Santos, & Sardinha, 2016; Tokmakidis et al., 2014). Also, metabolic health may be affected, which could lead to a less healthy lipid profile (Nikseresht, Hafezi Ahmadi, & Hedayati, 2016) and an impaired GC (McGlory et al., 2018).
With regard to maximal oxygen consumption (VO2max), the findings are not
consensual, such that some studies showed that a reduction/cessation of training does not significantly change the VO2max (Bruseghini et al., 2015; Ratel et al., 2012), while other
36 (Bocalini, Carvalho, de Sousa, Levy, & Tucci, 2010; Krogh-Madsen et al., 2010). The magnitude of these changes may vary between 4 – 14% (Mujika & Padilla, 2000a) and a reduction in PA levels during 2 weeks induces a 7.2% and 6.6% decline in VO2max, in
ml/min and ml/kg/min, respectively (Krogh-Madsen et al., 2010). In addition, DT periods also have an influence on systolic volume (reduction of 10% - 17%, in 12 – 21 days), blood volume, red blood cells and cardiac output (8% in 21 days) (Mujika & Padilla, 2000b).
Besides the reduction in cardiorespiratory fitness (CRF), there are also decreases in muscle endurance, mainly due to 3 aspects: decreased oxidative enzyme activity, decreased muscle glycogen storage and disturbance of acid-base balance (Kenney, Wilmore, & Costill, 2012). Regarding muscle strength, once again, the investigations are not consensual, and while some validate the idea that DT/reduction of PA levels has deleterious effects, others studies have failed to achieve significant results. However, the majority of the literature seems to point to a reduction in muscle mass and strength values, especially through a decrease in the size of muscle fibers and the lower efficiency of motor recruitment. Bed rest studies showed that the disuse or lack of mechanical load promoted a marked decrease in muscle mass due to 1) reduction of PP and post-absorptive protein synthesis; and 2) an increase in insulin resistance, which in this way inhibits the expression of Akt, which in turn increases the expression of Forkhead box protein 1 (FOXO1), leading to increased proteolytic activity that contributes to muscle atrophy (Rudrappa et al., 2016).
It is established that reducing PA levels, with or without an increase in energy intake, yields a positive energy balance that explains a greater ectopic fat accumulation (Tchernof & Despres, 2013). In addition, physical inactivity attenuates the oxidation of
37 triglycerides and competes for the lipoprotein lipase downregulation (Bey et al., 2003) contributing to a lower uptake of triacylglycerols; concurrently, a drop of the enzymatic and mitochondrial content is observed and therefore, it is not surprising that fat oxidation is diminished (Granata & Jamnick, 2018). Hence, according to the period of stimulus cessation, one might state that the DT or PA reduction may compromise body composition (LaForgia et al., 1999; Theodorou et al., 2016). In this context, depending on the follow-up period (varying from a few weeks to a few months of DT) studies have been shown to have different results. Nonetheless, research suggest that the cessation of the training stimulus increases total body total fat mass (FM), % FM, regional FM, and decreases total and regional fat-free mass, mainly the leg lean mass (Breen et al., 2013). Declines in total body water, extracellular and intracellular fluids, and phase angle values have also been observed (Dos Santos et al., 2016).
3.2.Effects on glycemic control and insulin sensitivity
Skeletal muscle is responsible for more than 85% of total glucose uptake (DeFronzo, Ferrannini, Sato, Felig, & Wahren, 1981), therefore, it is expected that the reduction of physical levels or DT, that was previously mentioned, contributes to muscle atrophy, and promotes deleterious effects on the GC. In short, the decline in training stimulus increases fasting and PPG levels, plasma insulin levels, glucose AUC and insulin AUC (McGlory et al., 2018). Partly, these consequences may be due to a decrease in insulin sensitivity, which may be reduced by almost 41% with only 7 days of inactivity (Gill et al., 2003). Recently, a study conducted in overweight, prediabetic older adults who were asked to significantly diminish the number of daily steps for 2 weeks reported increases in HOMA-IR (23%) and decreases in Matsuda index (35%), suggesting an increment in insulin resistance levels (McGlory et al., 2018).
38 Several reasons may explain the changes observed in insulin-signaling, such as alterations in body composition, in CRF, and also in enzymatic content. As already mentioned, with the disuse derived from an inactivity status, a reduction in muscle mass is observed, that can often be accompanied by an increase in fat accumulation. Some data reported that 10-28 days of muscle disuse lead to 4-10% losses in lean mass and to 30-50% decreases in PP myofibrillar protein synthesis (Breen et al., 2013; Kortebein, Ferrando, Lombeida, Wolfe, & Evans, 2007; Suetta et al., 2009). Thus, the ideal conditions for muscle atrophy are established and it is recognized that, especially in older populations, the main fibers affected are type 1, known as slow-oxidative and with high Glut-4 content (Gaster, Staehr, Beck-Nielsen, Schroder, & Handberg, 2001; Herbison, Jaweed, & Ditunno, 1982). Concomitantly, increases in FM, especially intra-muscular fat, are also observed with DT. These increases in FM are responsible for the release of pro-inflammatory cytokines such as interleukin-6 and tumor necrosis factor (TNF-α), which have been shown to promote an increase in chronic systemic inflammation, interfering with the cellular insulin receptors, thus leading to insulin resistance (Ye, 2013). This alteration in the signaling mechanism may be due to the accumulation of intramuscular lipids, which have a significant impact on insulin sensitivity resulting in compromised glucose uptake and GC, particularly when they present high level of toxicity (e.g. diacylglycerol and ceramides) (Itani, Ruderman, Schmieder, & Boden, 2002; Morino, Petersen, & Shulman, 2006).
Concurrently, it is also known that the reduction of VO2max observed with the
decrease in PA, which was already described above, is also a key element in GC. A study conducted on 34 adults found that each unit (ml/kg/min) increment in CRF was associated with significant reductions of about 0.21 mmol/L in glucose AUC (p = 0.013) (McCarthy,
39 Edwardson, Davies, et al., 2017). On the other hand, when CRF is decreased, it is expected that glucose AUC values are augmented (Sui et al., 2012). Indeed, DT might induce a smaller capacity of mitochondrial ATP production and an overall lower mitochondrial enzymatic activity, leading to a diminution of the mitochondrial volume and jeopardized cellular respiration (Wibom et al., 1992). With decreased cellular respiration correct glucose metabolism may not occur, hence impairing GC making it less efficient, with possible negative implications on the PPG. Besides that, enzymatic content fluctuations also contribute to GC impairment, namely reduction in the Akt (Krogh-Madsen et al., 2010) and citrate synthase levels (Wibom et al., 1992).
4. Thesis Purpose
Although the literature on SB has been increasing over the past decades, there are still a number of questions that remain unanswered. Thus, it is necessary to increase the number of experimental studies comparing prolonged sedentary conditions with situations where this behavior is interrupted with the standing position, while using frequent breaks of PA (of different intensities), or with a single bout of exercise. Given that the majority of studies conducted so far have been carried out in the adult population whom were mostly sedentary or with some pathology (for example type 2 diabetes mellitus) (Benatti & Ried-Larsen, 2015), it seems appropriate to extend these experimental designs to an active elderly population, given the fact that the literature in this specific group is still scarce.
Several studies were conducted to understand the effects of DT periods on physical fitness (CRF, muscle strength, body composition) (Dos Santos et al., 2016; Sakugawa et al., 2019; Tokmakidis et al., 2014), on metabolic variables (lipid profile, insulin action, glucose homeostasis) (McGlory et al., 2018), or on physical function,
40 especially in older adults (Esain, Gil, Bidaurrazaga-Letona, & Rodriguez-Larrad, 2018; Kalapotharakos, Diamantopoulos, & Tokmakidis, 2010). However, to the best of our knowledge, no study has yet analyzed the effects of a DT period on the response to two distinct protocols: uninterrupted ST and breaking up ST. More specifically, whether the transition from a trained condition to a detrained state affects the responses of GC outcomes on either uninterrupted or breaks in SB.
Therefore, we examined the acute effects of prolonged sitting on PPG (iAUC, tAUC, and MG) compared with interrupted sitting with 2 minutes of PA (alternating between up/down stairs and sit/stand up from the chair) every 30 minutes in a sample of healthy trained older adults. In addition, we also aimed to study the effects of 2 weeks of DT on PP iAUC, tAUC and mean glucose (MG) on both protocols. We hypothesized that PPG values would be improved by short interruptions on SB, while using PA bouts, in both trained and detrained states. Moreover, the DT period would also impair PPG values and exacerbate the differences between the two study protocols.
41
Methodology
1. Recruitment Process
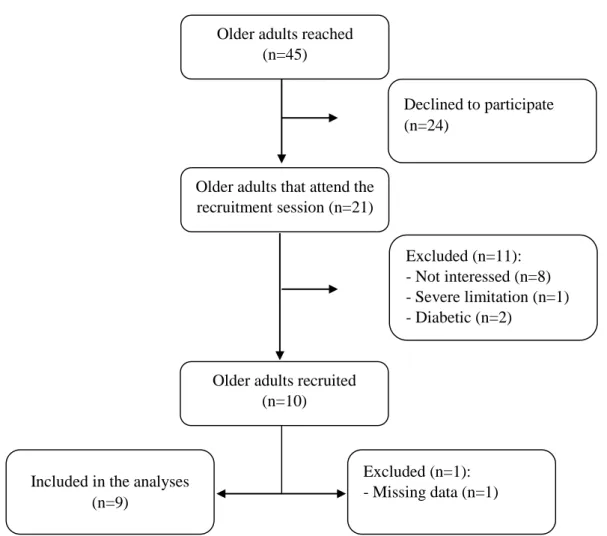
Participants were recruited to take part in an intervention study for older adults. Media advertisements and attendance to local exercise classes were used to recruit the participants within the region of Oeiras – Portugal. Interested participants carried out the enrolment process (Figure 1), starting with a recruitment session, where an explanation of the intervention was provided. In this presentation, participants had access to the following information: the aim of the study, details of the intervention in which they would engage, and requirements to be part of the study in terms of schedule and time availability. At the end of the presentation participants filled in a questionnaire to ascertain who met the inclusion criterion. Written informed consents were obtained from all participants prior to any protocol-specific procedures. This study was approved by the Ethics Committee of the Faculty of Human Kinetics and conducted in accordance with the Declaration of Helsinki an also with Convention on Human Rights and Biomedicine.
In order to be a part of this intervention, the participants had to be men or women aged between 65 and 90 years-old, physically active, and engaged in structured exercise at least twice a week for the past 6 months. People who had type 2 diabetes or any type of severe limitation that would prevent them from practicing exercise were excluded. Power and sample size calculations (G*Power 3.1.9.2) were based on an effect size of 0.78 for the glucose iAUC, while using the t-test for paired samples (two-tailed), a power of 0.80, and a significance of 0.05 (N. S. Hawari, Al-Shayji, Wilson, & Gill, 2016). The calculation yielded a sample size of 15 participants while expecting a dropout rate of 10%. For the present intervention, a total of 9 participants were recruited and enrolled (Figure 1).
42 Older adults reached
(n=45)
Older adults that attend the recruitment session (n=21)
Declined to participate (n=24)
Older adults recruited (n=10) Excluded (n=11): - Not interessed (n=8) - Severe limitation (n=1) - Diabetic (n=2) Excluded (n=1): - Missing data (n=1) Included in the analyses
(n=9)
43
2. Study Design
Participants were followed in a randomized crossover trial undertaken at Faculdade de Motricidade Humana. The trial consisted of two experimental protocols separated by 15 days of DT period, in which participants were instructed to avoid any forms of structured exercise. In each of these experimental protocols, a crossover design was used with two distinct conditions: sitting without interruptions and sitting with periodic interruptions of moderate intensity (Figure 2). Assuming that the condition with periodic interruptions of moderate intensity could enhance insulin action for up to 48 h (Mikines, Sonne, Farrell, Tronier, & Galbo, 1988), a 4-6 day washout period between trial conditions was used to eliminate potential carryover effects. Moreover, a restrictive period was also used 48 hours before each trial condition, where participants were asked to refrain from structured MVPA (i.e., no PA beyond activities of daily living), caffeine, and alcohol. Prior to the first intervention and following the last, participants also underwent a set of laboratory measurements. Baseline and follow-up assessments were performed 3-10 days before/after the experimental protocols and included the assessment of body composition, metabolic flexibility, bioelectrical impedance analysis (BIA), physical fitness, and the completion of four different questionnaires.
This thesis is integrated into a larger investigation that involves three different dissertations, each one with different goals (PPG responses, phase angle changes and metabolic flexibility alterations). The primary outcome of this study concerns changes in iAUC glucose, which was assessed at baseline and follow-up for both conditions. Secondary outcome concerns changes in PPG responses due to 2-weeks DT period.
44 Figure 2 - Intervention Guide