FACULDADE DE LETRAS
UNIVE RSIDADE DO PO RTO
i
Baraniko.Namanoku
2º Ciclo de Estudos em Riscos, Cidades e Ordenamento do Território
Drought and its social, environmental and economic negative impact in Kiribati with a specific case study of South Tarawa.
2014
Orientador: Professora Doutora Ana Maria Rodrigues Monteiro Coorientador: Victor Manuel Martins Soares Prior
Classificação: Ciclo de estudos:
Dissertação/relatório/Projeto/IPP:
ii
Declaration of Originality
I, Baraniko Namanoku, hereby declare to the best of my knowledge that the information given in this dissertation are true and correct and all the materials used in the text are fully
acknowledged.
I believe that this mini-thesis is the first of its kind for Kiribati and the Pacific Island Countries and sincerely pray and hope that it will promote further scholarship and guidelines for students within the region who want to venture to probe on drought implications in their respective countries including Kiribati.
……….. Baraniko. Namanoku.
………
Declaration by Supervisor
I certify that the information, data and analyses contained in this dissertation are the original works of Baraniko Namanoku, except where duly acknowledged.
………
iii
First and foremost, I would like to dedicate this to the “Almighty God” for giving me the pillar of strength, guidance and wisdom to complete this dissertation.
Thank you “Jehovah God”.
This is also dedicated to my beloved wife Akoia and three children Christina, Lusiana and Namanoku including to all my families in Fiji, Kiribati and abroad for their never-ending support, encouragement and prayer during my 2 years studied at Porto University in Portugal.
iv
Acknowledgement
It is my deepest gratitude goes first to the my sponsor the European Union for the wonderful support and allowances rendered to me during the two years course at Porto University in Portugal.
Also my sincere appreciation goes to my entire Professors from the different disciplines who had been lecturing me in the Master programme (Hazards, Cities and Spatial Planning) at Porto University for their wonderful support and friendship during my one course programme as a post graduate student (Ana Monteiro, Carlos Bateira, Alberto Gomes, Carmen Ferreira, Laura Soares, Helder Marques, Teresa Marques and Mário Fernandes. Additionally, I will never forget also all my colleagues in our programme and Assistant Lecturers for their true friendship, support and jokes during the two year programme. Kam bati n rabwa (Muito obrigado).
My gratefulness also goes to the Climate, Health and Environment Research Group (CHERG) members such as Mário Almeida, Sara Velho, Luís Fonseca and Carlos Sousa for their assistance, advice and friendship while mingling with them. It is a pleasure to be part of this Research Group under the leadership of Professor Ana Monteiro. Additionally, I will never overlook the input of my Supervisor Professor Ana Monteiro and Co-Supervisor Professor Victor Prior, Dr Eberhard Weber from the Geography Department and Dr Sarah Hemstock from PACE-SD, USP for their constructive feedbacks and advise on the draft including Camari Waqanivalu Koto for advising and proofreading my questionnaires.
I am also thankful to all the staff at the Mobility International Office at Reitoria including at the Faculty of Arts, Letras for their continuous support and friendship during the two years studies. Moreover, I am indebted to all my informants from Kiribati and the people who are assisting in answering the questionnaires including staff from the different institutions such as:-
Ribeta Abeta, Former Climate Change Officer from the Environment Unit (MELAD) Ruiti Aretaake, Director of FSPK
Maryanee Utiree, Assistant Health Statistician (MHMS)
v
Tianeti Bweena, Acting Director for Agriculture Division (MELAD)
Andrew Teem and Michael Foon, Policy Ofiicers - DRM (Office of President) Aritita Tekaieti, Senior Economic Statistician (KNSO)
Mamarau Ringkan Kairirieta, Climate Change Adaptation Coordinator
Dr Arthur Webb, Deputy Director-Ocean & Islands Programme Coastal Processes Adviser, SOPAC.
Kataebaeti Bataua, GIS and RS Specialist, SOPAC.
Librarian at USP, SOPAC and Faculty of Arts, Letras (University of Porto). Tebikau Noran, Director of Environment Health (MHMS)
Ueneta Toorua, Climate Officer (KMS)
Itienang Timona, Water Engineering Manager PUB (MPWU) Uenaate Willie, Acting Senior Water Engineer (MPWU)
Also I am grateful to my former and current Pacific Islanders Community members in Porto for their friendship and words of encouragement during the writing of this dissertation.
Finally, my sincere gratitude directs to members of the jury during the final defence of this dissertation.
Last but not the least, my special appreciation goes to my Supervisor Ana Sousa Monteiro for her guidance, experiences, feedbacks, input, advices and support during the writing of this dissertation.
Once again, this dissertation is also dedicated to you all including those I forget to mention. Muito Obrigado / Kam bwati n rabwa/ Vinaka Vakalevu.
Te Mauri1, Te Raoi2 ao Te Tabomoa3
1 Good Health 2 Peace 3 Prosperity
vi
Abstract
Drought is a multi-variable factor and therefore there is no common or universal definition to describe it. In Kiribati, it is known as “te mwautakataka” and become an important issue due to climate change and climate variability. Therefore, this dissertation is an investigation of “te mwautaktaka” social, economic implication on people’s livelihoods and the environment. Additionally, this research outlines how the Government has managed “te mwautakataka” impacts in the study area of South Tarawa in order to make some recommendations for future risk management.
The research was implemented in South Tarawa in the Republic of Kiribati and involved standard social science methodologies including interviews of key informants and visiting major institutions.
Study findings show that in South Tarawa, drought has a negative implication on peoples’ livelihood. It also creates health problems because of dust and reduced water availability. More importantly, the negative influence on the environment especially on edible fruit trees and food crops, are noticeable. Additionally, well water turns saline in some places. As a result, the Government establishes the Drought Committee to warn and mobilize the community in South Tarawa.
To conclude, droughts with the longest magnitude have the most destructive effect on the environment and peoples’ livelihood in Kiribati in general. As for the South Tarawa, the 1998 -1999 “te mwautakataka” was the worst drought event in terms of severity and magnitude which had negative social and economic implications on peoples’ livelihood and on the environment. The Government and people are well informed when drought event is imminent through the Drought Committee.
Key Words: Kiribati‘s Droughts; Droughts’ social, environmental and economic impacts; Drought adaptation and mitigation.
viii
Acronym
AMS- American Meteorological Services. AOG- Assembly of God.
BP- Before Present.
BBC- British Broadcasting Corporation. CBR- Crude Birth Rate.
CDR- Crude Death Rate. COG- Church of God.
CPI- Cumulative Precipitation Index.
CSIRO- Commonwealth Scientific and Industrial Research Organization. DC- Drought Committee.
DTF- Drought Task Force. EDB- Equatorial Doldrums belt. EEZ- Economic Exclusive Zone. ENSO- El Nino Southern Oscillation EM-DAT- Emergency Database. EU-European Union.
EWS-Early Warning System.
FAO- Food and Agricultural Organization.
FEMA- Federal Emergency Management Agency. GCM- Global Climate Models.
GEIC- Gilbert and Ellice Island Colony. GDP- Gross Domestic Product.
GHGs- Greenhouse Gases.
GIS- Geographical Information System. HEIS- Household Expenses Income Survey.
ix IPCC- International Panel of Climate Change. ITCZ- Inter Tropical Convergence Zone. JSS- Junior Secondary Schools.
JW- Jehovah Witness.
KAP - Kiribati Adaptation Project. KAP- Knowledge, Attitudes and Practise. KPC- Kiribati Protestant Church.
LDS-Latter Day Saints.
KILT- Kiribati Indentured Labour Trade. KMS- Kiribati Meteorological Services.
KNBSAP- Kiribati National Biodiversity Strategy Action Plan. KNSO-Kiribati National Statistic Office.
LDC- Least Developing Countries.
MELAD- Ministry of Environment, Land and Agricultural Development. MHMS- Ministry of Health and Medical Services.
MISA- Ministry of Internal and Social Affairs.
MFED- Ministry of Finance and Economic Development.
MFMR- Ministry of Fisheries and Marine Resources Development MPWU- Ministry of Public Works and Utilities.
NAPA- National Adaptation Plan of Action. NASA- National Aeronautics Space Agency.
NCCHAP- National Climate Change and Health Actions Plans. NCDC- National Climatic Data Centre.
NDC- National Disaster Council.
NDMA- National Disaster Management Authority. NDMO- National Disaster Management Office. NDS- National Development Strategy.
x OCHA- Office for the Coordination of Human Affairs.
PACE-SD - Pacific Centre for Environment and Sustainable Development. PDSI- Palmer Drought Severity Index.
PIC- Pacific Island Countries.
PCSSP- Pacific Climate Change Science Programme. PUB- Public Utilities Board.
RERF- Reserve Equalization Reserve Fund. SDA- Seventh Day Adventist.
SIDS- Small Island Developing States. SPC- Secretariat of the Pacific Communities. SPCZ- South Pacific Convergence Zone. SPI- Standard Precipitation Index.
SPSS-Statistical Package for Social Science.
SOPAC- South Pacific Applied Geosciences Commission. SST- Sea Surface Temperature.
SWSI- Surface Water Surface Index. TTM- Taiwan Technical Mission.
UNEP- United Nation Environment Programme.
UNISDR- United Nation International Strategy for Disaster Reduction. UP- University of Porto.
USP- The University of the South Pacific. WB-World Bank.
WHO- World Health Organization.
xi
Glossary
Aumeang- A wet season characterized by bad weather. Aumaiaki- A dry season characterized by fine weather.
Bwabwai- Giant Swamp taro that grows in an open pit dug to the water lens. Botaki ni Unimwane- Council of Elders.
Climate Change- Refers to any change in climate change over time, due to natural variability or
as a result of human activity.
Climate Variability- Refers to variations in the mean state of climate system expressed during a
certain period of time and expressed in statistics (such as standard deviations, the occurrence of extremes, etc).
EL Nino- An irregular rainfall behaviour affecting certain globe areas like the equatorial Pacific
region characterized by the appearance of unusually warm, nutrient-poor water
ENSO - The term coined in the early 1980s in recognition of the intimate linkage between El
Niño events and the Southern Oscillation, which, prior to the late 1960s, had been viewed as two unrelated phenomena. The interactive global ocean-atmosphere cycle comprising El Niño and La Niña is often called the ENSO cycle.
Evapotranspiration - the process by which water is transferred from the land to the atmosphere
by evaporation from the soil and other surfaces and by transpiration from plants
Inaai –A ground mat woven from a coconut leaves. Kakairua- True hospitality to guests.
Kaokioki- Traditional liquor made from toddy derived from coconut tree sap. Kaonako - A small octopus that commonly seen on the reef flat.
Kaonono system- A system of sharing something like foods or whatever between two or more
people based on friendships and others.
xii
La Nina –An irregular rainfall behaviour affecting certain globe areas like the equatorial Pacific
region characterized by an extraordinary cooling in sea surface temperature
Rongo- Refers to the unavailability of food on the land and the sea which could be the product of
man-made or natural induced event.
Maroro-A type of conversation between the two or more people which can be either formal or
informal depending on the context.
Mwaie - A common name for all traditional dances. Mwaneaba - A traditional meeting house.
Mwautakataka- Refers to the unavailability of precipitation for a certain period of time which
has a negative repercussion on all living things on earths.
NAPA- It is an approach to enable Least Developing Countries to communicate their immediate
and urgent needs for adaptation to the Conference of the Parties. The process involved in the development of the NAPA is designed to ensure the principles of stakeholder participation, country driven-ness, multidisciplinary input, complementarities to other projects, and cost effectiveness.
Takataka- It refers to the copra or dried meat of the coconut. Toamau- Balance in term of composition of age and gender. Tuae - A preserved paste
Utu- It refers to member of the clan. Unimwane - It refers to an old man.
xiii
TABLE OF CONTENTS
Drought and its social, environmental and economic negative impact in Kiribati with a specific
case study of South Tarawa. ... i
Declaration of Originality ... ii Acknowledgement…… ... iv Abstract………. ... vi Acronym……….. ... viii Glossary... ... xi CHAPTER ONE…….. ... 2 Chapter 1………. ... 4 1.1 Introduction……… ... 4
1.2 Background of the Study ... 7
1.2.1 Overview of drought incidence in the Pacific Islands and Kiribati. ... 7
1.2.2 Status of drought literature in Kiribati ... 12
1.2.3 Livelihoods in Kiribati ... 13
1.3 Aim and Objectives... 14
1.4 Significance and Rationale of the study: ... 15
1.5 Study Methodology ... 15
1.6 Conceptual Framework of Thesis ... 18
1.7 Structure of the Thesis ... 19
CHAPTER TWO... ... 22
Chapter 2... ... 24
2.1. Introduction... ... 24
2.1. Part 1: General Impact of Drought on Global Scale ... 24
2.1. Part 2: The Conceptual Framework of Drought Risk Reduction ... 30
2.2. Disaster Risk Reduction. ... 31
2.3 General drought characteristic, definition, typologies and indices ... 33
2.3.1 General characteristic of Drought ... 33
2.3.2 What is drought? ... 34
2.4 Drought Typologies. ... 36
2.4.1 Meteorological Drought. ... 36
xiv
2.4.3 Hydrological Drought. ... 37
2.4.4 Social- Economic Drought. ... 37
2.5 Drought Indices... ... 38
2.5.1 Standard Precipitation Index (SPI) ... 40
2.5.2 Palmer Drought Severity Index (PDSI) ... 42
2.5.3 Rainfall Anomalies ... 42
2.5.4 Surface Water Supply Index ... 43
2.5.5 Foley Drought Index ... 44
2.5.6 Percent of Normal. ... 45
2.6 Drought Event Definition for South Tarawa. ... 45
Chapter 3... ... 50
3.1 Introduction... ... 50
3.1 Part One: Research Methodology ... 50
3.1.1 Data Acquisition: Primary Data ... 50
3.1.2 Literature Review: Secondary Data ... 52
3.1.3 Stratified Sampling Techniques: Focus Group ... 53
3.1.4 Te Maroro approach ... 54
3.1.5 Tools: GIS, SPSS, Excel, Google Map and Image, Camera and Microsoft Excel, SPI Calculator ... 55
3.1.6 Procedure for calculation of drought magnitude using percentile for Tarawa ... 55
3.1.7 Procedure for SPI Calculation for worst drought event at Tarawa ... 56
3.2 Part 2.1. Country Profile: Kiribati... 57
3.2.1 Brief Description of Kiribati history ... 57
3.2.2 Geography: Location ... 57
3.2.3 The Climate ... 60
3.2.4 Geomorphology ... 60
3.2.5 Biogeography ... 61
3.2.6 Demography ... 62
3.2.7 Cultural-Social and Economic Characteristics ... 66
3.2.Part 2.2 Case Study - South Tarawa ... 75
3.2.1. Physical Characteristic ... 75
3.2.2 Climate ... 75
xv
3.2.4 Water Supply ... 78
3.2.5 Economic activity ... 79
3.3 Social-Economic and Environmental Performances of Kiribati (1947-2011) ... 81
3.3.1 Agricultural Economic Performance ... 81
3.3.2 Fisheries Economic Performance in Kiribati. ... 84
3.3. 3 Social Performances from te mwautakataka in Kiribati ... 87
3.3.4 Environment Performance from “te mwautakataka” in Kiribati. ... 90
.4 Case Study: South Tarawa ... 91
3.4.1 Economic Performance of Coastal Fishing from te Mautakataka (1995-2003) ... 91
3.4.2 Economic Performance on copra production at Tarawa Island from te Mwautakataka (1992-2011)... 92
3.4.3 Economic Performance of Combined Recorded Total Sale of Vegetables Stalls at various location in South Tarawa, Kiribati. ... 93
3.4.4 Social Performance of Te mwautakataka for South Tarawa. ... 93
3.4.5 Comparison of the Economic Performance in South Tarawa between Fishing and Agriculture. ... 95
3.4.6. Comparison on the Social Performance of 3.4.4.1 and 3.4.4.2 ... 95
3.4.7 Environmental Impact of Te Mwautakataka in South Tarawa ... 96
CHAPTER FOUR…… ... 100
Chapter 4………. ... 102
4.1 Introduction... ... 102
4.2 Part One: Summary result of respondents based on SPSS ... 102
4.2.1 Tabulated number of respondents in terms of age and gender ... 102
4.2.2 Tabulated Summary of Respondents in term of their gender and education level .... 103
4.2.3 Cross tabulation of Respondents in term of their age and villages ... 103
4.2.4 Cross tabulation of drought knowledge, source and signs from respondents ... 104
4.2.5 Drought vernacular name from respondents ... 106
4.2.6 Drought Occurrence and trend from Respondents... 106
4.2.7 Drought worst years from respondents ... 107
4.2.8 Analysis of Percentile and SPI Result ... 108
4.3 Part Two: Social, Environmental and Economic Impacts on the Study area ... 113
4.3.1 Analysis of Coastal and Offshore Fishing Economic Impact on South Tarawa, Kiribati. ... 113
xvi
4.3.3 Analysis of Social performances of Te Mwautakataka on peoples’ livelihood in South
Tarawa ... 115
4.3.4 Analysis of te mwautakataka implication to the environment in South Tarawa. ... 121
4.4 Part 3. Government strategy to Mitigate Disaster in Kiribati ... 122
4.4.1 National Disaster Risk Management Plan ... 122
4.4.2 Government Drought Response Plan ... 123
4.4.3 Perception about DC existence by Respondents ... 126
4.4.4 DC Popularity by Respondents ... 127
4.4.5 DC assistance to the Public during drought event ... 129
CHAPTER FIVE……. ... 132
Chapter 5... ... 134
5.1 Our Achievements ... 134
5.2 Recommendations to Government strategies and activities. ... 139
Bibliographic References ... 142 Appendices... ... 156 Appendix 1. ... 156 Appendix 2 ... 157 Appendix 3 ... 158 Appendix 4 ... 159 Appendix 5 ... 160 Appendix 6 ... 161 Appendix 7. ... 162 Appendix 8. ... 163 Appendix 9 ... 164 Appendix 10 ... 165 Appendix 11. ... 166 Appendix 12 ... 167
xvii
LIST OF DIAGRAMS
Diagram 1. Conceptual Framework of a dissertation ... 18
Diagram 2. The products derived from the coconut tree ... 69
Diagram 3. National Disaster Response Plan ... 123
Diagram 4. Drought Response Organizational Structure ... 124
LIST OF TABLES Table 1. Number of reported disasters in the Pacific Islands (1950-2004). ... 7
Table 2. Total Population of South Tarawa and Kiribati. ... 17
Table 3. Major Administrative Centre in South Tarawa. ... 17
Table 4. List of drought indices with some authors and year of publications. ... 40
Table 5. SPI Values... 41
Table 6. The decile classification as per Gibbs and Maher (1967) ... 43
Table 7. Percentage of literacy rate at urban and rural context at Kiribati. ... 65
Table 8. Employment and unemployment status in Kiribati in urban and rural population. ... 66
Table 9. Population of settlements in South Tarawa ... 78
Table 10. Perceptions of the informants on increased and intense sunlight ... 87
Table 11. The worst drought year in South Tarawa based on the Respondents. ... 108
Table 12. Lowest annual rainfall based on the two seasons’ orientation below the 10th percentile threshold ... 109
Table 13. Selected monthly rainfall anomalies ... 113
xviii
TABLE OF FIGURES
Figure 1. Map showing major areas prone to drought. 5
Figure 2. The peak time of recruitment during the severity of drought since 1875- 1895. 8 Figure 3. SST, colder than normal during the La Nina condition in 2010-2011 9
Figure 4. Number of La Nina and El Nino since 1950 to 2005, 10
Figure 5. La Nina events since 1950-2009. 11
Figure 6. Map of Kiribati 16
Figure 7. Map of South Tarawa 17
Figure 8. The Conceptual Framework of Drought Risk Reduction 30
Figure 9. The cycle of Disaster Management 31
Figure 10. 10 steps planning process 32
Figure 11. Flow diagram of drought typologies 38
Figure 12. KMS Office at Betio on the left and Statistic Office from MHMS at Nawerewere on
the right 51
Figure 13. Main headquarter of SOPAC in Suva, Fiji Islands 53
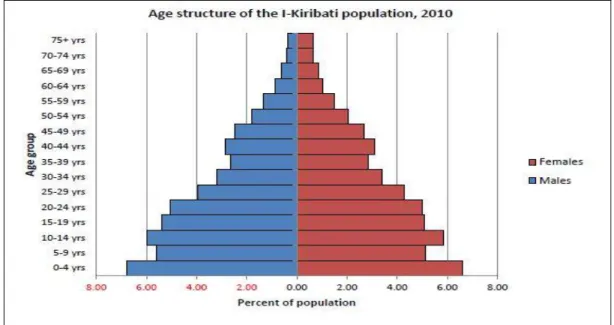
Figure 14. Questionnaire strategy facilitated by "Te Maroro" Approach 54 Figure 15. The location of Kiribati within the region and the rest of the World. 58 Figure 16. The three major region of Kiribati (Gilbert Islands, Phoenix Islands and Line Islands 59 Figure 17. Population growth of Kiribati and South Tarawa since 1931 to 2010 63 Figure 18. Population pyramid for the different age group of Kiribati, 2010. 64
Figure 19. Proportion of education attainment in Kiribati. 65
Figure 20 . Guest seated under “Te mwaneaba” 66
Figure 21. Proportion of food crops grown by household in Kiribati, 2010. 70 Figure 22. Proportion of households by fishing activity in Kiribati, 2010. 71
Figure 23. Map of South Tarawa, Kiribati 75
Figure 24. Mean and Maximum Temperature Graph of South Tarawa since 1947-2011 76 Figure 25. Total Annual Rainfall of South Tarawa since 1947-2011 77 Figure 26. Woman selling breadfruit at Bairiki (on the left); fish vendors (on the right) at
Bikenibeu, South Tarawa 80
Figure 27. Total agricultural (Copra and Non- Copra) production in Kiribati 81
Figure 28. Copra Production and Exports for Kiribati 82
Figure 29. Copra production from selected Islands from Kiribati 82 Figure 30. Sale and Consumption expenses for vegetables and food crops in Kiribati 83 Figure 31. Non Copra Agriculture Consumption expenses in Kiribati. 83 Figure 32. Food Crops and Vegetables for Sale expenses only in Kiribati 84
Figure 33. Tuna Catches in Kiribati Water by Foreign Vessels 84
Figure 34. Total Annual Value Catches for Commercial and Informal Sector Fishing in Kiribati 85 Figure 35. The total catches of all sectors in South Tarawa since 1995 to 2003 (OCN-Ocean Fishing, RFF-Reef Fishing, LGN-Lagoon Fishing, COL-Collection Fishing) 91
xix
Figure 37. Economic performance of copra production at Tarawa Island since 1993-2002 92 Figure 38. Total sales of vegetables at various locations in South Tarawa. 93
Figure 39. Mortality rate in South Tarawa due to Sicknesses 93
Figure 40. Type of Sicknesses by Respondents in 2013. 94
Figure 41. How stressful drought is based on respondents in 2013. 94
Figure 42. Floating dust from passing vehicles and wind 97
Figure 43. Number of Respondents in terms of age and gender 102
Figure 44. Summary of Respondents in terms of their ages and gender in percentage 103 Figure 45. Cross tabulation of age and villages of the respondents 104 Figure 46. Cross tabulation of the result of drought knowledge, signs and sources of Respondents 105 Figure 47. Percentage of respondents for drought Source Knowledge. 106 Figure 48. Respondents’ understanding on drought vernacular name 106 Figure 49. The perspective of respondents in % on drought duration and trend 107 Figure 50. Total Annual Precipitation based on the calculated 10th percentile since 1947-2011. 109 Figure 51. Severity of drought years for Tarawa since 1947-1982 110 Figure 52. The total monthly wet season (Nov-April) for Tarawa for 1947-2011. 111
Figure 53. The dry season for Tarawa between 1947-2011. 112
Figure 54. Respondents’ perception on marine species status. 114 Figure 55. Perception of Respondents regarding foodcrops and vegetables. 115 Figure 56. Respondents’ perception on drought impact on livelihood 115 Figure 57. Major land based livelihoods affected in South Tarawa mentioned by Respondents 116
Figure 58. Types of business by respondents 117
Figure 59. Family expenses affected by drought based on respondents. 117
Figure 60. Drought impact on regulated tap water supply. 118
Figure 61. Reasons of water sharing (or not) by respondents 119
Figure 62. Causes and types of sicknesses. 120
Figure 63. DC popularity by respondents based on Age and Gender 127
Figure 64. Drought warning by DC agencies. 128
Figure 65. Source of drought warning 128
Figure 66. Form of Assistance by DC. 129
1
“………we are not sure about it until the crops have withered and died.”
2
4
Chapter 1
1.1 Introduction
Throughout human existence drought has been a threat to the survival of societies. It has been a trigger for massive human migrations, famines, and wars, altering the course of history. Also today drought continues to affect communities in countless ways even as we are entering the 21st century (Wilhite & Vanyarkho, 2000). It is considered as one of the major threats among so-called natural hazards. It affects people’s livelihoods and community’s socio-economic development(UNISDR, 2009).Its impact is non-structural and covers a wide huge range of areas compared to other natural hazard such as flooding, hurricanes and earthquakes. As a result the quantification of its impact and provision of relief are far more difficult for droughts than for other natural hazard (Mishra and Singh, 2010).Drought triggers disasters that already 30 years ago affected more people than any other hazards as stated in the 1984 report by the Swedish Red Cross(Byrant, 2005) and (Hagman, 1984) respectively. Also today drought causes widespread impacts that can affect millions of people in a single case.
Drought happens as a result of multiple factor and therefore defining drought is difficult (Wilhite 2000, pg 6). According to Wilhite and Glantz (1985), drought can be categorized into four types such as meteorological, agricultural, hydrological and social-economic drought.
In Kiribati, there are two vernacular terms used to interpret drought which are often mistakenly used by the people; one is “te Rongo” and the other is ‘te Mwautakataka”. The former definition could be either a product of man-made or natural induced event or a combination of both which is resulted in the unavailability of food on the land and sea. The latter interpretation is an outcome of a climatic event only that affected the availability of the water resources on the land due to the absence of rainfall for quite a certain period of time which differ from places and contexts and which on the other hand has a negative repercussion on water dependent users such as trees, animals and peoples’
5
According to the Emergency Database (EM-DAT) drought occurs in the entire sphere of the globe as cited by UNISDR (2009, pg 2). Intensity and frequency however are highest in tropical and subtropical regions while the temperate regions are less prone to drought. It is mainly associated with the movement of climatic drivers such as EL Nino Southern Oscillation (ENSO)4such as the La Nina5 and El Nino6 and the Inter Tropical Convergence Zone (ITCZ). Human factors such as over-exploitation of water resources during dry spells add to these meteorological challenges. Figure 1 shows the areas in the world that are prone to drought.
Figure 1. Map showing major areas prone to drought.
Source: http://unitedcats.wordpress.com/2009/02/11/another-fly-in-the-ointment-global-drought/ (Retrieved from 3rd October, 2012).
4 The term coined in the early 1980s in recognition of the intimate linkage between El Niño events and the Southern Oscillation, which, prior to the late 1960s, had been viewed as two unrelated phenomena. The interactive global ocean-atmosphere cycle comprising El Niño and La Niña is often called the ENSO cycle. 5 La Nina- A cooling in sea surface temperature in the central and eastern equatorial Pacific that occurs at
irregular intervals
6 An irregular warming of a sea surface temperature occurring in the Equatorial Pacific region and beyond accompanied by nutrient poor water off northern Peru and Ecuador, typically late December.
3000 km N
6
Although the above world map does not show the Pacific Islands Countries (PICs) due to their smallness in size on global scale with the exception of Papua New Guinea, drought occurs in Pacific Islands mainly as a result of La Nina and El Nino events. In Kiribati, drought is normally associated with the La Nina event (PCCSP, 2011). Its impact will fully investigate in this dissertation in general in Kiribati before zooming to the case study of South Tarawa, the main atoll of Kiribati harboring also the countries capital. With climate change7, drought becomes an important issue in the Pacific Islands including Kiribati due to climate change and climate variability 8(IPCC, 2013).
Therefore, for the purpose of this mini-thesis, the definition will be taken which understands drought as an outcome of a climatic event that affects the availability of water resources on the land due to the absence of rainfall for an extended period of time is “te mwautakataka”. This definition will be used as a threshold to define drought based on precipitation data only (Meteorological drought) although there are other thresholds that could be used to define event such as agricultural, hydrology and socio- economical drought that could be employed as well as stated above.
7 Climate Change- refers to any change in climate change over time, due to natural variability or as a result of human activity.
8
It refers to variations in the mean state and other statistics (such as standard deviations, the occurrence of extremes, etc) of the climate on all spatial and temporal scales beyond that of individual weather patterns.
7
1.2 Background of the Study
1.2.1 Overview of drought incidence in the Pacific Islands and Kiribati.
The 1998 to 1999 La Nina event that occurred in the Central and Eastern Pacific affected countries like Kiribati, Tuvalu and Nauru while the El Nino event caused drought in Fiji and Marshal Islands in 1998. In fact, the occurrence of this ENSO has opposite impacts within the Pacific Islands. For instance, the 1998 La Nina which affected the Central and Eastern Pacific like Kiribati, Tuvalu, and Nauru created drought in these places whereas in the Western Pacific it brought heavy rainfall in countries such as Indonesia, Malaysia and Northern Australia according to the National Aeronautics Space Agency Earth Observatory(Graham, 1999). Nevertheless, according to the International Emergency Database on disasters as cited by Bettencourt et al, (2006), there were 10 reported droughts events within the Pacific region since 1950 to 2004. These droughts affected almost 630,000 people although there are none reported fatal facilities (see Table 1). Windstorms 157 1380 2,496,808 5,903.90 Droughts 10 0 62,958 137 Floods 8 40 246,644 94.8 Earthquakes 17 53 22,254 330.6 Others 15 274 21,520 60 Melanesia 110 1130 2,115,332 1,654.90 Polynesia 71 494 1,041,012 1,797.40 Micronesia 26 123 260,662 3,074.04 Total Pacific 207 1747 3,417,006 6,526.30
Type of hazards Number Reported Fatalities
Population Affected
Reported Losses (in 2004, US $ m)
Regions Number Reported
Fatalities
Population Affected
Reported Losses (in 2004, US $)
Table 1. Number of reported disasters in the Pacific Islands (1950-2004).
Source: EM-DAT: the OFDA/CRED International Disaster Database for 1950-2004 adjusted by SOPAC (2005) for 1994-2005 data. (Retrieved on the 5th October, 2012).
8
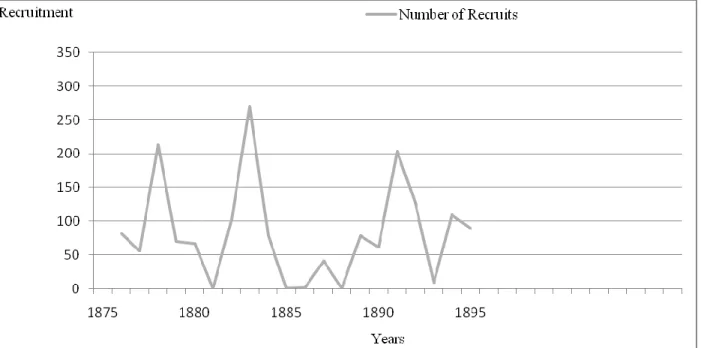
Despite the above recording of the disaster database, it is apparent that past drought events in the Pacific Islands including Kiribati had been overlooked due to the absence of data. For instance, Etuati (2010) highlights that drought prompted I-Kiribati residing in the Southern Groups such as Tamana and Arorae to engage in the indentured labor in Fiji and other Pacific islands including Guatemala in the mid 19thcentury (1877-1878, 1881-1883, 1889-1891) to escape the hardship people suffered from the prolong severity of drought as stated in the peak graph. They were willingly to volunteer to work somewhere else. The graph below in figure 2 depicted the number of labors recruited during the severity of droughts during the Kiribati Indentured Labor Trade (KILT).
Figure 2. The peak time of recruitment during the severity of drought since 1875- 1895.
(Source: Etuati, 2010)
Another wave of external migration occurred due to drought effect is in the late 1950s’ and 1960s’for the Islanders on Phoenix Group as they were resettled in the Solomon Islands by the British Government, the former colonizer of Gilbert and Ellice Islands, as the Phoenix Islands were not suitable for permanent settlement as the well water seriously salinized making it not good for drinking. (Government of Kiribati, 2007)
Drought is more common in southern Kiribati, Ocean Island in the very west of Kiribati and the Lines and Phoenix Groups in Eastern Kiribati (Teebaki, ny). In Northern Kiribati where rainfall
9
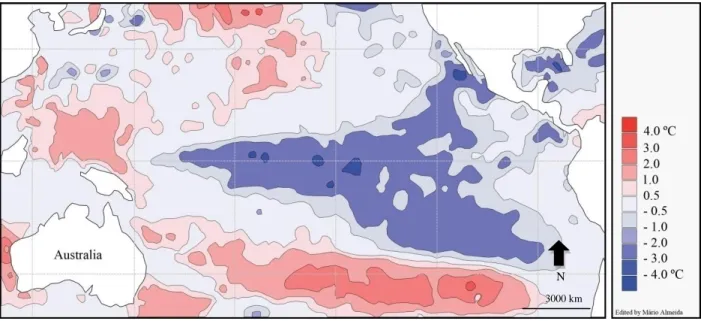
is abundant droughts occur rarely. Droughts are usually associated with the El Nino Southern Oscillation (ENSO) cycle especially the La Nina event which brings lower rainfall (PCCSP, 2011).Though its occurrence is unpredictable, there has been an improvement in knowledge using advanced technology and satellite images to detect its movement by climatologist with other Scientists. During it occurrence the sea surface temperature (SST) is much colder than it is usual and thus affecting the surrounding temperature and climate of a place. During its occurrence, the prevailing trade wind intensifies and moving to the Western Pacific toward Indonesia, Malaysia, Papua New Guinea and Northern Australia bringing warm moist air and heavy rainfall and thus causing flooding and bad weather in these regions. Figure 3 below shows the 2010 to 2011 La Nina conditions by blue color of colder sea surface temperature (SST) than usual; red color indicates warmer SST than usual (El Nino) and light blue and red indicates normal (as usual) SST in the Central and Eastern Pacific where Kiribati is also located.
Figure 3. SST, colder than normal during the La Nina condition in 2010-2011
(Source: Australian Government Bureau of Meteorology (AGBM), 2012). Retrieved on the 16th April, 2014.
In Kiribati regions or groups of islands that are prone to drought struggle a lot. The National Climate Change and Health Actions Plans (NCCHAPs) reported that drought in Kiribati was usually associated with the La Nina event and can be severe. Recent droughts occurred in 1988-1989, 1998-1999, 2009 and 2011(Kiribati Report, 2011).The Republic of Kiribati Country Report (1999) highlighted that the worst droughts occurred in 1949-1950, 1973-1974 and as well in 1989-1990 and
3000 km N
10
1998-1999. There was a minor drought occurring in 2007 as indicated in KAP phase pilot survey in 2008(Hogan, 2008) and in 2010 to 2011 as shown in Figure 3. In August 2013, when the fieldwork for this thesis was conducted, there also had been drought conditions in South Tarawa.
Based on a report by Pacific Climate Change Science Program (PCCSP, 2011), there were 17 La Nina events in South Tarawa in the period 1950-2009 while the El Nino episode were 13 as stated in Figure 4 below (Note the grey colors indicate the normal condition).
Figure 4. Number of La Nina and El Nino since 1950 to 2005,
Source: PCCSP (2011)
Analyzing the above graph and plotting the La Nina event only with the temperature, it is apparent that the trend of the La Nina event is increasing as shown in Figure 5 below, which indicates that there is a positive warming or dry season imminent with less rainfall in the future.
11
Figure 5. La Nina events since 1950-2009.
(Source: compiled by the Author)
Based on the three International Panel Climate Change (IPCC) projections of emission scenarios of Carbon dioxide concentrations such as low emission (550ppm), medium emissions (700ppm) and high emission (>800ppm) for 2030, 2055 and 2090 (PCCSP, 2011,p.5), it is anticipated that Kiribati’s climate would be changing in the future with an increase in average temperature that will result in more hot days and warm nights. This is also relevant to the average annual and seasonal rainfall based on the Global Climate Models (GCM) although there is an uncertainty in the rainfall projections as not all models show consistent results. With this uncertainty in the projected rainfall trends especially for Tarawa, “te mwautakaka” can be unpredictable or more frequent although it was envisaged that “te mwautakataka” would be less frequent in this century for Kiribati climate (PCCSP, 2011). This skeptism regarding Tarawa was also highlighted in the report published by the National Institute of Water and Atmospheric Research (NIWA, 2008). No one really knows exactly what the future holds as models are not consistent and also future scenarios depend on the rate of emission of Greenhouse Gases (GHG’s) which is still under negotiation by World Leaders. Even if agreement is achieved actual emissions remain unpredictable as there is no real guarantee that agreed emissions are respected. Especially the future trend of carbon dioxide, which is the major contributor to the so-called anthropogenic
12
“Global warming”, is difficult to predict. Economic growth and with it sharp increases in energy
consumption of big developing countries such as Brazil, China, India, and others have the potential to undo emission reductions in the old developed countries. This then will have a direct negative impact on Small Island Developing States (SIDS) like Kiribati.
Finally the comments made by an old man, Biribo’s confirmed doubts that the country has been experiencing extreme droughts in the past few decades (Kiribati Report, 2011) including the 2010 and 2011 drought event and also drought conditions experienced while doing this research in the study area in August 2013.
This mini-thesis is to answer the following questions:-
i. Is “te mwautakataka” significant issue now in Kiribati?
ii. How does “te mwautakataka” impacts the people and the environment as a whole? iii. What has been done by the Government to mitigate the impact of “te mwautakataka” on
the community as a whole and especially to the case study?
1.2.2 Status of drought literature in Kiribati
Compared with other voluminous literature on “te mwautakataka” and its associated impacts on the environment, people’s livelihood and communities social-economic development from developed and developing countries from beyond the Pacific region, very scarce exist in the literature about “te mwautakataka” and its impacts on the environment in South Tarawa or Kiribati in general, only a handful on climate change effect as stated by White et al. (2007), Kuruppu (2009), White et al. (1999) on groundwater resources impact. Little so far has been done on people's livelihood in South Tarawa, although Etuati (2010) reported on the nature of labour recruitment in the Southern Kiribati in the mid 19th century which coincided with the occurrence of extreme drought plagued those islands. It is very likely that the drought affected people’s livelihood and forced these islanders to engage in work elsewhere. The Kiribati Indentured Labour Trade (KILT) thus seems to be closely connected to drought and the desperate situation people were confronted with. Therefore this is a challenging task question why “te mwautakataka” and its impact was often overlooked considering the number of
13
droughts happening in the country since the middle of the 20th Century to 2009 as reported by PCCSP( 2011). It is quite interesting that a lot of literature exists on Climate change impacts in the country. This includes the Kiribati Adaptation Project (KAP) started in 2003 by the World Bank and the National Adaptation of Programs of Action (NAPA)9 of the same year, which is fairly broad in nature, but contains little or even nothing on “te mwautakataka” and its associate negative social, economic and environment implications on people’s livelihoods at national level and in the study area.
1.2.3 Livelihoods in Kiribati
According to the definition of “livelihood” as suggested by Chambers and Conroy (1991, p. 6) a livelihood “comprises the capabilities, assets (including both material and social resources) and activities required for a means of living. A livelihood is sustainable when it can cope with and recover from stress and shocks and maintain or enhance its capabilities and assets both now and in the future, while not undermining the natural resources base”. Implicit in this definition are assets and means of living plus coping strategies to enhance people capabilities. In this dissertation these assets will be investigated deeply including peoples activities for a means of making living (either for subsistence or semi-subsistence) at national level and more specifically at the level of the case study, South Tarawa. It will be investigated how droughts put pressures on livelihood systems and how the Government tries to deal with this.
In Kiribati in general, as well as in South Tarawa, subsistence and sustainable means of livelihood were based on indigenous tree crops, namely coconut tree (Coco nuferas), pandanus tree (Pandanus tectorius), bwabwai (Cyrtosperma chamissonis), breadfruit (Artocarpus altilis) and banana (Musa). The productivity of these tree crops is dependent on a healthy environment. The coconut tree produces the important export product, copra; the pandanus tree bears fruits which were traditionally preserved for consumption especially during drought years; bwabwai is a prestigious crop; breadfruit and banana are the only fruit trees that provide varied diet from the mainstay of coconut, bwabwai, and fish (Government of Kiribati, 2007). Apart from that
9
It is an approach to enable LDCs to communicate their immediate and urgent needs for adaptation to the Conference of the Parties. The process involved in the development of the NAPA is designed to ensure the principles of stakeholder participation, country driven-ness, multidisciplinary input, complementarities to other projects, and cost effectiveness.
14
vegetables and food crops such as cabbages, tomatoes, eggplants, kumalas (sweet potatoes) amongst others contribute to the main diet in urban Tarawa and assist the islanders to have a healthy lifestyle though most of these vegetables are introduced.
In this dissertation, it is about elements or items that support peoples’ livelihood, such as natural resources base from the land and the sea. For instance, copra from coconut trees, breadfruit, bwabwai (Giant Swamp taro), vegetables, pandanus, native figs amongst others including water for personal uses are examples from land based resources whereas marine resources such as seaweed, mollusks, invertebrates and vertebrates including coastal and deepwater fish species . All these resources support people’s ways of life (either individually, socially and economically) and their existence are now being threatened by global warming impacts such as sea level rise, coastal erosion, ocean acidification, altered rainfall pattern, increasing air and sea-surface temperature and unpredictable events such as drought, storm surge and extreme high winds (PCCSP,2011). On top of that, to exacerbate the existing threat; increasing population, loss of agricultural land and overfishing had it toll on the environment in South Tarawa. It is a question, whether these supporting elements to enhance people’s livelihoods can be sustainable in the future considering the threat posed from nature especially “te mwautakataka” as stated above and this is quite a challenging on the part of the Government and other stakeholders to try to mitigate it impacts on people livelihood.
1.3 Aim and Objectives
The general aim is to analyze the negative impact of “te mwautakataka” in Kiribati in general with more emphasis on the case study, South Tarawa and then explore ways as how Government tries to deals with it. The following objectives of this study are based on this aim:-
To define drought in general and relate to the case-study-South Tarawa
To identify the threshold and magnitude of drought event in the study area, South Tarawa, Kiribati
To investigate the social, economic and environmental impact of drought in Kiribati in general with more specific to the case study on people livelihood in relation to the longest drought event including making reference to other drought events as well.
15
To explore how the Government deals with the impact of drought in the cases study especially on people livelihood with possible recommendations based on the survey from the respondents.
1.4 Significance and Rationale of the study:
The study is important because:
1. It will fill the information lacuna on “te mwautakataka” in the study area especially on it impacts on peoples’ livelihoods and Kiribati in general
2. It is hoped that it is highlight people’s perception on drought impact and this can promote further dialogue through exchanging of ideas on drought experiences between the communities, private stakeholders and the Government in order to deal with it.
3. It is hope that the Government identify the gap existed and what should be done to alleviate the impact on people’s livelihood in the study area.
4. It is hoped that it will increase the enthusiastic of local Kiribati nationals to undertake this study and to see more support from the Government to those who want to venture in this challenging initiative.
1.5 Study Methodology
Data acquisitions during the course of fieldwork were based on both qualitative and quantitative research methods. Both methodologies are very effective to depict the desired result and outcome if both employed at the same time (Patton & Cochran, 2002). In this study the questionnaires were formulated and straightforward in order for the respondents to express their views freely and this was complemented by “Te Maroro”10
approach. Such approach facilitated further exchanging and expression of views between the participants and the researcher in order to maximize the possible outcomes from the questionnaire.(see chapter 3). Furthermore, visiting Government institutions to collect data such as rainfall and temperature, information on copra
10
It is referring to a conversation between two or more people which can be either formal or informal depending on the context.
16
and fisheries production, information on Government activities to deal with climate change and drought, and other information were also sought.
A literature review was also employed to broaden the researcher’s knowledge. This was done through checking online journals, books, magazines, reports, newspapers and conference papers including library sources such as books, magazines amongst others including visiting other online database and institutions.
“Te Maroro approach” were organized including taking photographs with Key Informants11
in order to get as much information that related to the purpose of this thesis.
The study area was South Tarawa since it is the most populous island in the country where more than half of the total population of Kiribati residing according to the 2010 Census Report (SPC & KNSO., 2012). Figure 6 shows the territory of Kiribati with the location of South Tarawa. The application of Geographic Information System (GIS) such as Arc Map was employed to show the population map of South Tarawa revealed in Figure 7 including table 2 to show the total population of South Tarawa and Kiribati and the major administrative centers of South Tarawa in Table 3.
Figure 6. Map of Kiribati
(Source: PICCSP, 2011)
11
It is referring to a person who is knowledgeable about the subject or something. N
17
Table 2. Total Population of South Tarawa and Kiribati. (Source: SPC & KNSO,2010)
Table 3. Major Administrative Centre in South Tarawa.
Figure 7. Map of South Tarawa (Source: GIS Arc Map)
18
1.6 Conceptual Framework of Thesis
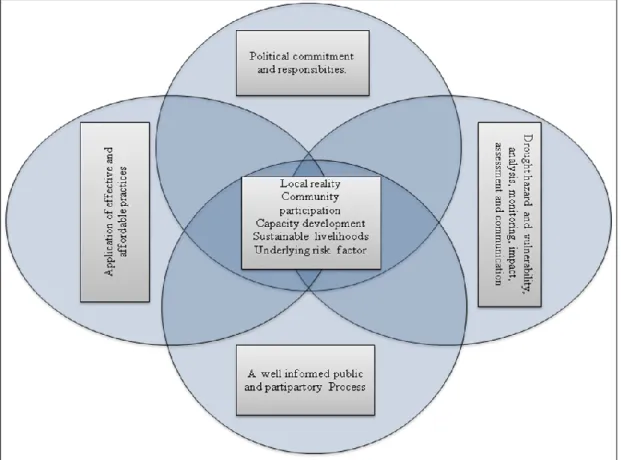
Diagram 1. Conceptual Framework of a dissertation
(Source: Adapted from Drought Risk Reduction Framework and Practices. Retrieved from http:// www.unisdr.org/files/11541_DroughtRiskReduction2009library.pd).
19
1.7 Structure of the Thesis
This thesis has five chapters. Chapter 1 consists of the introduction which deals with the research problems, framework and significance of the study. Chapter 2 describes the State of Art which discusses the theoretical part in terms of exploring the general impacts of drought from a global perspective and then focusing on the Pacific context and then to the study area. In terms of the conceptual framework of drought, the thesis looks at possible thresholds of drought that can be used to define drought in the study area. Chapter 3 describes the methodologies used for the research and fieldwork in South Tarawa. In chapter 4 the findings are analyzed and then discussed concentrating on the social-economic impact of drought in the study area. Chapter 5 finally seeks to answer questions and objectives of the research challenges and tries to come forward with possible recommendations. The last part of the thesis provides the conclusion.
21
“Books are the carriers of civilization. Without books, history is silent, literature dump, science crippled, thought and speculation at a standstill. They are engines of change, window on the world, lighthouses erected in the sea of time”. (Barbara W Tuchman, 1980)
22
24
Chapter 2
2.1. Introduction.
This chapter will discuss the state of the art in terms of the theoretical and conceptual framework of drought. As stated earlier the thesis first will discuss the general impact of drought and then the discussion concentrates on the Pacific Islands context and finally to the study area. The conceptual framework will look at how to mitigate drought impacts at national level and also glimpses at drought characteristic, definitions from the various literature including drought typologies and indices in general that can be applied and are used as thresholds to define drought also in the study area. The concluding remark will concentrate on selecting the right drought event definition and indices to be used in the study area.
2.1. Part 1: General Impact of Drought on Global Scale
Drought is one of the major natural threats among natural hazards to the people’s livelihoods and socio-economic development (UNISDR, 2009). Its effect is non-structural and covered a wide huge of areas compared to other natural hazard such as flooding, hurricanes and earthquakes and therefore quantification of its impact and provision of relief are far more difficult for droughts than for other natural hazard (Mishra & Singh, 2010). For instance, the impact of the 1988 large area of drought on the US economy had been estimated at $40 billion, which is 2-3 times the estimated loss caused by the 1989 San Francisco earthquake (Riebsame, 1991). Based on the data available from the National Climatic Data Centre (NCDC), USA in 2002, nearly 10% of the total land area of the United States experienced either severe or extreme drought at any given time during the last century (National Climatic Data Centre, 2002). In 1995, the U.S Federal Emergency Management Agency (FEMA) estimated annual losses attributable to drought at US$6-8 billion. Drought occurs somewhere in the United States each year, with an average of 12% of the nation (excluding Alaska and Hawaii) in the severe to extreme drought category. The maximum spatial extent of severe and extreme drought occurred in 1934, when 65% of the nation was affected. White and Haas estimated in 1975 that the average annual crops losses
25
associated with drought in the Great Plains of the United States estimated to be around US$700 million (Gilbert & Hass, 1975). In 1996, widespread and severe drought conditions existed in the southwest and south central states, the recurrence of drought in 1998 in this same region and its expansion into the southeast, and the return of drought in 1999 to the southwest, southeast, and south central states and its expansion into the mid-Atlantic and northeast states have raised serious concerns about our nation’s continuing vulnerability to extended periods of drought- induced water shortages. In 2000, drought again was widespread in the spring and summer months. It has resulted in severe impacts in three regions of the country: southeast and Gulf Coast, southwest and south central and central and western Corn Belt states (Wilhite & Svoboda, 2000). As a result of the vulnerability of drought to the United States, drought preparedness planning is become a significant tool for the Government at all levels to at all levels to apply to reduce the risks to future events. In the United States planning has been employed by local, state, regional, and tribal governments. In 1982, for example, only 3 states had developed drought plans. Today, 30 states have prepared drought plans and other states are at various stages of plan development (ibid, 2000)
During the past 30 years Europe has been affected by a number of major drought events, most notably in 1976 (Northern and Western Europe), 1989 (most of Europe), 1991 (most of Europe), and more recently the prolonged drought over large parts of Europe associated with the summer heat wave in 2003 (Feyen & Dankers, 2009). The most serious drought in the Iberian Peninsula in 60 years occurred in 2005, reducing overall European Union (EU) cereal yields by an estimated ten per cent (UNEP, 2006). Since 1991, the yearly average economic impact of droughts in Europe has been €5.3 billion, with the economic damage of the 2003 drought in Europe amounting to at least €8.7 billion (European Communities, 2007). This was the overall impact but to specific country and regions, it has a tremendous impact as well. For instance, in Portugal, in 2005, the country was hit by a major drought which cost the country almost $300 million euros affecting poorest villages in Southern Alentego region and destroying grain crops, tomatoes, vines, orchards and even pastures for cattle’s and affecting the level of the water in the soils. To aggravate the problem fires destroyed nearly 340,000 hectares and recorded to be the second worst drought event for forest fire. Moreover, the 2005 drought contributed to a 45 percent slump in grain output, a 20 percent fall in wine production and a fruit harvest 13 percent
26
smaller than the year before (Khalip, 2012). Likewsie in Spain the 2007-2008 drought event was the most severe of the last century and the total losses were estimated 1,661 million Euros (for a one year period), almost 1% of the Catalonian Gross Domestic Product (GDP) which affect the various sectors such as farming, gardening, swimming-pool companies and others including the direct and indirect impact to the Catalan River Basin Authority such as measures for increasing water availability and securing water supply, increasing water quality, monitoring and control activity, and public warning and communication campaigns expenses (Martin-Ortega & Markandya, 2009).
In Asia, for instance, a severe drought hit much of South-West Asia between 1999 and 2003, including Afghanistan, Kyrgyzstan, Islamic Republic of Iran, Iraq, Pakistan, Tajikistan, Turkmenistan, Uzbekistan and parts of Kazakhstan (Levinson & Waple, 2004). The persistent multi-year drought in Central and South-West Asia has affected close to 60 million people. Agriculture, animal husbandry, water resources, and public health have been particularly stressed throughout the region. Preliminary analysis suggests that the drought is related to large-scale variations in the climate across the Indian and Pacific Oceans, including the recent "La Niña" in the Eastern Pacific. In 2006, a severe drought in a region of Southern China has left 520,000 people short of drinking water and damaged crops. The drought affected areas throughout the poor, mountainous Guangxi region on China's southern coast nearly 102,000 hectares (254,000 acres) of crops were damaged, causing losses of more than 400 million RMB Yuan (US$50 million).In addition, China’s South-Western city of Chongqing, located along the upper reaches of the Yangtze River, suffered from its worst drought in half a century and Chongqing financial losses of nearly 8.04 billion RMB Yuan (US$1.04 billion). Nearly 8 million local residents had difficulty accessing drinkable water, and some 2.07 million hectares of farmland have been affected (Liu, 2007). In India, drought is a recurrent feature and had been happening since prehistoric times. Records reveal that drought affected different parts of the country affecting agriculture, livestock, water supply and people’s livelihoods and cost millions of dollars (Gupta, Tyagi, & Sehgal, 2011, p. 1795). For instance, the 1900 and 1964 drought events killed over 1 million people and affected 500,000 peoples respectively in West Bengal and Rajasthan while the drought in July 2002 affected different areas such as Uttar Pradesh, Madhya Pradesh, Rajasthan, Punjab, Haryana, Delhi, Karnataka, Kerala, Nagaland, Orissa, Chhattisgarh, Himachal
27
Pradesh, Gujarat, Maharashtra, Andhra Pradesh and Tamil Nadu affecting 300,000,000 people and caused damages worth US$ 910,721,000 (Gupta et al., 2011, p. 1798). Due to the number of droughts affecting the country the Government devised a body that coordinated all disasters relief and crisis known as the National Disaster Management Authority (NDMA) with Drought Management Cells affiliated to it to coordinate all drought relief (Government of India, 2004). In the last 20 years India has evolved many new strategies to cope with droughts by a change from a purely relief focus to the present drought management strategy. Monitoring and declaration are important components of disaster management and governance in India. Drought declaration is announced when the rainfall is –20% to –59% (early warning), –60% to 99% (drought) and – 1005 of normal (severe drought) conditions (Nagarajan, 2003). Current drought management mechanism includes institutional mechanisms, employment generation and social welfare practices, assistance and support by Central and State Governments, and operation of Early Warning System (EWS) (Gupta et al., 2011, p. 1802).
In African drought is also a recurrent feature affecting various parts of the continent at different timescale. For instance, in the arid lands of Kenya, Ethiopia and Somalia suffer from water scarcity almost on an annual basis (Jode & Tilstone, 2012). In 2011 this region experienced two consecutive failed rainy seasons, resulting in one of the worst droughts since 1950/51 in some areas, and over 12 million people affected. As seasonal water points (water pans, birkhads and shallow wells) dried up, people in these areas relied almost exclusively on deep boreholes for water. In some places people walked over 100 kilometres to access such water points and even then their access was often only possible after payment for water. As part of its emergency drought response activities in Kenya, Ethiopia and Somalia, Oxfam supported the provision of water to some members of the population who were getting less than 5 litres per person per day (the minimum quantity of water needed for survival and basic hygiene). A significant proportion of this water was provided by water trucking operations; in which water was transported via large tanker trucks from permanent water sources (boreholes accessing deep groundwater) to areas with no permanent water points. Transport distances ranged from 20 to 120kms from the water point to the final delivery point. These interventions lasted for 2 to 3 months until the rains arrived. In Kenya the 1996 to 1997 drought had a far-reaching social economic impact which includes the loss of agricultural production, food, energy and water shortages, mass migration of
28
population and animals and conflict over limited water resources within some dryland location (Ogallo, 2000). Similarly in Darfur, Sudan, the 1998 drought had caused mass migration, conflict and war between ethnic groups to seize or protect scarce water and food supplies. As a result of this drought-induced famine, more than 70,000 people were killed due to starvation, hunger and conflict (Sachs, 2006).
In Australia drought was also a recurring theme with the most recent, the so called ‘millennium’ drought, having lasted for almost a decade (Bonds, Lake, & Arthington, 2008). This severe drought had affected most of Southern and Eastern Australia and was regarded as one of the worst in the region since European settlement (Murphy & Timbal, 2008), with many rivers experiencing record low flows over this period in some cases almost 40% below previous records (European Commission, 2007) and the annual rainfall recorded during that time was 40-60% below the annual normal rainfall (Australian Bureau of Statistic, 2010), thus decreasing Sydney’s largest reservoir to 40 % full and many rural towns in east Australia face shortages within a month (Vidal, 2006). The Australian Bureau of Agriculture and Resource Economics estimates that the 2006 drought reduced the national winter cereal crop by 36% and cost rural Australia around AUD $3.5 billion, leaving many farmers in financial crisis including business communities in New South Wales, Victoria, South Australia and Queensland(Wong, Lambert, Leonard, & Metcalfe, 2009). It reduced the country’s economic growth by around 0.75 percent and restrictions on water use affected more than 80 percent of Australian households and therefore the Government made a prompt action by convening an emergency water summit in Canberra and allocated AUD200m to businesses which service drought-stricken area and making payment of AUD91m to the affected farmers (ABM, 2010).
In the Pacific islands such as Tuvalu drought threatening the population of over 10,000 in 2011 and therefore the Government declared a state of emergency due to the shortage of water and breakdown of the desalination plant and outbreak of gastroenteritis diseases such as diarrheoa, nausea, vomiting, crampy and abdominal pain (Manhire, 2011). Similarly in Fiji, the 1986-1987 drought was the worst drought affecting different part of the country and affecting the water supply especially in rural areas and therefore water restrcition was enforced. Additionally the agricultural sector was affected especially the sugar cane and there was fire outbreak (Pahalad, Gosai, & McGree, 2003). Moreover, the 1998 Fiji drought severely impacted 40% of the
29
country’s sugarcane crops and directly impacted an estimated 28000 households (Morrell & Scialabba, 2009). In Marshal Islands, the 1998 drought had a tremendous impact on the thickness of the water lens thus affected the quality and quantity of the water lens. The consequence, there was a severe drinking shortage on Majuro Island and therefore the President of the Republic of Marshal Islands requested emergency disaster assistance from the United States to alleviate the problem (Presley, 2005). In South Tarawa, Kiribati, the 1998-1999 drought was the worst drought as far as the rainfall data from 1947 to 1999 was concerned although there were other severe droughts prior to this period such as in 1949-1950, 1973-1974, 1989-1990 and 1998-1999 and its effect on the enviroment was tremendous especically well water turn saline in some areas, dry ground create floating dust thus created sicknesses such as pink eyes,asthma and diarrhoea, poor growth of breadfruit and coconut trees and even vegetables died (Republic of Kiribati Country Report, 2009). In addition, the drought of 1998 to 2001 decreases the thickness of large freshwater lenses and increases the salinity of fresh groundwater in the combined groundwater pumped from Buota and Bonriki groundwater reserves (White et al., 2007). Although the electrical conductivity peaked at approximately 1000 microsiemen per cm at the end of 2001, the water was still acceptable for domestic use. Furthermore, the license revenue from the fishing distant fleets’ fee fell from A$40.3 million in 1998 as the EL Nino impact was felt, to A$31.8 million during the La Nina in 1999 and then decreasing again to A$17.2 million in 2000 according to the National Development Strategy (NDS) (2000) as mentioned by Thomas (2003,pg 15). Likewise, the copra production decreased from $9 million in 1998 to A$1.1 million in 2005 (FAO, 2012). Another similar reporting that shows the decline in exports of copra, fish and seaweed fell each year from $14m in 1999 to $7m in 2002 (Republic of Kiribati, 2003).
As a result of drought related impact worldwide, the government established the Drought Committee (DC) comprised of various government agencies with their various responsibilities during drought which was coordinated by the National Disaster Management Office (NDMO) located at the President Office/Headquarter. (Refer to chapter 5 for further details).
30
2.1. Part 2: The Conceptual Framework of Drought Risk Reduction
Figure 8. The Conceptual Framework of Drought Risk Reduction
(Source: UNISDR, 2009)
The Conceptual framework at figure 8 above looks at Governance and Policy at the apex in term of political commitment and responsibilities. This is a crucial element for drought risk management as drought risk planning is monitored, directed and managed by the Government through a statutory body which communicating to the general public if risks identify from the oncoming drought and therefore issue early warning. The general public should know what to do to protect their property and manage water wisely based on public awareness and education conducted before by the Drought Task force for instance. This will lessen impact and at the same time develop a resilient communities based on capacity building through a participatory workshop. So political commitment, high level commitment, strong institutions mechanisms