Nova School of Business and Economics
International Masters in Management
Master Thesis
The Role of Business Model Innovation in the
Relationship of Open Innovation and Innovation
Performance in a Dynamic Environment
Author (ID):
Matthäus Wilga (31799)
Supervision:
Dr. João Castro
Dr. Paul Hünermund
Acknowledgements
To my lady and friends, who offered support. To my parents, who made it possible to grasp the opportunities I did with the bold steps you made and the hard work you did throughout your life. To Dr. Paul Hünermund, for the generous support as well as challenges in the composition of this thesis and for the provision of the education-use MIP dataset.
Abstract
Business model innovation has gained attention in research and practice, but its antecedents and other outcomes than firm performance remain underresearched. Business model innovation can happen through the introduction of new resources, which open innovation practices could pro-vide, and is an important companion of innovations, which is argued to lift their performance. Hence this study tests a potential mediation of the effect of open innovation on innovation per-formance through business model innovation and validates a claimed particular effectiveness of open innovation and business model innovation on the success of innovations in technolog-ically turbulent environments using a dataset of 471 firms from the German contribution to the European Community Innovation Survey. This paper finds that business model innovation ben-efits from the engagement of a firm in open innovation and that the use of business model innovation positively relates to the success of a firm’s innovations in both technologically stable and turbulent environments. Business model innovation furthermore facilitates the beneficial effect of open innovation on innovation performance. Finally, technological turbulence does neither moderate the relation of OI nor the one of BMI to innovation performance. The findings offer managers important insights for the success of new products as well as guidance for the effective utilization of open innovation practices.
List of Contents
Acknowledgements ... II Abstract ... III List of Contents ... IV List of Tables ... VI List of Figures ... VII List of Abbreviations ... VIII
1 Introduction ... 1
2 Theory and Hypotheses ... 5
2.1 Theoretical Background and Definitions ... 5
2.2 Hypotheses ... 10
3 Methodology ... 18
3.1 Data Source and Sample ... 18
3.2 Measurements ... 19 3.3 Analytical Strategy ... 23 4 Results ... 26 4.1 Descriptive Statistics ... 26 4.2 Bivariate Analysis ... 27 4.3 Hypothesis Tests ... 28
4.3.1 Mediation Analysis Following the Procedure of Baron and Kenny ... 28
4.3.2 Mediation Analysis Following the Procedure of Imai, Keele and Tingley ... 30
4.3.3 Analysis of the Moderation of Technological Turbulence... 32
4.4 Conclusion ... 33 4.5 Limitations ... 34 5 Discussion ... 36 5.1 Theoretical Implications ... 36 5.2 Practical Implications ... 39 5.3 Future Research... 41 6 Conclusion ... 43
References ... 45
Appendix A – Questionnaire Items Related to the Relevant Variables ... 61
Appendix B – Operationalization of Concepts ... 63
List of Tables
Table 1 - Descriptive Statistics ... 26
Table 2 - Matrix with Spearman’s Rank Correlation Coefficients ... 27
Table 3 - Models of the Mediation Analysis Following Baron and Kenny (1986) ... 29
Table 4 - Logit Mediator Model of the Non-linear Mediation Analysis ... 31
Table 5 - Mediation Analysis Results Following the Procedure of Imai, Keele and Tingley . 31 Table 6 - Analysis of Moderation Effects ... 33
Table 7 - CIS Questions Related to the Relevant Variables ... 61
Table 8 - Operationalization of Concepts ... 63
List of Figures
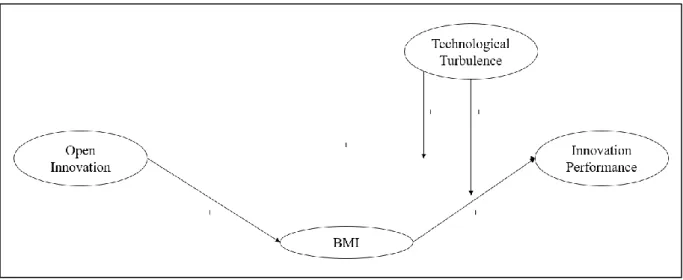
Figure 1 - Conceptual Model ... 17 Figure 2 - Path Diagram for the Baron and Kenny Procedure with Results ... 29 Figure 3 - Sensitivity Analysis ... 32
List of Abbreviations
ACME Average causal mediation effect
ADE Average direct effect
BMI Business model innovation
CIS Community Innovation Survey
DC Dynamic capability
DCV Dynamic capabilities view
EIU The Economist Intelligence Unit
ICT Information and communications technology
MIP Mannheim Innovation Panel
OECD Organisation for Economic Co-operation and Development
OI Open innovation
RBV Resource-based view
SIA Sequential ignorability assumption
1
Introduction
Swift & Co. innovated the meat selling business model by shipping packed meat instead of live cattle, which enabled high-scale central slaughter that reduced costs and thereby sparked sales (Teece, 2010, p. 176). This example from the 1870s presents business model innovation (BMI), which would not have been possible without cooperation with refrigerator builders, railway companies or local warehouses in the development and operation of cooled carriages and stor-ages. It shows that cooperation in development exists since early times, but garnered scientific attention only around the 1970s (West et al., 2014, p. 806). ICT is a catalyst for the recent proliferation of this practice, as it fosters knowledge flows between even more distant partners (Gassmann, 2006; Vanhaverbeke, 2006). Chesbrough (2003, 2006b) observed that mobility in expertise and workers contributed to a shift from the closed innovation paradigm dominated by rich corporate giants, which mostly focus on strong internal R&D, to the open innovation (OI) paradigm, which is the development of products and services in a cooperation between a focal firm and customers, suppliers, universities or others.
Equally, though practiced for so long, BMI receives considerable research attention only since 15 years (Foss & Saebi, 2017), which partly stems from many recent examples thereof an evo-lution of ICT and e-business provided (Amit & Zott, 2001; Casadesus-Masanell & Ricart, 2010). BMI nonetheless gained interest in business and research, which underpins the relevance of studies thereof. In practice, plenty anecdotal evidence points to success from BMI in firms like Dell, Hilti or Rolls Royce (e.g. Johnson et al., 2008; Teece, 2010; Visnjic et al., 2016) and non-scientific surveys capture its importance on manager agendas (EIU, 2005; IBM, 2008) as well as better financial results of BMI-emphasizing firms (IBM, 2006; Lindgardt et al., 2009). Similarly, in research, BMI is widely shown to benefit firm performance in case studies (Sosna et al., 2010; Demil & Lecocq, 2010) as well as in quantitative research (Cucculelli & Bettinelli,
2015; Hartmann et al., 2013; Heij et al., 2014; Zott & Amit, 2007, 2008) and is even posited to lead to competitive advantage (Casadesus-Masanell & Zhu, 2013; Mitchell & Coles, 2003). However, there is still much to learn focusing on constituents of firm performance. For instance, while innovation is a major contributor to firm success (Crépon et al., 1998) and BMI is argued to be an important companion of new technologies (Chesbrough & Rosenbloom, 2002; Teece, 2010), there is scant evidence of the effect of BMI on the more granular level of innovation performance, with solely two studies finding a positive effect but confined to the Austrian and Swedish context (Bengtsson & Tavassoli, 2018; Waldner et al., 2015). Similarly, there is still no clear view about drivers of BMI (Foss & Saebi, 2017; Schneider & Spieth, 2013). Qualitative studies forward that experimentation and trial-and-error learning support BMI through an in-crease in ideas, knowledge and capabilities (McGrath, 2010; Sosna et al., 2010). However, OI, a source of such resources, is mostly omitted as an antecedent of BMI, thus called for to be researched (Foss & Saebi, 2017). Moreover, since BMI is conceptualized to need an inflow of resources and ideas, and as OI is a source thereof while itself in need of a translator for its input, and as both concepts share a positive impact on innovation performance (Bengtsson & Tavassoli, 2018; Greco et al., 2015; Waldner et al., 2015), there might exist a yet to be re-searched indirect effect of OI on innovation performance via BMI. Finally, since OI entails an explorative orientation (Dahlander & Gann, 2010; Huizingh, 2011; Randhawa et al., 2016) and BMI involves a certain profoundness in changes (Foss & Saebi, 2017), which are two attributes considered to be necessary and valuable in dynamic environments (Gupta et al., 2006; Teece et al., 1997), both OI and BMI are forwarded as powerful solutions for especially those turbulent settings (Gassmann, 2006; Hamel & Välikangas, 2003; Huizingh, 2011; Saebi, 2015). This ad-vice, however, is largely conceptual, as hardly quantitative studies on contingencies in the in-novation-performance relationship exist although research thereof is oft-demanded for both concepts (Foss & Saebi, 2017; Saebi, 2015; West & Bogers, 2014). Strikingly, there is
particularly little insight on the environmental dynamism component technological turbulence, although technological developments can simplify or even enable OI (Dahlander & Gann, 2010; Dodgson et al., 2006) and often provide a context for case studies on BMI (Schneider & Spieth, 2013; Wirtz et al., 2016a). Closing this research gap can uncover whether the concepts benefit innovations in technological turbulence and really are more effective in those situations. Those deliberations lead to the research question “What is the role of business model innovation
in the relation of open innovation and innovation performance?” and sub-question “How does
technological turbulence influence the relation of open innovation with innovation performance and the relation of business model innovation with innovation performance?”. In a pursuit to
answer these questions, this paper refers to the resource-based view (RBV) (Barney, 1991; Pe-teraf, 1993) and dynamic capabilities view (DCV) (Eisenhardt & Martin, 2000; Teece et al., 1997) but with the loosened assumptions of the business model concept (Massa et al., 2017). It builds a mediation model based on an argumentation that engagement in OI fosters BMI through its provision of resources and ideas for a recombination thereof, and that BMI benefits the success of innovations by creating a better fit of resources with their context. The moderator technological turbulence is introduced based on arguments about the particular effectiveness of OI and BMI in turbulent environments, as they are posited to counter the uncertainty and short product cycles constituting those settings. The mediation model, which also allows to study relations of OI and BMI to innovation performance, and interactions are tested using a repre-sentative sample of 471 firms from the 2013 German Mannheim Innovation Panel (MIP), which provides the German contribution to the European Community Innovation Survey (CIS). In doing so, this paper forwards theory and managerial practice with several insights. Firstly, the demonstration of an indirect effect of OI on innovation performance via BMI contributes to research by introducing a new mechanism to the OI framework and, in linking OI with BMI, this paper also responds to criticism of OI literature hardly referring to the business model
concept (West & Bogers, 2014), although it is part of its theoretical underpinning and a main distinction to past research in this field (West et al., 2014). This finding endows practitioners aiming to elevate their innovative success with another vantage point and expands the yet un-derdeveloped general management contribution of OI (West et al., 2014).
Secondly, in response to recent calls for the research thereof (Foss & Saebi, 2017), this study provides a strong, while not definite, argument to forward OI as an antecedent that leads to BMI in demonstrating a positive relation of OI to BMI. Together with the validation of a previously found relation between BMI and innovation performance with a third BMI measure in another local context, this thesis contributes to the establishment of a BMI causal web by illustrating antecedents as well as outcomes of BMI. Moreover, it adds to the to date rather marginal body of quantitative BMI studies. By 2016, merely 17 % of BMI papers were quantitative ones, leaving an ample research gap in an area dominated by qualitative studies (Wirtz et al., 2016a, pp. 7-9), which lack generalizability. Furthermore, this paper provides another BMI measure to be used with the multinationally gathered CIS and thereby forwards an important contribution to the academic discourse on a common way to measure BMI and responds to calls to use valuable CIS data with more complex measures (Arundel, 2007). The use of the MIP dataset, which includes many industries and firms of all sizes, also counters gaps in OI and BMI re-search, which largely omitted SMEs and low-tech industries (Gassmann et al., 2010; Schneider & Spieth, 2013; Van de Vrande et al., 2010).
Thirdly, this study cannot support earlier claims on a conceptual basis that portray OI and BMI as important practices especially in dynamic environments, as it finds a non-significant inter-action of OI as well as BMI with technological turbulence. However, BMI is thereby shown to have a positive effect regardless of the technological turbulence, which is of practical relevance since it shows that BMI is positively related to innovation performance also in stable environ-ments and hence offers managers the option to apply BMI on a wider array of situations.
2
Theory and Hypotheses
While papers on OI show little cross-citation to other fields (Randhawa et al., 2016), delibera-tions on the business model and the innovation thereof are often based on the RBV and DCV (George & Bock, 2011; Schneider & Spieth, 2013), although certain assumptions are loosened (Massa et al., 2017). This section will ground the main concepts of this study in theory and apprehend the difficult task to define those abstract constructs.
2.1 Theoretical Background and Definitions
A recent review has shown that OI is a more studied field than BMI, with 1,700 publications in Scopus compared to 349 (Foss & Saebi, 2017, p. 203). This might explain why, contrary to the BMI field, research has mostly aligned on attributes of OI. Chesbrough and Bogers (2014) re-fined Chesbrough’s (2003, 2006a) initial OI definitions to capture the most important facets of open innovation discussed over years and defined it as “a distributed innovation process based on purposively managed knowledge flows across organizational boundaries, using pecuniary and non-pecuniary mechanisms in line with the organization’s business model” (p. 12).
The attribute “distributed” captures that knowledge is created in dispersed loci of the economy (Chesbrough & Bogers, 2014, p. 9), but can be obtained using forms of cooperation like dyads, networks (Vanhaverbeke, 2006), alliances, platforms (Pisano & Verganti, 2008) or communi-ties (West & Lakhani, 2008). Moreover, it depicts that insights can permeate firm boundaries bidirectionally in a deliberately conducted action, thus OI can refer to an inbound flux of exter-nal ideas, knowledge or market-ready products, or to a deliberate outflow of interexter-nal develop-ments for external commercialization (Chesbrough, 2003, 2006b), or even to both outbound and inbound flows in a coupled mode (Gassmann & Enkel, 2004). Since this paper focuses on the internal commercialization of innovations, only the inbound facet of OI will be in scope, which is also the most common one (Gassmann et al., 2010). The detail that mechanisms can involve monetary exchange or not captures that exchange processes can be formally agreed, in
this case often involve payments, or of informal nature, with less agreement about economic terms and appropriation of gains (Dahlander & Gann, 2010; Elmquist et al., 2009).
The consideration of business models in the commercialization of OI inputs, which Chesbrough (2003, 2006b) demands, discerns OI from common understandings of interfirm development cooperation and hints at the need to leverage this concept in studies of the effect of OI on the commercial performance of its outcomes (West & Bogers, 2014). Strikingly, merely 30 % of OI papers consider this concept, often peripherally (West & Bogers, 2014, p. 823), which might partly owe to the lack of a common definition, and thus heterogeneous view on business models.
The Business Model Concept and its Theoretical Background
Every firm has a business model (Casadesus-Masanell & Ricart, 2010; Chesbrough, 2007a), which makes it an oft-studied topic in research and practice alike (Klang et al., 2014; Massa et al., 2017; Wirtz et al., 2016b). Yet there is no agreement on a definition (Demil et al., 2015; George & Bock, 2011) and also many papers using the concept do not properly define it (Massa et al., 2017; Zott et al., 2011). The divergent definitions might stem from the complexity of the concept and because it has been approached from specific subjects (Massa et al., 2017), like e-business (e.g. Zott & Amit, 2007) or sustainability (e.g. Schaltegger et al., 2012). This kaleido-scope of views yields definitions with divergent numbers of components (Morris et al., 2005) and diverse contents those elements describe: Clauss (2017) found 73 content-wise different elements under 120 names. Given this inconsistency, factors allowing to reach an inclusive but still overseeable definition must be found in a different way. One can be to look at common phenomena business models have been used to explain, which are mainly value creation, per-formance and competitive advantage (Zott et al., 2011, p. 1029). Because the latter two are also a major focus of strategy theories like the RBV or the positioning view (Barney, 1991; Peteraf, 1993; Porter, 1979, 1996), the business model concept is often criticized as being too close to strategy to be a separate field (Markides, 2015; Porter, 2001). However, this concept is argued
to go beyond the core strategic topic of value capture (Zott et al., 2011), and explaining how might rebut this criticism while paving the way to a definition.
The RBV is argued to provide a theoretical basis for the business model concept (Amit & Zott, 2011; Schneider & Spieth, 2013). It seeks to explain the heterogeneity of firm results by looking at their different composition of resources, which can be monetary, physical or human assets or knowledge and should be owned or controlled by the firm (Amit & Schoemaker, 1993; Barney, 1991). These resources can lead to a sustained competitive advantage if they are unique, rare, imitable and non-substitutable and if they are used to implement strategies, which cannot be paralleled by existing or future rivals (Barney, 1991; Peteraf, 1993). However, the RBV focuses on value capture only for the focal firm, is criticized to neglect value creation over capture and disregards that value can also be created outside the firm (Adner & Kapoor, 2010; Massa et al., 2017). In turn, business model proponents argue that value is not only captured by shareholders, so the firm itself, but also other stakeholders and that value can be created on the customer-side as well, not only by producers as in the RBV (Massa et al., 2017). Moreover, the RBV struggles to answer how to properly use resources (Priem & Butler, 2001a) and strategy theories often neglect that value needs to be delivered to customers (Massa et al., 2017; Zott et al., 2011). In turn, this issue is central to the business model, as it is forwarded as a mean for better asset utilization leading to improved customer value delivery (Afuah & Tucci, 2001) and is seen as a mediator between inputs and economic outputs (Chesbrough & Rosenbloom, 2002).
This shows that the business model concept deals with value creation and capture as its basis in theory, the RBV, but under relaxed assumptions. As it augments the RBV by also considering value delivery, which concurs with a certain consensus that the business model shall be about value creation, delivery and capture (Desyllas & Sako, 2013), it is justified to follow Teece (2010) in stating that “a business model defines how the enterprise creates and delivers value to customers, and then converts payments received to profits” (p. 173). This definition with three elements is broad enough to serve the diverse industries in this study, but in turn not too
open, thus accounting for a criticism of business model definitions being too inclusive (Arend, 2013). Teece’s view can be complemented by Zott and Amit’s (2010) one of a business model as a “set of activities, as well as the resources and capabilities to perform them—either within the firm, or beyond it through cooperation with partners, suppliers or customers” (p. 217). It reflects the business model concept’s theoretical basis in the RBV, as it concurs with it in seeing the firm as a set of resources, but also stresses the loosened assumptions in comparison to it, namely that the locus of value creation and capture as well as resources for it can be external. The business model conceptualization in this section is not only open to the integration of ex-ternal resources, for instance through OI, but also provides a theoretical basis for the following description of business model innovation, which in essence is the recombination of the re-sources and capabilities forwarded as constituting a business model (Schneider & Spieth, 2013).
Business Model Innovation
Both the business model concept and RBV are rather static views, which have a reduced ex-planatory value for fast-changing environments, as a changing context can erode the value of assets and as the resource base determines the possible moves in a path-dependent manner, which can inhibit necessary actions (Demil & Lecoqc, 2010; Eisenhardt & Martin, 2000; Teece et al., 1997). As a reaction, the RBV has been augmented with the view that a firm needs dy-namic capabilities, which are capabilities allowing to rearrange the resource base, to build new assets or to strip futile ones in order to attain or maintain competitive advantage in a changing context (Eisenhardt & Martin, 2000; Teece et al., 1997). Since BMI is mostly agreed to be concerned with a reorganization of existing resources or introduction of new ones (Schneider & Spieth, 2013) to increase fit with a setting or re-establish it with an altered one (Teece, 2010), some authors see it as a dynamic capability (Achtenhagen et al., 2013; Mezger, 2014; Saebi, 2015; Zott et al., 2011). Hence, besides from being a useful concept that allows classification based on empirically researched types (Massa et al., 2017) or an analysis of a firm’s status quo
(Demil & Lecocq, 2010), the business model can also be an own subject of innovation (Casadesus-Masanell & Zhu, 2013; Massa & Tucci, 2014; Mitchell & Coles, 2003). However, stemming partly from the diverse conceptions of the underlying business model concept, there is also no consensus on a BMI definition (Foss & Saebi, 2017; Schneider & Spieth 2013). Crucial distinctions in BMI definitions are found in the novelty, profoundness and scope of changes (Foss & Saebi, 2017, 2018; Taran et al., 2015; Wirtz et al., 2016a). In terms of novelty, some authors argue that changes should be new to the firm (e.g. Amit & Zott, 2010; Björkdahl & Holmén, 2013; Bock et al., 2012; Osterwalder et al., 2005; Spieth & Schneider, 2016) while others insist that they shall be at least new to the market or industry (e.g. Johnson et al., 2008; Santos et al., 2009; Snihur & Zott, 2013). Arguments on the profoundness of change are often related to the novelty dimension and revolve around incremental and radical changes, with some authors claiming already the former to constitute BMI (e.g. Amit & Zott, 2012; Bucherer et al., 2012) while others demand radical changes to maintain the character of an innovation (e.g. Comes & Berniker, 2008; Johnson et al., 2008). Finally, there is dissent about the scope of change needed to qualify as BMI. This debate is about the number of changed business model elements, ranging from a single one (e.g. Amit & Zott, 2012; Hartmann et al., 2013), two or more (e.g. Lindgardt et al., 2009), to most or all elements (e.g. Johnson et al., 2008; Yunus et al., 2010). This discord will be the hardest to resolve, since definitions of the underlying busi-ness model construct use different terms for the elements of a busibusi-ness model (Fielt, 2012) and often encompass a varying number of elements, mostly four to eight (Morris et al., 2005). While those diverse conceptualizations will not be reconciled by this paper, they deserve atten-tion in the choice of a working definiatten-tion. This study will use the one Foss and Saebi (2017) developed after an extensive review of BMI literature, which describes business model innova-tion as “designed, novel, and non-trivial changes to the key elements of a firm's business model and/or the architecture linking these elements.” (p. 216). BMI should be “designed”, so result from deliberate managerial action (Foss & Saebi, 2017, p. 216), which excludes unintended,
random changes. The novelty condition is included to maintain its character as an innovation (Foss & Saebi, 2017, p. 216), but, considering the previous discussion, needs to be further spec-ified. In this study, changes will be novel if they are new to the firm or lead to significant improvements within it, which is the baseline novelty condition for an innovation in the Oslo Manual (OECD, 2005) and also includes incremental change. Moreover, changes must be “non-trivial” to filter out common operational alteration like a horizontal supplier switch (Foss & Saebi, 2017, p. 216). Finally, in terms of scope, this paper requires change in all three key elements of the earlier business model definition, namely value creation, delivery and capture.
2.2 Hypotheses
Several studies have shown positive effects of OI practices on innovation performance through-out diverse industrial as well as regional settings and firm sizes (Berchicci, 2013; Caloghirou et al., 2004; Greco et al., 2015; Sofka & Grimpe, 2010). A positive impact of cooperation on innovation performance has also been presented for a diverse set of partners, like customers (Lau et al., 2010), suppliers (Sofka & Grimpe, 2010) or universities (Faems et al., 2005), but the one of competitors is ambivalent (Greco et al., 2015). The turnover formula price times sales shows levers how OI can spur innovation success proxied as innovation turnover in this paper. OI yields market insights (Bogers & West, 2012), thereby enables firms to craft products more aligned with client needs, which allows higher prices as more benefits are offered (Afuah & Tucci, 2013), or ones built to suit a larger market (Chesbrough, 2003), which can raise sales. Sales can also increase as OI allows firms to develop more products (Gassmann, 2006) through access to R&D knowledge pools beyond ones to be built with own resources (West & Bogers, 2014). Moreover, OI can open access to complementary assets, which foster innovation success by aiding its commercialization (Hagedoorn, 1993; Teece, 1986), and can prevent missing new businesses or complementarities of new technologies with current ones (Chesbrough, 2003), which may happen if firms only focus on present clients and businesses (Enkel et al., 2005).
Nevertheless, profiting from OI is not fully straightforward. Benefits of cooperation are shown to decrease after a certain threshold in the number of cooperation partners due to marginal costs from coordination exceeding the marginal benefits (Laursen & Salter, 2006) or redundancy of knowledge (Burt, 1992). Moreover, while OI is argued to prevent oversight of opportunities (Chesbrough, 2003), overuse thereof can lead to more information than the limited attention of a manager can handle (Bogers et al., 2018). In fact, cooperation can even entail negative effects, for example lead to unintended knowledge spillover (Cassiman & Veugelers, 2002; Enkel et al., 2009) or a disadvantage in value capture if a partner has better complementary assets for the commercialization of a jointly developed innovation (Laursen & Salter, 2014; Teece, 1986). But as these impediments are known and can thus mostly be taken into account by firms plan-ning to cooperate, an overall positive effect of OI on innovation performance is hypothesized:
Hypothesis 1: Open innovation will be positively related to innovation performance.
Reviews on BMI forward OI as an antecedent of BMI and call for studies of this relation (Foss & Saebi, 2017; Massa & Tucci, 2014). Theory can indeed link the two concepts. DCs can be divided into abilities to sense and seize opportunities and ones transforming the resource base (Teece, 2007), with BMI fitting the seize as well as transform category. While OI is rather not a DC since it describes a state of firms, namely engagement in R&D cooperation, it nonetheless entails practices which can constitute the organizational processes that Teece (2018) posits to aid the capability to sense opportunities to be seized by the DC BMI. Firstly, BMI can happen through an influx of new resources or a recombination of current ones (Demil et al., 2015) in a process argued to entail experimentation (McGrath, 2010) or trial-and-error learning (Sosna et al., 2010). OI can supply resources or facilitate access to them and yield ideas (Van de Vrande et al., 2009; West & Bogers, 2014) to recombine existing assets or inspire experiments. Sec-ondly, business models must be crafted with respect to the surrounding setting (Teece, 2010), thus it is argued that leaders must know customer needs and the market for successful BMI
(Demil et al., 2015). It is claimed that environmental scanning is a prerequisite of adaption to the external context (Jennings & Lumpkin, 1992) and that sensed shifts in customer demands spark BMI (Osterwalder, 2004), hence OI can aid BMI, as it is a source for insights about customer needsand market knowledge (Bogers & West, 2012).
Thirdly, OI can clear barriers to BMI, like a dominant logic and inertia or lack of managerial foresight (Chesbrough, 2010; Zott & Amit, 2007). While a clear business model fosters efficient decisions in complex settings by filtering and structuring insights, it can thereby become a dom-inant logic, which can lead to inertia and omit crucial information deemed irrelevant by the current cognitive structure (Chesbrough, 2010; Chesbrough & Rosenbloom, 2002; Prahalad & Bettis, 1986). The scanning entailed in OI practices helps to assess the importance of inputs (Hagen et al., 2003) and exposes leaders to contradicting views that can lead to reinterpretation of contexts as well as the business model (Berends et al., 2016), which can overturn the domi-nant logic of successful business models, and sensitizes managers’ narrow foresight to oppor-tunities and threats, which are argued to stimulate BMI (Bucherer et al., 2012; Saebi et al., 2017). Moreover, the required openness in the structure, culture and mindset in the adoption of OI (Chesbrough 2006a, 2007b; Gassmann et al., 2010; West & Bogers, 2014) constitutes a beneficial setting for BMI as well (Kaplan, 2012; Santos et al., 2009). Thus, as in the RBV and DCV an alteration of a firm’s resource base constitutes BMI and OI offers access to new assets as well as creative ideas to perform this act while also removes barriers to BMI, it is hypothe-sized:
Hypothesis 2: Open innovation will be positively related to use of business model innovation.
BMI is shown to benefit firm results in diverse industries and locales (Brettel et al., 2012; Cucculelli & Bettinelli, 2015; Hartmann et al., 2013; Heij et al., 2014; Huang et al., 2012; Zott & Amit, 2007). Linking this finding to a significant contribution of innovation performance to firm success (Crépon et al., 1998) allows to think whether the BMI impact on firm results partly
stems from a positive influence of it on innovation success. Firstly, in a firm’s present market, BMI is argued to uncover new facets of innovations, thereby satisfy unmet needs and provide more benefits (Johnson, 2010; Markides, 2006), which can raise sales or allow higher prices. BMI can also deliver value to omitted customers (Amit & Zott, 2012; Johnson et al., 2008) for whom an offer was too pricey, too complex to handle or if consumers were too distant (Johnson, 2010). Similarly, BMI can help to protrude new markets (Amit & Zott, 2012; Giesen et al., 2007; Johnson, 2010), which just as new clients in present ones can boost innovation sales. Secondly, business models are conceptually placed between the latent value of technologies, which has to be unveiled with a suitable business model, and the economic output in form of perceived and prescribed value by the client (Chesbrough & Rosenbloom, 2002; Teece, 2010). These business models can, for instance, be innovated to facilitate cheaper access to a product or service (Johnson, 2010; Teece, 2010), which can lead to lower prices and thus spur sales through a more efficient use of resources. BMI can also create links to external sources of value or uncover value through complementarity with other business models (Amit & Zott, 2001; Snihur & Zott, 2014), which can allow a more effective use of resources. Finally, as firms react to customer demand shifts by innovating products, they concurrently must innovate the business model to re-install its fit with the new product to ensure proper value delivery (Teece, 2010). Third, business model literature is accused of bias towards value creation over capture (Leih et al., 2015; Shafer et al., 2005), but the latter is crucial, as value delivered will not convert by itself to payments (Teece, 2010). BMI can benefit innovations by promoting novel methods to get paid for created value, just as advertiser fees allow Google to offer customers its search for free (Teece, 2010, p. 181). BMI is even argued to bear the potential of superior value creation and capture, hence competitive advantage (Björkdahl, 2009; Chesbrough, 2007a; McGrath, 2010). This advantage could even be a sustained one, as the imitation of a business model can be difficult due to its unique set of assets and partners, which also have to fit firms’ culture and strategy (Amit & Zott, 2012; Bucherer et al., 2012). Business model complexity can also create
causal ambiguity, an uncertainty around causes for certain outcomes as framed by Lippman and Rummelt (1982), which further repels imitation (Desyllas & Sako, 2013; Foss & Saebi, 2017; Snihur & Zott, 2013). While these thoughts base on the RBV in focusing on a rare, inimitable resource set resulting from BMI, also BMI itself is inimitable, since DCs develop from unique internal routines and learnings of a firm (Teece, 2012). Given these arguments, this paper as-sumes a positive relation of BMI to innovation success. It follows Waldner et al. (2015), who show a positive relation of firms’ BMI level to the share of new product sales using a repre-sentative CIS sample of 1,242 Austrian firms, as well as Bengtsson and Tavassoli (2018), who in a longitudinal study of representative CIS samples of Swedish firms find that BMI increases innovation success proxied as new product sales per employee.
Hypothesis 3: The utilization of business model innovation will be positively related to innova-tion performance.
OI is posited to benefit innovation performance through the R&D knowledge for increased in-novation and the market-ready products it provides (Gassmann, 2006; Van de Vrande et al., 2009; West & Bogers, 2014). It is further argued that these new technologies need an adapted business model to prosper (Chesbrough & Rosenbloom, 2002; Teece, 2010). Since OI is also forwarded as a driver of this BMI (Foss & Saebi, 2017), which is demonstrated to have a posi-tive effect on innovation performance (Bengtsson & Tavassoli, 2018; Waldner et al., 2015) just as OI itself does (Greco et al., 2015), it can be supposed that part of the positive effect of OI on innovation performance is routed via BMI which OI practices facilitate. Hence, following sug-gestions that business models should be used to better understand the effects of OI (Bogers et al., 2016) and that BMI is needed to appropriate the value created by OI practices (Lambert & Davidson, 2013; Randhawa et al., 2016), it is hypothesized:
Hypothesis 4: The positive relationship between open innovation and innovation performance will be mediated by business model innovation.
Examining the Influence of Technological Turbulence
OI and BMI are argued to be very important in fast-changing, uncertain settings (Bogers et al., 2016; de Reuver et al., 2009; Spieth & Schneider, 2016). Environmental dynamism describes frequent and significant changes, which are hard to anticipate, entail uncertainty and happen within various strata of the business context (Dess & Beard, 1984). It is a phenomenon com-posed of competitive intensity, which is shaped by competitor acts, market turbulence, which refers to fluctuating customer desires, and technological turbulence, which is frequent change in products and their means of production (Jaworski & Kohli, 1993; Kohli & Jaworski, 1990; Miller, 1987). Although all components could moderate the relationship of OI and BMI with innovation performance, particularly technological turbulence will be studied, since this study’s context are firms performing product innovation, which often has a strong technological com-ponent and can thus be assumed to be affected especially by this dynamism comcom-ponent. Hence this paper will respond to calls to study both OI and BMI with the environment as a contingency (Gassmann, 2006; Schneider & Spieth, 2013) and technological turbulence in particular (Huiz-ingh, 2011; Voelpel et al., 2004), by testing the latter contingency for both concepts.
Turbulent environments entail uncertainty about the direction of technological evolution, and thus about prospectively needed capabilities (Jaworski & Kohli, 1993; Miller, 1987), which impedes decision-making and firm activity. But to some extent, this can be countered by OI and even become a favourable situation. Firstly, OI can allow anticipation of the nature and direction of changes (Vanhaverbeke, 2006), which can prevent oversight or misinterpretation of new business occasions or complementarities with current products created by new technol-ogies (Chesbrough, 2003), which is more likely in such fast-changing contexts. Secondly, this information surplus allows to evaluate internal knowledge and capabilities. OI aids the re-plenishment of resources deemed obsolete in this scan as it enables firms to augment their R&D expertise by quickly learning newly needed skills or at least gives access to them (Ceccagnoli et al., 2010; Laursen & Salter, 2014; Nieto & Santamaria, 2007). Hence, OI can be even more
valuable in turbulent settings with high technology turnover, as it facilitates the needed swift creation of new products. Finally, OI requires openness of firms in terms of structure, culture and mindset (Chesbrough 2006a, 2007b; Gassmann et al., 2010; West & Bogers, 2014), which can prove valuable in turbulent environments demanding swift adaption, and can bolster the ability to grasp opportunities by helping to overcome dominant logic and path dependency, which constrain quick action (Prahalad & Bettis, 1986; Teece et al., 1997) and can thus be detrimental in this setting. As OI can provide needed resources in uncertain situations and its exercise stimulates organizational change which is beneficial in those contexts, it is hypothe-sized:
Hypothesis 5: The positive relation of open innovation to innovation performance is moderated by technological turbulence and is stronger for high technological turbulence.
Though BMI is claimed to be very valuable in dynamic environments, Heij et al. (2014) did not find a significant influence thereof on the BMI to firm performance relation. However, a study at more nuanced levels might still uncover more specific effects. As BMI is often tied to product innovation, the link of BMI and innovation performance is of notable interest, and since inno-vation commonly entails some connection to technology, particularly the environmental dyna-mism component technological turbulence can be assumed as impactful in this relation. DCs are argued to endow a firm with flexibility, which it needs to keep its advantage in dynamic environments by countering threats, seizing opportunities and re-establishing fit with new client needs (Teece, 2018). Firstly, as new technology needs a custom business model (Chesbrough & Rosenbloom, 2002), and many products have to be developed in technological turbulence due to shorter product life cycles (Jaworski & Kohli, 1993; Miller, 1987), the impact of per-formed or omitted BMI on their commercial success can expected to be amplified. Secondly, business models have to fit their particular environment to succeed (Teece, 2010), but techno-logical turbulence profoundly changes this environment, hence demands BMI to reinstall fit
with this altered setting. Thirdly, the technological direction, and thus the context to adapt to, often remains uncertain (Miller, 1987), but as uncertainty affects whole industries in such situ-ations (Dess & Beard, 1984), firms employing BMI might gain an edge through the experimen-tation and trial-and-error learning this process entails (McGrath, 2010; Sosna et al., 2010). These unique insights can be a resource enabling to find good business models for new tech-nologies and markets quicker than rivals, which can ultimately benefit value delivery to new clients and value appropriation from innovations. Besides its performance outcomes, BMI is argued to entail organizational ones like strategic flexibility, which helps to manoeuvre in com-plex, dynamic environments (Bock et al., 2012) and might induce the structural agility to seize those arising opportunities. The notion that BMI helps to fend off threats and allows to grasp the opportunities technological turbulence creates leads to the hypothesis:
Hypothesis 6: The positive relation of business model innovation to innovation performance is moderated by technological turbulence and is stronger for high technological turbulence.
Theory and hypotheses are captured in a conceptual model (Figure 1), which provides a blue-print to answer the research questions using the data and methods forwarded in the next chapter.
3
Methodology
The aim of this study is to forward understanding of the effect of OI on BMI and innovation performance as well as the underlying mechanisms. Moreover, the contextual factor of techno-logical turbulence in the relations of OI and BMI to innovation performance shall be clarified. This section starts with a description of the dataset as well as sample, defines the measurements and concludes with an outline and discussion of the analytical strategy to test the previously developed hypotheses in the pursuit to answer the research question.
3.1 Data Source and Sample
The data for this paper is derived from the Mannheim Innovation Panel (MIP), which is a strat-ified random sample representing a population of 276,600 German firms. It is maintained by the Centre for European Economic Research (ZEW) and, since 1993, used for a survey on be-half of the German Federal Ministry for Research and Technology, which covers firms with more than five employees in 21 production and service sectors (Aschhoff et al., 2014). This survey, which follows the Oslo Manual guidelines for the collection of innovation data, is used as the German contribution to the bi-annual European Community Innovation Survey (CIS) (Aschhoff et al., 2014), which contains extensive information about firms’ innovation activities as well as related inputs and outputs. The CIS is a widely used data source for innovation studies (Waldner et al., 2015; West et al., 2014) and, to increase reliability, includes definitions as well as examples of variables asked (Sofka & Grimpe, 2010, p. 314). In case of Germany, where a survey is conducted annually, firms participate repeatedly, which further increases familiarity of participants with the surveyed concepts, and extra quality control layers are created, like a comparison to earlier responses of the same firm (Klingebiel & Rammer, 2014, p. 252).
The sample data for this paper is an education-use file of MIP data, which is an absolutely anonymized resample from a scientific-use dataset, which contains factually anonymized MIP
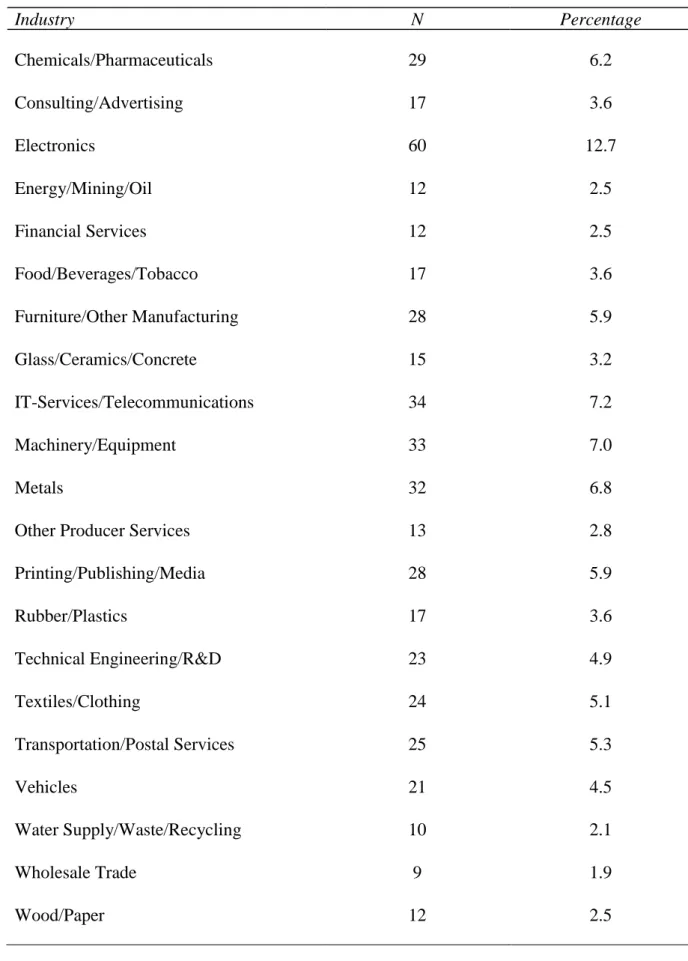
1) See Table 9 in Appendix C for further information on the range of industries and distribution of observations over those classes.
data (ZEW, 2018). The sample mimics the distribution parameters of the original micro data (ZEW, 2018) and initially consisted of 2,000 observations, which are drawn from the MIP 2013 that captures firm activities between 2010 and 2012. Only innovating firms which answered every question related to the used variables were included and items with missing values as well as an outlier with an illogically high value for innovation intensity were removed. Many missing values were found in the very specific questions about types of marketing and organi-zational innovation, hence, to prevent unnecessary exclusion of valid cases, the answers to these questions have been inspected and missing values have been treated as “no” responses if at least one of the questions from each category has been marked with “yes”, assuming that the remain-ing parts of the question were purposely left blank and implied that this particular type of mar-keting or organizational innovation is not performed at the firm. As a result, the final sample consists of 471 observations, which is large enough to conduct the aspired research and is rep-resentative in the sense that it covers SMEs as well as large firms and contains firm data from a wide variety of production and service industries1.
3.2 Measurements
Independent VariableAuthors in OI research treat the meaning of openness of innovation ambiguously and one group defines it with regards to the outcome being open, hence usable without restrictions (Dahlander & Gann, 2010). The other group follows Laursen and Salter (2006), who use a stakeholder, input view and see openness on a continuous scale, rising with more cooperating partners. Since OI in this paper is seen from outside-in with a focus on inflows of resources fostered by coop-eration with external partners, the stakeholder perspective will be followed. But as the research aim is to pioneer investigation into the relation of cooperation in general and BMI, firm en-gagement in OI practices will be proxied more broadly using a dichotomous indicator coded 1 if a firm cooperates in R&D with at least one external actor and indicating 0 in case it does not.
Mediator
BMI measurements are available when data is collected from own surveys or firm reports (e.g. Spieth & Schneider, 2016; Velu, 2015; Zott & Amit, 2007), but are only strenuously applicable to secondary data. The same is true for Clauss’ (2017) work, which provides a more generally usable measure with three levels of detail under the umbrella of the three business model ele-ments value creation, delivery and capture. This highest level, however, offers a theoretical link to the three considered BMI measurements for CIS data, which employ a similar definition of business model elements and match them to the four innovation types of this survey.
The measure by Waldner et al. (2015) indicates a BMI level by counting yes answers to nine CIS questions determined as being BMI-related by an expert panel. But this construct refers to very specific questions about type and locus of firms’ innovations, which leads to a rather low response quality when matched to this study’s sample. Particularly the question whether a prod-uct is new to the country, market or world and a very specific one about innovation in logistics processes seem to pose an obstacle to respondents. An alternative offering a larger sample size at this data quality are two BMI operationalizations created by capturing initially developed theoretical assumptions with a matched set of existing questions. In doing so, Bengtsson and Tavassoli (2018) and Barjak et al. (2014) measure changes in the business model elements on a more aggregate level, using the filter questions whether a firm performed a type of innovation instead of the ones asking for the specific sub-types thereof as Waldner et al. (2015) do. Both author teams match the business model elements value creation to product innovation and value delivery to process or organizational innovation, but Bengtsson and Tavassoli (2018) re-late only marketing innovation to value capture while Barjak et al. (2014) link marketing and process innovation to it. As noted earlier, BMI can be classified by scope or novelty (Foss & Saebi, 2017, 2018; Hartmann et al., 2013). In terms of scope, both teams see BMI as a concur-rent change of each business model element, as, for instance, one solely in value creation would
in these operationalizations constitute ‘only’ a normal product innovation. However, Bengtsson and Tavassoli (2018) use a very strict condition by requiring change in all four innovation types, which limits their measure to capture rather radical innovation than the whole scope of BMI. Barjak et al. (2014) are softer on scope, as, given the different matching of business model parts to innovation types, they identify concurrent changes to every business model element when firms simultaneously innovate products with processes or perform product innovation with at least one organizational and marketing innovation, an assumption this paper will parallel. In terms of novelty, discussions converge towards the condition that to qualify as BMI, business model changes have to be “novel” and “non-trivial” (Foss & Saebi, 2017). However, the “new-to-market” condition of Barjak et al. (2014) describes rather profound than non-trivial change. This strict assumption would qualify to measure more radical BMI but deprives the measure of explanatory power. Hence this paper aligns the Barjak et al. (2014) measurement to the noted recent research consensus by loosening its gravity condition from market” to “new-to-firm” changes, which corresponds with other BMI studies (e.g. Bock et al., 2012; Hartmann et al., 2013) and the baseline assumption for an innovation in the Oslo Manual (OECD, 2005). Consequently, this paper will measure BMI using a dichotomous variable coded 1 in case a firm simultaneously performed, new-to-firm, product innovation and process innovation or product innovation with at least one marketing and one organizational innovation, else it will be 0.
Dependent Variable
Innovation performance is a widely used measure in innovation management literature (e.g. Grimpe & Kaiser, 2010; Laursen & Salter, 2006; Tsai, 2009). It can be indirectly measured through R&D intensity on the input side or a patent count on the output side (Mairesse & Mohnen, 2010). However, a direct measure is argued to be better, since innovation success can neither be seen as stemming only from R&D nor is success thereof guaranteed and, equally, an abundance of patents does neither contribute to value creation nor capture if not utilized
(Kleinknecht et al., 2002). Hence this thesis will use a direct measure of innovation performance and follow earlier papers in strategic management journals utilizing CIS data (e.g. Klingebiel & Rammer, 2014), which measure innovation performance by raw sales resulting from signif-icantly improved or new-to-firm products introduced in the past three years. The use of raw sales makes an increase in performance more directly attributable to the innovation itself, while a relative measure of the share of sales innovations contribute to total turnover might also rise or fall based on the performance of established products (Klingebiel & Rammer, 2014, p. 253).
Moderator
Technological turbulence entails a rapid obsolescence of products or services and uncertainty about the direction of technological development (Jaworski & Kohli, 1993; Miller, 1987). The CIS asks firms to assess the prevalence of these two attributes of technological turbulence on a scale from 0 if non-applicable to 3 if fully applicable. A dichotomous indicator for high
tech-nological turbulence will be built, coded as 1 if the sum of the two responses is higher than or
equal to three, else low technological turbulence will be assumed and the variable coded as 0.
Control Variables
R&D spending has been demonstrated to be a major driver of innovation performance (Crépon et al., 1998; Mairesse & Mohnen, 2002), hence is widely used as an independent or control variable in the form of R&D intensity (e.g. Faems et al., 2005; Laursen & Salter, 2006). How-ever, this measure is criticized to omit investments in worker trainings or the market launch of innovations, all of which are captured under the broader measure of innovation expenditure, which recently often replaces R&D intensity in studies (Mairesse & Mohnen, 2010). This paper will follow this trend and control for R&D and innovation-related spending using innovation
Number of employees is a common proxy to control for firm size, which has been shown to influence innovation performance (e.g. Grimpe & Kaiser, 2010; Laursen & Salter, 2006). Larger firms have more financial and human resources, thus can more readily perform innova-tion projects, and often possess larger R&D units, leading to economies of scale (Veugelers, 1997). Moreover, a higher resource endowment increases the potential of large firms to acquire or already possess complementary assets necessary for an innovation to prosper (Teece, 1986). Finally, the industry dummy variables control for several intersectoral differences, like diver-gent product life cycle lengths or customer demands, which can impact the number of new products released or their reception and hence their turnover (Leiponen & Helfat, 2010, p. 229).
3.3 Analytical Strategy
The analysis will commence with a univariate analysis to investigate the distribution of varia-bles. Subsequently, a bivariate analysis will be performed to preliminarily study the relation of variables through their correlation and to detect potential multicollinearity.
In the next stage, the relationships will initially be tested using simple linear regression anal-yses. The assumed mediation in hypothesis 4 will be investigated following the causal steps procedure of Baron and Kenny (1986), which is the most used one to study mediation (MacKin-non et al., 2007) and in the process also allows to test the first three hypotheses. Step 1, as modelled in (1), is pursued to determine whether the causal variable cooperation has a signifi-cant effect on the outcome innovation performance. In step 2, constituted by model (2), it is tested whether the same predictor is significantly related to the mediator BMI. Finally, in the last steps, the effect of the mediator and causal variable on the outcome are established, as shown in model (3), which eventually allows to assess whether a mediation takes place by comparing the coefficients of the causal variable cooperation from model (1) and (3). Industry in all following models represents the 20 industry dummies included as a control.
(1) log 𝐼𝑛𝑛𝑜𝑃𝑒𝑟𝑓 = 𝑏0+ 𝑏1 𝐶𝑜𝑜𝑝𝑒𝑟𝑎𝑡𝑖𝑜𝑛 + 𝑏2log 𝑆𝑖𝑧𝑒 + 𝑏3log 𝐼𝑛𝑛𝑜𝐼𝑛𝑡𝑒𝑛𝑠𝑖𝑡𝑦 + 𝑏4 𝐼𝑛𝑑𝑢𝑠𝑡𝑟𝑦 + 𝜀
(2) 𝐵𝑀𝐼 = 𝑏0+ 𝑏1 𝐶𝑜𝑜𝑝𝑒𝑟𝑎𝑡𝑖𝑜𝑛 + 𝑏2log 𝑆𝑖𝑧𝑒 + 𝑏3log 𝐼𝑛𝑛𝑜𝐼𝑛𝑡𝑒𝑛𝑠𝑖𝑡𝑦 + 𝑏4 𝐼𝑛𝑑𝑢𝑠𝑡𝑟𝑦 + 𝜀
(3) log 𝐼𝑛𝑛𝑜𝑃𝑒𝑟𝑓 = 𝑏0+ 𝑏1 𝐶𝑜𝑜𝑝𝑒𝑟𝑎𝑡𝑖𝑜𝑛 + 𝑏2 𝐵𝑀𝐼 + 𝑏3log 𝑆𝑖𝑧𝑒 + 𝑏4log 𝐼𝑛𝑛𝑜𝐼𝑛𝑡𝑒𝑛𝑠𝑖𝑡𝑦 +
𝑏5 𝐼𝑛𝑑𝑢𝑠𝑡𝑟𝑦 + 𝜀
The mediator model in (2) contains a dichotomous dependent variable indicating whether BMI took place in a firm or not and the probabilities of those states are investigated using a simple linear regression in a linear probability model. One drawback of this procedure is that the esti-mated probability can exceed 1, which is illogical. An analysis of the mediator using a logit model can solve this issue, however, is not feasible within the confines of the Baron and Kenny process, which shares a difficulty to include non-linear or non-parametric techniques with other mediation approaches (Imai et al., 2011, p. 772).
A solution can be a non-linear mediation analysis using the methods built into the “mediation” R-package by Imai and colleagues (2010c), who are proponents of a new mediation procedure of causal inference using potential outcomes and counterfactuals (Imai et al., 2011). It allows to perform mediation analyses with various types of statistical models, among them a logit regression, but is based on a strong sequential ignorability assumption (SIA). The SIA as pro-posed by Imai et al. (2010b) establishes the conditions allowing to infer causality and to identify the average causal mediation effect nonparametrically. It is termed as such as it consists of two consecutive assumptions. The first one, termed no-omitted-variable bias or exogeneity, posits that, accounting for pre-treatment confounders, the treatment condition may not be statistically significantly influenced by the outcome or mediator, hence must be independent thereof (Imai et al., 2011, p. 770). Second, it asserts that, accounting for pre-treatment confounders and the observed treatment status, the mediator is independent of the outcome (Imai et al., 2010a, p. 310). This implies that no unobserved pre-treatment confounders should impact the mediator
and outcome relation (Imai et al., 2010b, p. 61). While the assumption cannot be tested, robust-ness of estimates against breaches of this part of the assumption can be assessed using a sensi-tivity analysis created by Imai et al. (2010a,b). Moreover, there may not be posttreatment con-founders, whether measured or not, influencing the mediator and outcome (Imai et al., 2010b, p. 61). A breach of this assumption cannot be handled using the proposed sensitivity analysis and may require an alternative research design (Imai et al., 2011, p. 787).
Two mediation analyses will be performed following the procedure of Imai et al. (2010c), who fit one model for each the mediator and outcome to eventually calculate the average causal mediation effect (ACME) and average direct effect (ADE). The first analysis will fit the medi-ator and outcome using the previously presented linear regression models (2) and (3), respec-tively. In the second approach, the non-linear mediation analysis possible in this procedure will define the mediator using the logit regression in model (4) and fit the outcome using the linear regression in model (3). The first analysis using linear models for both the mediator and out-come is run for two reasons, of which one is to validate the findings of the causal steps approach. Moreover, a sensitivity analysis is needed to analyse how robust the outcomes of the mediation analysis are to the existence of unobserved pre-treatment confounders, which in the noted R-package is not possible for logit models but for linear ones.
(4) log( 𝑝𝐵𝑀𝐼
1−𝑝𝐵𝑀𝐼) = 𝑏0+ 𝑏1 𝐶𝑜𝑜𝑝𝑒𝑟𝑎𝑡𝑖𝑜𝑛 + 𝑏2log 𝑆𝑖𝑧𝑒 + 𝑏3𝑙𝑜𝑔 𝐼𝑛𝑛𝑜𝐼𝑛𝑡𝑒𝑛𝑠𝑖𝑡𝑦 + 𝑏4 𝐼𝑛𝑑𝑢𝑠𝑡𝑟𝑦 + 𝜀
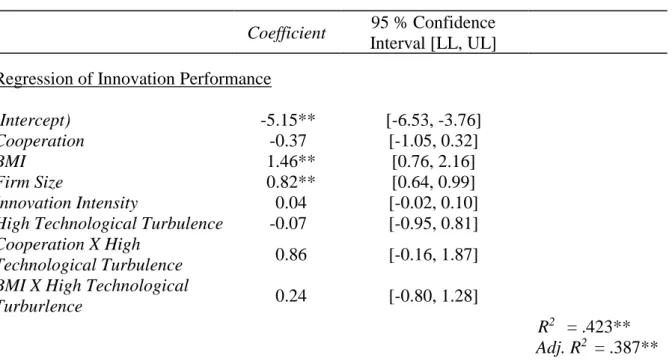
Finally, hypotheses 5 and 6 will be tested in a simple linear regression analysis. The proposed model for this endeavour augments model (3) by including a dummy variable indicating whether conditions of high technological turbulence are perceived by the firm and introduces an interaction term of this variable with cooperation as well as BMI to test for a moderation:
(5) log 𝐼𝑛𝑛𝑜𝑃𝑒𝑟𝑓 = 𝑏0+ 𝑏1 𝐶𝑜𝑜𝑝𝑒𝑟𝑎𝑡𝑖𝑜𝑛 + 𝑏2 𝐵𝑀𝐼 + 𝑏3log 𝑆𝑖𝑧𝑒 + 𝑏4log 𝐼𝑛𝑛𝑜𝐼𝑛𝑡𝑒𝑛𝑠𝑖𝑡𝑦 +
4
Results
4.1 Descriptive Statistics
Table 1 presents the descriptive statistics for the considered variables and underpins the repre-sentative nature of the sample, which covers firms on a broad range of sizes as well as ones with a diverse range of innovation sales. While neither being an assumption for linear regression models nor logit ones, transformation of variables for a more normal distribution thereof can help to achieve linearity of relations and tackle heteroscedasticity (Pearson, 2010; Starnes et al., 2010). Hence, the highly skewed variables innovation performance, firm size and innovation
intensity will be transformed using a natural logarithm. In an effort to obscure the values as
little as possible, a small constant of 0.000001 will be added to allow a transformation of zeros in innovation performance and one of 0.00000001 to enable the same for innovation intensity.
Table 1 - Descriptive Statistics
Variable N M SD Min Max Skewness Kurtosis
Innovation performance 471 3.37 8.37 0 92.48 5.45 39.76 Cooperation 471 0.35 0.48 0 1 0.63 -1.61 BMI 471 0.67 0.47 0 1 -0.70 -1.51 Firm size 471 97.97 145.21 0.30 916.82 2.86 9.36 Innovation intensity 471 0.01 0.02 0 0.27 6.92 73.12 Technological turbulence 471 0.43 0.50 0 1 0.28 -1.93
4.2 Bivariate Analysis
Since the variables of interest are not normally distributed, a non-parametric test will be used to detect correlations. Kendall’s tau and Spearman’s rho rank correlation coefficient are two accepted measures to study the strength of relationships without the assumption of normal dis-tribution. In this paper, the latter one will be used and table 2 reports the results of this analysis.
Table 2 - Matrix with Spearman’s Rank Correlation Coefficients
Variable 1 2 3 4 5 VIF 1. Innovation performance 2. Cooperation .16** 1.10 [.06, .25] 3. Business model innovation .27** [.19, .36] .16** [.07, .25] 1.10 4. Firm size .71** .19** .15** 1.08 [.65, .76] [.09, .27] [.06, .24] 5. Innovation intensity .23** .22** .27** .06 1.15 [.15, .32] [.16, .33] [.19, .36] [-.05, .15] 6. Technological turbulence .00 [-.09, .09] .02 [-.08, .11] -.05 [-.14, .03] -.08 [-.17, .02] -.02 [-.11, .07] 1.01
Notes: The variables innovation performance, firm size and innovation intensity are
loga-rithmically transformed. Values in brackets indicate the 95 % confidence interval. * indicates p < .05. ** indicates p < .01.
Both variables representing the main concepts studied in this paper are significantly correlated (p < 0.05) with innovation performance, which advocates further investigation. The significant correlation (p < 0.05) of cooperation and BMI warrants to uphold the assumption of a potential mediation and allows to proceed with a test of this hypothesis. The significant correlation (p < 0.05) of the control variables firm size and innovation intensity with innovation performance further justifies their inclusion. The high correlation of firm size with innovation performance
at 𝑟𝑠 = 0.71 stresses the need to control for it and is logically justified as larger firms can also be expected to have higher absolute sales of new products. The VIF values of variables are below any threshold that would hint at multicollinearity issues and the rather small effect sizes of correlations between the predictor and control variables also meet the logit regression as-sumption that explanatory variables shall not be too highly correlated.
4.3 Hypothesis Tests
4.3.1 Mediation Analysis Following the Procedure of Baron and Kenny
Table 3 reports the results of the mediation analysis following the Barron and Kenny (1986) procedure. In step 1 of their approach, the regression of cooperation on innovation performance (path c) is not significant at the 0.05 level with 𝑏𝑐 = 0.14. Following the authors, the mediation analysis would already at this point be terminated, as there is no significant effect on the de-pendent variable to be mediated. However, newer argumentations suggest to proceed (e.g. Rucker et al., 2011; Zhao et al., 2010), for instance if there is sufficient theoretical footing for this relation (Shrout & Bolger, 2002), which can be assumed for the well-studied positive rela-tionship between cooperation and innovation performance (e.g. Greco et al., 2015). Hence model (2) is run to perform step 2, in which the regression of cooperation on BMI (path a) is significant at the 0.05 level with 𝑏𝑎 = 0.10. This allows to proceed to step 3, run through model (3), in which the regression of cooperation and BMI on innovation performance yields 𝑏𝑏 = 1.49 significant at the 0.01 level for BMI (path b) and 𝑏𝑐′ = -0.01 for cooperation (path c`), which is not significant at the 0.05 level. Given the smaller effect size of cooperation in model (3) compared to the one in model (1) a mediation can be assumed. This finding concurs with the joint test of significance, a slight deviation from the causal steps approach proposed by MacKinnon et al. (2002), who assume a mediation if the coefficients 𝑏𝑎 and 𝑏𝑏, hence path a and b, are significant.
Figure 2 - Path Diagram for the Baron and Kenny Procedure with Results
Table 3 - Models of the Mediation Analysis Following Baron and Kenny (1986)
Coefficient 95 % Confidence Interval
[LL, UL] Step 1: Regression of Innovation Performance
(Intercept) -3.87** [-5.16, -2.59] Cooperation 0.14 [-0.39, 0.68] Firm size 0.85** [0.67, 1.03] Innovation Intensity 0.08** [0.02, 0.14] R2 = .374** Adj. R2 = .341** Step 2: Regression of BMI
(Intercept) 0.86** [0.63, 1.08] Cooperation 0.10* [0.01, 0.20] Firm size 0.02 [-0.01, 0.05] Innovation Intensity 0.02** [0.01, 0.03] R² = .144** Adj. R2 = .100** Step 3: Regression of Innovation Performance
(Intercept) -5.15** [-6.47, -3.83] BMI 1.49** [0.97, 2.02] Cooperation -0.01 [-0.53, 0.51] Firm size 0.82** [0.64, 1.00] Innovation Intensity 0.04 [-0.02, 0.10] R2 = .415** Adj. R2 = .384**
Notes: Coefficient represents unstandardized regression weights. LL and UL indicate the
lower and upper limits of a 95 % confidence interval, respectively. * indicates p < .05. ** indicates p < .01. All estimates include 20 industry dummies. The variables firm size and
innovation intensity are logarithmically transformed. Results in the models of step 1 and 3
The size of the indirect effect can be estimated with the difference in coefficients approach using the difference between coefficients 𝑏𝑐 and 𝑏𝑐′ (Judd & Kenny, 1981) or with the product of coefficients method using the product of the coefficients 𝑏𝑎 and 𝑏𝑏 (Sobel, 1982), which in the present case both yield an indirect effect of 0.149. Finally, Baron and Kenny (1986) recom-mend performing a test following Sobel (1982) to determine whether the demonstrated media-tion is significant. Given 𝑏𝑎 = 0.10, 𝑏𝑏 = 1.49 and their respective standard errors 𝑆𝐸𝑎 = 0.047 and 𝑆𝐸𝑏 = 0.266, the Sobel test in this case indicates an indirect effect significantly different from zero at the 0.05 level. This is a strong result, given that this test is presumed to have low power (Shrout & Bolger, 2002). However, since the Sobel test assumes normal distribution of the product of coefficients 𝑏𝑎 and 𝑏𝑏, which may commonly not hold especially for smaller sample sizes, an assessment of the indirect effect using bootstrapping, which corrects this issue, is recommended in recent years (Zhao et al., 2010). Consequently, this method will be applied to check the robustness of the finding of a significant indirect effect in the subsequent mediation analysis following the procedure of Imai et al. (2010c).
4.3.2 Mediation Analysis Following the Procedure of Imai, Keele and Tingley
Table 5 reports the results of the mediation analysis following the procedure of Imai et al. (2010c). In the approach using a linear mediator model, there is a not significant total effect of
cooperation on innovation performance at the 5 percent level. However, looking at the
compo-nents constituting the total effect of 0.144, there is an ACME of 0.154 significant at a 0.05 level (p = 0.016) and an ADE of -0.009 not significant at a common significance level. Both findings are in line with the results of the Baron and Kenny procedure, which shows the robustness of the previous estimate. The non-linear mediation analysis employing a logit mediator model yields the result of a total effect of 0.150 and ADE of -0.009, but both not significant at a common significance level. The ACME of 0.159 is significant at the 0.1 level. Using the more conservative result from the linear mediator approach of the mediation procedure following