Universidade de Aveiro 2015
Secção Autónoma das Ciências da Saúde da Universidade de Aveiro
SARA ISABEL
LEBRE DE
ALMEIDA
Equilíbrio das Pessoas Idosas em Função
da Idade, Género e Composição Corporal
Balance on Older People in Function of Age, Gender and Body CompositionUniversidade de Aveiro 2015
Secção Autónoma das Ciências da Saúde da Universidade de Aveiro
SARA ISABEL
LEBRE DE
ALMEIDA
Equilíbrio das Pessoas Idosas em Função
da Idade, Género e Composição Corporal
Balance on Older People in Function of Age, Gender and Body CompositionDissertação apresentada à Universidade de Aveiro para cumprimento dos requisitos necessários à obtenção do grau de Mestre em Gerontologia ramo de Gestão de Equipamentos, realizada sob a orientação científica da Doutora Alda Marques, Professora Adjunta da Escola Superior de Saúde da Universidade de Aveiro
Dedico este trabalho à minha família pelo incansável apoio em todos os momentos da minha vida.
O júri
Presidente Professora Doutora Maria Piedade Brandão
Professora Adjunta da Escola Superior de Saúde da Universidade de Aveiro
Arguente Professora Doutora Madalena Gomes da Silva
Professora Coordenadora da Escola Superior de Saúde de Setúbal
Orientadora Professora Doutora Alda Sofia Pires de Dias Marques
Agradecimentos Dedico os meus especiais agradecimentos à minha orientadora, Professora Doutora Alda Marques, pelo constante acompanhamento e preocupação e por todas as respostas às minhas dúvidas. Um especial obrigado por me fazer acreditar que é possível.
À Cristina Jácome pela disponibilidade e por todos os esclarecimentos nas horas de aperto.
À Joana pela amizade, apoio incondicional e companheirismo em todos os momentos. Não só pelo trabalho de equipa na fase do levantamento de dados mas também por nos permitirmos estender a mão em todos os obstáculos, tornando-se mais fácil ultrapassa-los. Cada momento de dificuldade e esforço foram fundamentais para chegarmos até aqui, obrigada amiga. Aos meus pais, António e Luciana, e à minha irmã, Inês, pelo amor incondicional e pelo apoio que muito me ajudaram a alcançar este objetivo.
Um especial agradecimento a todas as instituições e pessoas da comunidade que participaram neste estudo, permitindo que este trabalho fosse possível.
Palavras-chave Equilíbrio; Pessoas Idosas; Composição Corporal; Género
Resumo Enquadramento: As quedas apresentam uma elevada
incidência em pessoas idosas, representando um problema de saúde pública.
São mais comuns em mulheres, embora mais mortais para os homens. Sabe-se que as alterações da composição corporal com o envelhecimento podem prever problemas funcionais e de mobilidade. No entanto, desconhece-se se as mudanças nos sistemas responsáveis pelo equilíbrio no ser humano estão associadas ou não com a idade, o género ou com a composição corporal. Esta informação pode contribuir para a compreensão das causas das quedas e desenvolver programas de prevenção. Objetivos: Explorar as diferenças no equilíbrio de acordo com a idade, o género ou a composição corporal em pessoas com idade igual ou superior a 60 anos.
Métodos: Foi realizado um estudo transversal quantitativo. O protocolo incluiu recolha de dados sociodemográficos, antropométricos e de clínica geral. A confiança no equilíbrio foi avaliada com a Activities-specific Balance Confidence (ABC), o equilíbrio com o Balance Evaluation System Test (BESTest) e com a Berg Balance Scale (BBS).
A análise estatística foi realizada com programa Statistical Package for the Social Sciences (SPSS) versão 22.0 para Windows. O nível de significância considerado foi de p<0.05.
Resultados: Participaram neste estudo 136 pessoas idosas (idade: 75.9±8.8).
O equilíbrio foi significativamente pior com o aumento da idade (60-69: 86.7±15.2, 70-79: 80.7±16.1 e 80+: 72.4±15.8, p=0,001). O género feminino apresentou significativamente piores resultados do que o género masculino (Masculino: 87.0±14.5 e Feminino: 76.0±16.6, p=0.000) para o equilíbrio. A confiança no equilíbrio apresentou-se elevada no género masculino e moderada no género feminino (Masculino: 88.4±14.2 e Feminino: 76.7±24.7, p=0.033). O grupo de idades com mais confiança no equilíbrio foi o de 70 a 79 anos e com menos confiança o grupo +80 anos (60-69: 80.1±14.6, 70-79: 85.4±17.1 e 80+: 68.3±26.9, p=0.000). A composição corporal não apresentou diferenças significativas no equilíbrio.
Conclusão: A idade e o género afetam significativamente o equilíbrio em pessoas idosas, no entanto a composição corporal não parece ter impacto sobre o equilíbrio ou sobre a confiança no equilíbrio nesta população. A confiança do equilíbrio parece estar associada com o equilíbrio em pessoas idosas, contudo nem sempre diminui conforme a idade aumenta.
Keywords Balance; Older People; Body Composition; Gender
Abstract Background: Falls have a high incidence in older people, representing a public health problem.
They are most common in women although more mortal for men. It is known that body composition changes with aging and can predict functional and mobility problems. However, it is unknown whether the changes in the systems responsible for balance in humans are associated with age, gender or body composition.
This information can contribute to understand the causes of falls and to develop prevention programs.
Aim: Explore the balance-differences according to age, gender or body composition in people with 60 years or more.
Methods: A quantitative cross-sectional study was conducted. The protocol included socio-demographic, anthropometric and general clinical data. Balance confidence was evaluated with the Activities-specific Balance Confidence (ABC), the balance with the Balance Evaluation System Test (BESTest) and with the Berg Balance Scale (BBS).
The statistical analysis was conducted in the Statistical Package for Social Sciences (SPSS) version 22.0 for Windows. The level of significance considered was set at p<0.05.
Results: 136 older people (age: 75.9±8.8) participated in this study.
Balance was significantly worse with the increase of age (60-69: 86.7±15.2, 70-79: 80.7±16.1 and 80+: 72.4±15.8, p=0.001). Female presented significant worse results than male (Male: 87.0±14.5 and Female: 76.0±16.6, p=0.000). Confidence on balance was high in male and moderate in female (Male: 88.4±14.2 and Female: 76.7±24.7, p=0.033). The age group with more balance confidence was the 70 and 79 years old and the less confident was the older group +80 years old (60-69: 80.1±14.6, 70-79: 85.4±17.1 and 80+: 68.3±26.9, p=0.000). Body composition had no significant differences on balance. Conclusion: Age and gender significantly affect balance in older people and body composition does not seem to have impact on balance or balance confidence in this population. Balance confidence seems to be associated with balance in older people but not always decreases as age increases.
Abbreviations and/or acronyms
ABC – Activities-specific Balance Confidence Scale BBS – Berg Balance Scale
BESTest – Balance Evaluation System Test BMI – Body Mass Index
FFM – Fat-free Mass
INSA – Instituto Nacional de Saúde Doutor Ricardo Jorge WHO – World Health Organization
Table of Contents 1. Theoretical Framework ... 1 2. Method ... 2 2.1. Study Design ... 2 2.2. Ethical Considerations ... 2 2.3. Participants’ Recruitment ... 2 2.4. Data Collection ... 3 2.4.1. Measures ... 3 2.4.2. Procedures ... 5 2.5. Data Analysis ... 6 3. Results ... 6
3.1. Balance and its associations with age, gender, FFM and BMI ... 9
4. Discussion ... 11
4.1. Limitations and Future Research ... 13
5. Conclusions ... 13
Appendices and Annexes Annex I – Ethics approval Annex II – Institutions’ approval
Appendix I – Information sheets to the Participants Appendix II – Informed Consent
List of Tables
Table 1: Socio-demographic characterisation of sample (n=136) ... 6
Table 2: General clinical characterisation of the sample. ... 7
Table 3: BESTest, BBS and ABC results of the total sample and per age group. ... 9
Table 4: BESTest, BBS and ABC results for male (n=40) and female (n=96). ... 10
Table 5: BESTest, BBS and ABC according to FFM in male (n=40) and female (n=96). ... 10
Table 6: BESTest, BBS and ABC results according to BMI in male (n=40) and female (n=96). ... 11
1 1. Theoretical Framework
A fall is defined as the moment that a person rest inadvertently on the ground, floor or other level (WHO, 2012). It is kwon that after cardiovascular disease, cancer, stroke and respiratory disorders, unintentional injuries are the fifth cause of death in older people (Rubenstein, 2006), and falls are responsible for 424 000 victims per year (WHO, 2012). In 2005 the number of deaths from accidental falls (46 337) in 25 countries of the European Union represented 20.2% of deaths by external causes (Belanger and Falzon, 2008). In Portugal, falls represented approximately 92.3% (2008) of domestic accidents (INSA, 2011). Falls are more frequent in people over 65 years (WHO, 2012) and it is alarming to know that one older person will be in an emergency department for injuries related to fall in the next 17 seconds, and in the next 30 minutes, one will die as a consequence of fall(s) (CDC, 2005).
The prevalence of balance deficit in older people is estimated at 85% (Lopes, Passerini e Travensolo, 2010). Additionally, the impact of fear of falling restricts 56% of older people to perform their activities (Howland, Lachman, Peterson, Cote, Kasten and Jette, 1998). Therefore the increase incidence of falls and fear of falling in older people are the main responsible for increase of morbidity and mortality (40% of deaths from injury) rates or disability, social isolation, loss of independence, and institutionalisation (Rubenstein, 2006; WHO, 2012; Boyé, Lieshout, Beeck, Hartholt, Cammen and Patka, 2013).
The increase of older population is a reality for the coming decades worldwide, so it is time to reflect about the challenge of changing life style, public health and medical care (Boye et al., 2013). The economic impact of falls is critical for family, for community and for society (WHO, 2007). The associated costs can be divided into direct costs and indirect costs (WHO, 2007). The first costs are related with health care (e.g. medication and adequate services) and the seconds with social productivity losses (e.g. people could be more involved in activities if did not to sustain fall-related injuries) (WHO, 2007). The fall-related injuries increases affluence on health services (Boyé et al, 2013), representing a public health and economical problem in older people. Thus, studies are necessary to contribute to understand the causes of falls and to develop preventive strategies, reducing the inherent costs (Gillain, Elbouz, Beaudart, Bruyère, Reginster e Petermans, 2014).
Falls are most common in women although the mortality is most common in men (WHO, 2007). A study in Portugal has showed that the probability to suffer a fall is 40% higher in women than in men (Moniz-Pereira, Carnide, Machado, André and Veloso, 2012) and a study in the United States of America showed that the risk of death by accidental fall is 2.4 times higher among men (CDC, 2005).
Aging also implies changes in body composition of people and it is known that fat-free mass (FFM) (primarily skeletal muscle) decreases 40% between 20 and 70 years old (Villareal, Apovian, Kushner and Klein, 2005). It is also known that less physical activity, which is common in older people, leads to a further decline in metabolic rate associated with losses of FFM (Campbell, Crim, Young and Evans, 1994). Therefore the decrease of FFM with age is associated with functional ability decrease in older people (Broadwin, Goodman-Gruen and Slymen, 2001; Kyle, Genton, Hans, Karsegard, Michel, Slosman and Pichard, 2001). On other side, high prevalence of overweight and obesity have been reported among this population (Janssen, Katzmarzyk and Ross, 2005). The decrease of muscle mass and the proportional increase of body fat can predict functional and mobility problems among older people (Davison, Cogswell and Dietz, 2002). An American study has showed that in people with 60 years old or older, 74% of men and 66% of women were overweight or obese according to BMI and it is known that high BMI is associated with functional limitations (Davison, Cogswell and Dietz, 2002; Flegal, Carroll, Ogden and Curtin, 2010). Thus, body composition might be a major
2
contributor to body balance decline and falls increase (Kejonen, Kauranen and Vanharanta, 2003). However, it is not certain if obesity has influence on balance or if there are factors associated with balance and composition that make people fall. The risk of falls can be higher because of factors/mediators as sedentary behaviour; chronic health conditions, (such as anxiety/depression and diabetes) or medication use and not because of obesity itself (Mitchell, Lord, Harvey and Close, 2015). Thus, the increases of BMI may not be the cause for falls, other factors needs to be considered (Villareal, Apovian, Kushner and Klein, 2005).
Good balance, to have a normal daily life, requires the integration of sensory information of the body position relatively to the surroundings and the ability to generate appropriated motor responses to control the body movements (Sturnieks, George and Lord, 2008). The maintenance of static and dynamic balance involves the integration of activity, sensory and motor systems, which usually are more affected in older people (Rodrigues Marques, Barros and Michaelsen, 2014). Hence it is known that balance stability normally decreases due to muscle weakness, visual loss and sensory changes (Rodrigues et al., 2014). However, the changes in the systems responsible for human balance that may be associated with gender and body composition among older people are unknown.
Therefore, the aim of this study was to explore the balance-differences according to age, gender or body composition in people with 60 years old or more. This knowledge can inform the development of more effective falls prevention programs (WHO, 2007) in older people providing an important contributor for public health prevention (Kannus, Palvanen, Niemi and Parkkari, 2007; Panel on Prevention of Falls in Older Persons, 2010).
2. Method
2.1. Study Design
A quantitative cross-sectional study was conducted. Cross-sectional studies collect information from a sample of a population, at a single point in time (Muller, 2009).
2.2. Ethical Considerations
Ethical approval was obtained from the Ethics Committee of the Research Unit of Health Sciences at the School of Nursing in Coimbra, Coimbra, Portugal with number 238/10-2014 (Annex I).
2.3. Participants’ Recruitment
Fifteen day care centres, five gymnasiums and one senior university were contacted. From these six day care centres (Associação de Solidariedade Humanitária de Canelas, Associação Paz e Amizade (APA) Lar de Idosos, Casa do Professor de Aveiro, Centro Social e Paroquial de Santo André de Esgueira, Centro Social Nossa Senhora do Extremo and Lar Monte dos Burgos), two gymnasiums (Ginásio Fit&Fun and Ginásio Knock-out) and one senior university (Academia de Saberes de Aveiro) accepted to participate (Annex II). A meeting was scheduled with the direction of each institution to explain the aims of the study. In this meeting, written permission to conduct the study was obtained. Each direction selected professionals to identify eligible participants.
A healthy and older population was recruited, considering the inclusion and exclusion criteria. For the purposes of this study, the following definition was used: a healthy person is not the one who just have absence of disease or infirmity but the one who fills a physical, mental and social well-being (WHO, 2003). Participants were eligible if they were 60 years old or older; were considered healthy with common morbidities considering their age; understood the goals of the study; had capacity to express opinions; demonstrated coherent discourse and spatiotemporal orientation and accepted voluntarily to participate. Participants were excluded if they had been
3
hospitalised in the last month; demonstrated signs of cognitive impairment; had significant musculoskeletal, neurological or respiratory disorders (e.g., amputation, scoliosis, stroke, severe asthma); if physical assistance to walk was necessary and showed signs of substances abuses (e.g., alcohol and drugs), as these factors could affect balance scores and consequently the study results.
Interested participants were then contacted by the researchers. Prior to data collection participants received written information (Appendix I) and further oral explanations about the study. The strict confidentiality and anonymity of all data collected was ensured. It was also explained that all data would be kept in databases password protected, using codes and their names would not ever be disclosed. Written informed consents were then obtained (Appendix II). Data collection was carried out in the presence of two researchers and in an available room. A data sample of 136 individuals was collected.
2.4. Data Collection
Data collection occurred between November 2014 and February 2015. The protocol included socio-demographic (age, gender, date of birth, education, marital status, with whom he/she lives and occupation), anthropometric (height, weight, BMI (in Kg/m2) and FFM (in %)) and general clinical (used medication, technical aids, urinary incontinence, respiratory crises, sleeping problems, vision, hearing, number of falls, have or not fear of falling, number of times/week of 20 minutes of intense physical activities and number of times/week of 30 minutes of moderate physical activities or walk) data. The Activities-specific Balance Confidence (ABC) (Branco, 2013) was applied to evaluate balance confidence. The balance was evaluated with the Balance Evaluation System Test (BESTest) (Padgett, Jacobs and Kasser, 2012; Maia, Rodrigues-de-Paula, Magalhães and Teixeira 2013) and with the Berg Balance Scale (BBS) (Miyamoto, Junior, Berg, Ramos and Natour, 2004; Major, Fatone and Roth, 2013).
2.4.1. Measures
Socio-demographic, anthropometric and general clinical data. These measures were assessed to characterise the sample with a structured questionnaire based on International Classification of Functioning, Disability and Health (CIF – checklist) because it is a classification of health and health-related domains recommended by the World Health Organization (WHO, 2014).
Body composition. Body composition was measured with BMI (weight/height2) and FFM (%) that were assessed with bioimpedance equipment (Omron body fat monitor BF306) (Nagaya, Yoshida, Takahashi, Matsuda and Kawai, 1999; Santos and Sichieri, 2005). BMI is a good nutritional indicator for older people (Cervi, Franceschini and Priore, 2005), however does not distinguish body composition (i.e. fat from muscle), as a result, BMI overestimates fatness among those who are muscular of body fat (Prentice and Jebb, 2001; Burkhauser and Cawley, 2008). For this reason FFM was also collected. Another reason for collecting BMI and FFM were the technical simplicity, low costs and low time consuming (Deurenberg, Weststrate and Seidell, 1991).
BMI assessed the body composition measuring weight relatively to height (WHO, 2015). BMI has been used in type 2 diabetes (Tobia, Pan, Jackson, O’Reilly, Ding, Willett, Manson and Hu, 2014), quality of life (Kerman, Hopman, Vandenkerkhof and Rosenberg, 2012), hip fracture (Reider, Hawkes, Hebel, D’Adamo, Magaziner, Miller, Orwig and Alley, 2013), Parkinson’s disease (Kim, Oh, Lee, Moon, Oh, Shin, Lee, Baek, Jeong, Song, Sohn, and Lee, 2012), multiple sclerosis (Hedstrom, Olsson and Alfredsson, 2012), obesity (Flegal, Carroll, Kit and Ogden, 2012) and anorexia nervosa (Bühren, Ribbeck, Schwart, Egberts, Pfeiffer, Fleischhaker, Wewetzer, Kennes, Dempfle and Herpertz-Dahlmann, 2013). Good correlation between IMC and body fat (r=.743-.924; p<0.001) measured with a bioimpedance equipment (Nagaya, Yoshida, Takahashi, Matsuda and Kawai, 1999).
4
FFM assessed the nutritional status to know the level of muscularity of a person (Taguri, Dabbas-Tyan, Goulet and Ricour, 2009; González-Martí, Bustos, Jordán and Mayville, 2012). FFM has been studied in stroke (Marzolini, Oh, Mcllroy and Brooks, 2013), diabetes (Strugnell, Dunstan, Magliano, Zimmet, Shaw and Daly, 2014), obesity (Strugnell, et al., 2014), lifestyle (Strugnell, et al., 2014), chronic obstructive pulmonary disease (Emtner, Hallin, Arnardottir and Janson, 2015), cystic fibrosis (King, Nyulasi, Bailey, Kotsimbos and Wilson, 2014) and healthy older people (Pfrimer, Moriguti, Lima, Marchini and Ferriolli, 2012; Genton, Graf, Karsegard, Kyle and Pichard, 2013). Strong and significant correlation between FFM and Bioelectrical Impedance Analysis formula Valencia (r=0.968; p<0.005) (Pfrimer, et al., 2012).
Balance. Balance was assessed with the BESTest (Padgett, Jacobs and Kasser, 2012; Maia, 2013) and BBS (Miyamoto, Junior, Berg, Ramos and Natour, 2004; Major, Fatone and Roth, 2013) scales.
The BESTest includes 27 items (and a total of 36 tasks) and is categorised into six balance sections (Biomechanical Constraints, Stability Limits/Verticality, Transitions/Anticipatory, Reactive, Sensory Orientation and Stability in Gait) which identify who are at risk of falling and contribute to enhance the understanding of which factors are contributing for the balance deficit (Maia, 2013). The items are rated in an ordinal scale (0-3) which 0 indicates “failure” or “inability” to complete the task and 3 indicates success to complete the task (Padgett, Jacobs and Kasser, 2012). The total score (108 points) is calculated with a percentage score (0-100%) (Huang, Lytle, Miller, Smith and Fredrickson, 2014). BESTest has been used in people with balance deficits (Padgett, Jacobs and Kasser, 2012), cerebellar stroke (Rodrigues et al., 2014), Parkinson's disease (Leddy, Crowner and Earhart, 2011), peripheral neuropathy (Horak, Wrisley and Frank, 2009) and vestibular dysfunction (Horak, Wrisley and Frank, 2009). The internal consistency of 5 out of 6 subsections is excellent and poor for the section “stability limits/verticality” (αBiomechanical constrains=0.83; αStability limits/verticality=0.62; αAnticipatory Postural Adjustment=0.87; αPostural Responses=0.86; αSensory orientation=0.81; αStability in gait=0.92) (Leddy, Crowner and Earhart, 2011). The BESTest has an excellent correlation with the Functional Gait Assessment (r=0.882; p<0,001) and with the BBS (r=0.873; p<0,001) (Leddy, Crowner and Earhart, 2011). It also has an excellent validity compared to BBS, since it has the advantages of determining which equilibrium system is affected and provides information for developing a treatment or specific intervention (Rodrigues et al, 2014).
The BBS includes 14 items. The items are summed and rated from 0-4 with a maximum score of 56 points (Downs, Marquez and Chiarelli, 2013). This scale has static and dynamic activities with different degrees of difficulty. BBS can be applied to anyone independently of their age, with frail older people and with who was referred for rehabilitation because of balance deficits (Miyamoto, Junior, Berg, Ramos, and Natour, 2004). The scale has been used in a variety of population such as brain injury (Stevenson, 2001), community dwelling older (Donoghue and Stokes, 2009), multiple sclerosis (Learmonth, Paul, McFadyen, Mattison and Miller, 2012), osteoarthritis (Jogi, Spaulding, Zecevic, Overend and Kramer, 2011), Parkinson’s disease (Qutubuddin, Pegg, Cifu, Brown, McNamee and Carne, 2005), spinal cord injury (Lemay and Nadeau, 2010), stroke (Hiengkaew, Jitaree and Chaiyawat, 2012), traumatic and acquired brain injury (Newstead, Hinman and Tomberlin, 2005) and vestibular dysfunction (Whitney, Wrisley and Furman, 2003). The BBS has an excellent internal consistency (α=0.92) (Scalzo, Nova, Perracini, Sacramento, Cardoso, Ferraz and Teixeira, 2009). In criterion validity, the BBS has shown excellent correlation with the Balance Self-Perceptions Test (r=0.76; p≤0.001) (Shumwat-Cook, Baldwin, Polissar and Gruber, 1997).
Balance confidence. The ABC includes 16 items and the confidence is rated from 0-100 where zero represents “no confidence” and 100 “complete confidence” (Branco, 2013). The total values are divided by 16 to obtain the score, that is categorised in Low (<50), Moderate (50-80) and High (>80) balance confidence (Myers, Fletcher, Myers and Sherk, 1998). This scale has
5
been recommended to be used in conjunction with the BESTest to identify in which activities of daily living people are at greatest risk of falling or the perception of individuals with regard to the fear of falling (Rodrigues et al, 2014). ABC scale has been tested in healthy older people (Hatch, Gill-Body and Portney, 2003), in people with multiple sclerosis (Nilsagard, Koch, Nilsson and Forsberg, 2014), Parkinson's disease and Parkinsonism (Dal, Klassen, Sheppard and Metcalfe, 2011), stroke (Botner, Miller, and Eng, 2005), unilateral transtibial amputation (Miller, Deathe, and Speechley, 2003) and vestibular disorders (Alghwiri, Marchetti and Whitney, 2011). The ABC has been shown to have better scale responsiveness than the Falls Efficacy Scale when used with older people (Powell and Myers, 1995). Excellent internal consistency (α=0.96) has also been reported (Huang and Wang, 2009). The correlation between the ABC scale and the BESTest has also shown to be excellent (r=0.636; p<0.01) (Horak, Wrisley, and Frank, 2009).
2.4.2. Procedures
Socio-demographic, anthropometric and clinical assessment were first collected to characterise the sample. The structured questionnaire was used for this purpose to capture a holistic perspective of each participant.
Anthropometric data: height and weight were collected with one scale (Taurus 990537), one tape measure and with one bioimpedance equipment (Omron body fat monitor BF306). Participants were encouraged to perform the measurements without shoes and wearing the fewer clothes as possible. Bioimpedance was measured in order to assess the FFM in percentage (Lorenzo, Andreoli, Matthie and Withers, 1997). The bioimpedance equipment also measured the BMI (weight in kilograms/ (height in meters)2). This equipment was first used inserting participant’s height, weight, gender and age. Participants were then asked to stay standing with both feet slightly separated; with both hands holding the monitor electrodes; the shoulders to 90° and the elbows stretched (Lorenzo, Andreoli, Matthie and Withers, 1997) while the researcher pressed the on button. The measurement took a few seconds to be collected. The ABC scale was then administered in order to measure the balance in activities of daily living (Branco, 2013). A personal interview was conducted after providing some brief explanations about the scale to each participant (Branco, 2013). After participant’s answer “How confident are you that you will not lose your balance or become unsteady when you…” about each question, the percentage was registered by the researcher (Branco, 2013).
The BBS is more used to measure balance than the BESTest, however the BBS do not discriminate the different human systems responsible for balance and therefore, the BESTest has been gaining some interest among the academic and clinical communities. Both scales were applied simultaneously as many tasks are similar (BBS1-BESTest9; BBS2-BESTest2; BBS8-BESTest7; BBS12-BESTest12; BBS14-BESTest11; BBS7-BESTest19) and avoided repetition. In both scales, between each exercise an interval of two minutes was given for participants rest and to minimise the effect of fatigue (Weisman and Zeballos, 2002). Fatigue was assessed based on the modified Borg scale (Wilson and Jones, 1989).
In BBS, participants were instructed about each task and in most of the items were asked to maintain a position for a certain time (Miyamoto et al, 2004). Points were progressively deducted if the time or distance were not reached, if the participant required supervision or if the participant used an external support or got help from the researcher (Barth, Herrman, Levine, Dunning and Page, 2008). Participants had to maintain the balance in their performance and they had the opportunity to select which leg remained as support and the range of movements (Berg, Wood-Dauphinee and Williams, 1995). The material used to apply the scale was one chronometer; one tape measure, two chairs (one with and other without arms) and one stair step (Miyamoto et al, 2004).
6
The BESTest has specific procedures for each task, but for all, participants were tested with flat heeled shoes or without shoes, and if they were using a technical aids for some items those were scored one category below (Horak, 2009). Participants were instructed and when necessary some exercises were demonstrated. The BESTest was applied using one chronometer; one measuring tape mounted on wall; one block (approximately 60cm x 60cm); one medium-density Tempur foam; one 10 degree incline ramp; one stair step (15 cm); two stacked shoe boxes; one 2,5kg free weight; and one masking tape to mark the meters on the floor (Horak, Wrisley and Frank, 2009).
2.5. Data Analysis
Each participant was identified on database with a code with the letter B and with a number (e.g., B1, B2, B3).
Descriptive statistics were applied to characterise the sample, describe and summarise the data from the different measures. The normality of data distribution was tested with Kolmogorov-Sminorv tests (Mullner, 2009).
After a characterisation of the total sample, data were also grouped according participants ages (Young-Old (age 60-69), Old-Old (age 70-79) and Oldest-Old (age 80+)) and then according gender (Male and Female) (Garfein and Herzog, 1995). FFM was categorised in low [0, 17], normal [17, 26], high [26, 34] and too high [34, 50] for men and in low [0, 28], normal [28, 37], high [37, 44] and too high [44, 50] for women (Deurenberg, Yap and Staveren, 1998; WHO, 2000). The “low” categorisation was not presented as no participants were within that category. BMI was categorised in underweight (<18.5), normal (18.5-24.9), overweight (25.0-29.9), obesity I (30.0-34.9), obesity II (35.0-39.9) and obesity III (>40.0) (Arena, 2014). There were no underweight participants so this category was also not used and the obesity categories were grouped into just one category (“obesity”) as obesity II and III were also not present.
Results from BESTest, BBS and ABC were compared with age, with gender and with FFM with the One-way ANOVA. Two-way ANOVA was used to explore data on BESTest, BBS or ABC with BMI and gender.
All statistical analysis was conducted in the Statistical Package for Social Sciences (SPSS) version 22.0 for Windows. The level of significance considered was set at p<0.05.
3. Results
A total of 155 older people were approached by the research team for inclusion in the study, however eight had dementia, two had spatiotemporal disorientation, three refused for personal reasons and one was amputated and five did not fulfil the inclusion/exclusion criteria. Therefore, a total of 136 participants were included, which mean age was 75.9 (±8.8) years old (Table 1). Most participants were female (n=96; 70.6%), widowed (n=64; 47.1%), retired (n=126; 92.6%), were living with their spouse (n=43; 31.6%) and had a level of education between 1 and 4 years (n=82; 60.3%) (Table 1).
Table 1: Socio-demographic characterisation of sample (n=136)
n %
Gender (n,%) F 96 (70.6)
M 40 (29.4)
7 Married 51 (37.5) Separated 4 (2.9) Divorced 7 (5.1) Widowed 64 (47.1) Household (n,%) Alone 33 (24.3) Spouse 43 (31.6) Children 15 (11.0) Home Care 37 (27.2) Other 6 (5.9) Education (n,%) <1 17 (12.5) 1-4 82 (60.3) 5-6 14 (10.3) 7-9 17 (12.5) 10-12 5 (3.7) 13+ 1 (.7)
Occupation (n,%) Paid employment 2 (1.5) Domestic work 5 (3.7)
Retired 126 (92.6)
Unemployed 2 (1.5)
M±SD: Media±Standard Deviation; M: Male; F: Female; BMI: Body Mass Index; FFM: Free-fat mass Index; *p<0.05
Participants’ mean height was 160.8±9.8m, weight 69.8±13Kg and their FFM was 35.1±7%. The majority of the sample was overweight (n=66; 48.5%) and had no smoking history (n=123; 90.4) (Table 2).
Only five people did not take same kind of medication. Most took 3 medicines a day. The most commonly reported were hypertension (n=66; 50.4%), cholesterol inhibitors (n=59; 45.0%), cardiovascular system (n=43; 32.8%), anxiolytic sedatives and hypnotics (n=41; 31.3%) and antidepressants (38; 29.0%). There were no urinary incontinence accidents (n=104; 76.5%) or respiratory crises (130; 95.6%) in most people. The technical aid most often used were glasses (n=85; 62.5%) (Table 2).
Most participants had not fallen in the last year (n=96; 70.6%) and the ones who had, presented a mean number of falls of 1.3±0.5. Nevertheless, most had fear of falling (n=75; 55.1%). Most participants were not involved in any intense (n=82; 60.3%) or even moderate physical activities or walk (n=67; 49.3%) (Table 2).
Table 2: General clinical characterisation of the sample.
8 Height (M±SD) - 160.8±9.8 (142-190) Weight (M±SD) - 69.8±13.0 (44-106) FFM (M±SD) - 35.1±7.0 (13-50) BMI (n,%) Underweight 0 (.0) - Normal 47 (34.6) - Overweight 66 (48.5) - Obesity I 15 (11.0) - Obesity II 7 (5.1) - Obesity III 1 (.7) - Number of medicines 0 5 (3.7) - 1 26 (19.1) - 2 32 (23.5) - 3 34 (25.0) - 4 26 (19.1) - >5 13 (9.6) -
Technical aids None 20 (14.7) -
Glasses 85 (62.5) - Dental plaque 13 (9.6) - Crutches 12 (8.8) - Hearing aid 3 (2.2) - Walker 2 (1.5) - Tripod 1 (.7) -
Last year falls (n,%) Yes 40 (29.4) -
No 96 (70.6) -
Number of falls (M±SD)
-
1.3±0.5 (1-2)
Fear of falling (n,%) Yes 75 (55.1) -
9 Number of times/week of 20
minutes of intense physical activities (n,%) Nothing 82 (60.3) - 1 to 2 times/week 30 (22.1) - 3 times/week 24 (17.6) - Number of times/week of 30 minutes of moderate physical activities or walk (n,%)
Nothing 67 (49.3) -
1 to 2 times/week 30 (22.1) -
3 to 4 times/week 21 (15.4) -
≥5 times/week 18 (13.2) -
M±SD: Media±Standard Deviation; M: Male; F: Female; BMI: Body Mass Index; FFM: Free-fat mass Index; *p<0.05
3.1. Balance and its associations with age, gender, FFM and BMI
Table 3 presents the BESTest results of the total sample and per age group. The BESTest section that presented a lower score, and therefore, indicated more balance difficulties was the Reactive section when the total sample was analysed. This section was also the one presenting worst results for all age groups. All sections were significantly worse with the increasing of age. The best result for the age groups of 60-69 (87.0±16.5) and 80+ (65.3±21.3) were in Biomechanical Constraints whereas for the age group of 70-79 was Stability in Gait (79.4±23.0). Similar to the BESTest, the BBS showed that balance performance decreased when age increased (p<0.0001) (Table 3).
The age group of 70 and 79 years old was the group with more balance confidence. The less confident was the older group +80 years old were showed (p<0.0001) (Table 3).
Table 3: BESTest, BBS and ABC results of the total sample and per age group.
Total (n=136) 60-69 (n=39) 70-79 (n=45) 80+ (n=52) P
BESTest Biomechanical Constraints 74.4±20.7 87.0±16.5 74.1±17.9 65.3±21.3 .000* Stability Limits/Verticality 70.0±21.6 80.5±17.9 72.9±19.8 59.7±21.3 .000* Transitions/Anticipatory 70.6±22.5 82.2±19.5 75.9±20.5 57.3±19.7 .000* Reactive 65.7±35.7 79.2±28.5 70.2±36.3 51.7±35.7 .001* Sensory Orientation 69.5±27.4 81.5±22.7 75.8±26.0 54.9±25.7 .000* Stability in Gait 75.0±24.9 86.4±19.2 79.4±23.0 62.6±25.1 .000* Total 79.2±16.7 86.7±15.2 80.7±16.1 72.4±15.8 .000* BBS 46.8±10.2 51.8±5.6 49.0±8.6 41.2±11.5 .000* ABC 80.1±22.8 80.1±14.6 85.4±17.1 68.3±26.9 .000*
Results are presented as M±SD, mean±standard deviation; p: p-value; BBS: Berg Balance Scale; ABC: Activities-specific Balance Confidence *Statistical significant results
10
Female presented significant worse results than male in every sections of BESTest (Table 4). The largest difference was observed in the Reactive section (Male 83.3±27.2 vs Female 58.4±36.4; p<0.0001). This was also the section with worst results in female whereas the male group presented the worst results in the Stability Limits/Verticality section (78.6±19.6).
In the BBS, male presented significantly better balance performance than female (p<0.001) (Table 4). Male also presented a significantly higher balance confidence than female (Male: 88.4±14.2 vs Female: 76.7±24.7; p=0.033) (Table 4).
Table 4: BESTest, BBS and ABC results for male (n=40) and female (n=96).
M (n=40) F (n=96) P
BESTest Biomechanical Constraints 82.8±18.6 70.9±20.7 .002* Stability Limits/Verticality 78.6±19.6 66.5±21.5 .003* Transitions/Anticipatory 80.8±17.8 66.3±23.0 .000* Reactive 83.3±27.2 58.4±36.4 .000* Sensory Orientation 81.8±23.2 64.3±27.5 .001* Stability in Gait 84.5±22.8 71.0±24.7 .003* Total 87.0±14.5 76.0±16.6 .000* BBS 51.3±7.2 45.0±10.7 .001* ABC 88.4±14.2 76.7±24.7 .033*
Results are presented as M±SD, mean±standard deviation; M: Male; F: Female; p: p-value; BBS: Berg Balance Scale; ABC: Activities-specific Balance Confidence
*Statistical significant results
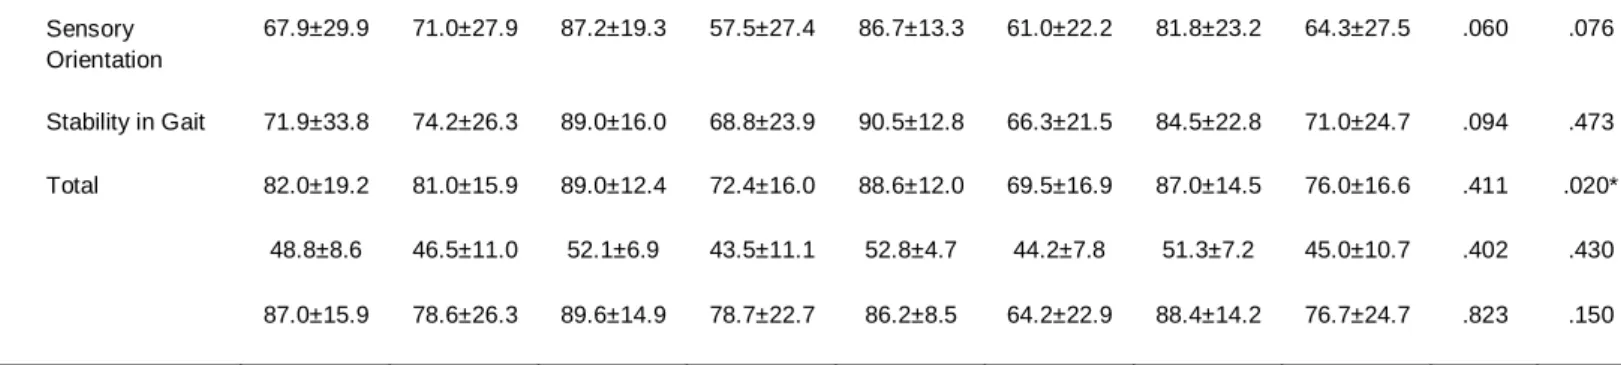
When BESTest results were compared according to the FFM of male or female, no significant differences were found (Table 5). There were two exceptions in the female group where it was showed that people with higher FFM presented significant worse results in the total of BESTest (p=0.020) and in the Reactive section (p=0.021).
No significant results for BBS or ABC according to FFM in male or female were found (Table 5).
Table 5: BESTest, BBS and ABC according to FFM in male (n=40) and female (n=96).
Normal High Too High Total
p p M (n=11) F (n=45) M (n=23) F (n=38) M (n=6) F (n=13) M (n=40) F (n=96) M (n=40) F (n=96) BESTest Biomechanical Constraints 80.0±23.7 76.0±21.7 85.2±17.3 67.5±18.6 78.9±14.2 63.1±19.7 82.8±18.6 70.9±20.7 .649 .059 Stability Limits/ Verticality 77.5±21.6 71.1±21.4 78.9±18.0 63.3±20.7 79.4±25.0 59.7±22.2 78.6±19.6 66.5±21.5 .977 .121 Transitions/ Anticipatory 77.8±20.6 71.1±23.6 81.9±16.8 62.3±22.4 82.4±18.7 61.5±20.5 80.8±17.8 66.3±23.0 .807 .158 Reactive 74.2±35.9 67.0±34.5 87.9±24.4 55.7±34.2 82.4±18.1 36.3±40.7 83.3±27.2 58.4±36.4 .400 .021*
11
Results are presented as M±SD, mean±standard deviation; M: Male; F: Female; p: p-value; BBS: Berg Balance Scale; ABC: Activities-specific Balance Confidence
*Statistical significant results
When BESTest, BBS and ABC results were compared according to BMI of male or female participants, no significant differences were found (Table 6).
Table 6: BESTest, BBS and ABC results according to BMI in male (n=40) and female (n=96).
Normal Weight Overweight Obese Total
p M (n=15) F (n=33) M (n=17) F (n=47) M (n=8) F (n=16) M (n=40) F (n=96) BESTest Biomechanical Constraints 80.0±20.8 76.0±17.9 83.9±18.3 69.6±22.8 85.8±16.5 64.2±18.0 82.8±18.6 70.9±20.7 .224 Stability Limits/ Verticality 78.1±18.7 69.7±19.4 83.8±17.7 67.4±23.1 68.4±23.2 57.1±19.2 78.6±19.6 66.5±21.5 .652 Transitions/ Anticipatory 80.0±15.4 67.2±22.6 82.0±20.1 67.4±24.5 80.0±19.2 61.5±19.5 80.8±17.8 66.3±23.0 .892 Reactive 80.7±29.7 67.8±32.2 87.2±23.8 58.9±37.4 79.9±31.7 37.5±34.9 83.3±27.2 58.4±36.4 .234 Sensory Orientation 79.6±24.5 68.3±27.9 87.1±22.8 63.3±29.4 75.0±21.9 59.2±20.0 81.8±23.2 64.3±27.5 .524 Stability in Gait 79.0±27.2 71.4±25.9 87.7±21.2 72.4±24.6 88.1±17.1 65.8±23.2 84.5±22.8 71.0±24.7 .680 Total 86.7±14.4 78.2±16.1 89.1±14.2 77.2±17.1 83.3±16.3 67.9±14.4 87.0±14.5 76.0±16.6 .708 BBS 50.2±7.5 45.7±11.3 52.6±7.1 44.8±11.3 50.8±7.4 44.1±7.6 51.3±7.2 45.0±10.7 .727 ABC 85.0±13.7 76.5±26.8 88.6±16.9 78.6±23.4 94.0±5.8 71.4±25.1 88.4±14.2 76.7±24.7 .777
Results are presented as M±SD, mean±standard deviation; M: Male; F: Female; p: p-value; BBS: Berg Balance Scale; ABC: Activities-specific Balance Confidence
4. Discussion
This study showed that age and gender significantly affect balance performance and confidence whereas body composition (BMI or FFM) do not seem to have a significant impact on balance of older people.
BESTest and BBS demonstrated that balance performance decreases when age increases and that male have better balance than female. These findings are in line with previous reports
Sensory Orientation 67.9±29.9 71.0±27.9 87.2±19.3 57.5±27.4 86.7±13.3 61.0±22.2 81.8±23.2 64.3±27.5 .060 .076 Stability in Gait 71.9±33.8 74.2±26.3 89.0±16.0 68.8±23.9 90.5±12.8 66.3±21.5 84.5±22.8 71.0±24.7 .094 .473 Total 82.0±19.2 81.0±15.9 89.0±12.4 72.4±16.0 88.6±12.0 69.5±16.9 87.0±14.5 76.0±16.6 .411 .020* BBS 48.8±8.6 46.5±11.0 52.1±6.9 43.5±11.1 52.8±4.7 44.2±7.8 51.3±7.2 45.0±10.7 .402 .430 ABC 87.0±15.9 78.6±26.3 89.6±14.9 78.7±22.7 86.2±8.5 64.2±22.9 88.4±14.2 76.7±24.7 .823 .150
12
stating that falls rates increase exponentially with age in both genders, however falls are more common among older women (WHO, 2007).
Despite BBS being more commonly used in the literature, the BESTest allows the identification of which system(s) of balance is/are affected(s) (Horak, Wrisley, and Frank, 2009). This might be especially useful to develop tailored interventions aiming at preventing falls. Ageing increases alterations on different balance systems, namely the reactive and limits of stability (Andrade, Stella, Barbieri, Rinaldi, Hamanaka and Gobbi, 2011; Pereira, Maia and Silva, 2013), which are intimately related with the dynamic balance. Hence, deficits of dynamic balance have been shown to be related with an increase of multiple falls in older people (Callisaya, Blizzard, Schmidt, McGinley, Lord and Srikanth, 2009). Corroborating this line of argument, BESTest indicated more balance difficulties in the Reactive section, independently of the age group. Male presented more balance difficulties in Stability Limits/Verticality whereas female were more affected in the Reactive section. The reaction time varies between gender, being female more susceptive to fall than male (Callisaya, Blizzard, Schmidt, McGinley, Lord and Srikanth, 2009). This study also found significant differences on balance confidence among male and female, having female worst results on balance confidence. This result is in line whit previous studies, which have shown that the prevalence of fear of falling is higher among female than male (Maki, Holliday and Topper, 1991; Arfken, Lach, Birge and Miller, 1994).
Balance performance is strongly associated with balance confidence in older people (Hatch, Gill-Body and Portney, 2003) and a low balance confidence restricts participation in daily life (Maki, 1997; Lach, 2005; Rand, Miller, Yiu and Eng, 2011). As factors related with the physical and public environments are the most common cause of falls (30 to 50% of falls) in older people (WHO, 2007), it seems essential to modify the environments where people live and socialise at the same time we encourage people to be physically active, if we want to start preventing falls and promoting people’s health and well being. This research showed that balance confidence did not necessarily decrease with age, i.e., the age group of 60-69 years old was less confident than the group of 70 and 79 years old and more confident than the group of +80 years old. These results might be explained by the fact that this age group (60-69 years old) was composed of people that were still working and active in many daily life activities. It is known that performing activities of daily living increases risk of falling in older people and hence, affects their balance (WHO, 2007). Moreover, this age group is living a period of transition between adult and older people (Logan, 1992) and the social perception is that older people fall (WHO, 2007). They are often tired and frail, which is a state of increased vulnerability to poor resolution of homoeostasis after a stressor event, increasing the risk of falls (Clegg, Young, Iliff, Rikkert and Rockwood, 2013). Often, this age group presents more fear of falling in workplaces/groundwork, commercial area/services or in outdoors (INSA, 2011). Conversely, when people were all retired (70-79 years old), their confidence on balance increased to then decline due to age and general physical impairment (80+ years old). Older people usually are afraid of being hurt or hospitalised, not being able to get up after a fall, being social embarrassed, loosing of independence and having to move from their house (WHO, 2007). People who are fearful of falling also tend to lack confidence in their ability to prevent or manage falls, which increases the risk of falling (WHO, 2007). Additionally, people with 80+ have more comorbidities and are physically weaker (Christensen, Doblhammer, Rau and Vaupel, 2009), and therefore less confident in their balance. However, this age group is especially afraid of falling at home (INSA, 2011).
This research also showed that obesity non-related with a presence of chronic health condition do not seem to be associated with balance and consequently with risk of fall. There are conflicting findings in the literature regarding the association between obesity and falls (Rekeneire, Visser, Peila, Nevitt, Cauley, Tylavsky, Simonsick and Harris, 2003). Whilst some authors have reported no evidence of a correlation between BMI and balance ability and
13
postural stability (Rosenblatt and Grabinen, 2012; Baierle, Kromer, Petermann, Magosh and Luomajoki, 2013), others have found obesity associated with increased risk of fall (Richardson, 2002; Fjeldstad, Fjeldstad, Acree, Nickel and Gardner, 2008; Mitchell, Lord, Harvey and Close, 2014). It has been shown that increased risk of fall can be caused by other factors (mediators) common fall-related risk in older people independently of body composition (Mitchell, Lord, Harvey and Close, 2015). For example, the use of sedatives, neurocardiovascular complications, vision impairment and/or environment alterations can be the factors responsible for falls when associated with high or low body composition (Shaw, 2007; Mitchell, Lord, Harvey and Close, 2015). Thus, falls might be related with body composition if it is related with some intrinsic or extrinsic factors, which was not the case of the sample of this study.
In fact, body composition changes progressively in older people (Rudman, Feller, Cohn, Shetty, Rudman and Draper, 1991). A study showed that body weight and BMI have a constant increase from 40 to 66 years of age in both male and female (Guo, Zeller, Chumlea and Siervogel, 1999; Buffa, Floris, Putzu and Marini, 2011). Another study showed that FFM progressively increases until 40 years old and after it begins to decrease (Buffa, FLoris, Putzu and Marini, 2011). Therefore, oscillations on body composition on a healthy population occur progressively and the systems responsible for the balance as well people’s confidence of balance will be adjusting progressively. Hence, it is not surprising that no significant differences were found between body composition and balance performance or balance confidence.
4.1. Limitations and Future Research
Some limitations of this study need to be acknowledged.
A sample relatively small in each age group was recruited and therefore, a larger sample would strengthen the findings. This would also allow data collection on people underweight which would be important to confirm the results about the lack of association between body composition and balance/balance confidence.
Additionally, the same research could be done in different pathological populations in order to find if balance change with age, gender and body composition and what systems are more affected, using the data of this study as comparator.
Nevertheless, this study contributed to enhance our understanding about the main areas responsible for human balance that might be maintained versus affected in older people. This information might be essential to develop tailored interventions to prevent falls. It also contributed for understanding balance confidence among older people.
5. Conclusions
Balance studies are crucial to develop falls prevention programs in older people. This study showed that age and gender significantly affect balance performance and confidence in older people and that specific programs to prevent falls should focus in stability limits/verticality when directed to male and in reactive movements if directed to female. Moreover body composition (BMI and FFM) do not seem to impact on balance performance or balance confidence in this population. Balance confidence is associated with balance in older people but does not decline as age increases as the 70-79 group age presented a better score. Nevertheless, further studies should analyse balance in different populations (underweight, chronic diseases and impairment) and reflect about specific trajectories to create programs to reduce falls and fear of falling.
Balance problems are a worldwide concern, thus prevention strategies must be developed to reduce risk of fall in older people. Treatments or programs based only on balance, without considering different systems, might not achieve the best possible results. Thus, specific
14
performance and confidence balance treatments/programs might be developed for each population instead of being generalised as a single problem for everybody.
References
Alghwiri, A., Marchetti, G. & Whitney, S. (2011). Content Comparison of Self-Report Measures Used in Vestibular Rehabilitation Based on the International Classification of Functioning, Disability and Health. Physical Therapy, 91(3), 346-357.
Andrade, L., Stella, F., Barbieri, F., Rinaldi, N., Hamanaka, A. & Gobbi, L. (2011). Efeitos de tarefas cognitivas no controle postural de idosos: Uma revisão sistemática. Motricidade, 7(3), 19-28.
Arena, R. (2014). Guidelines for Exercise Testing and Prescription, 9th ed. In ACSM’s
Guidelines for Exercise Testing and Prescription (pp. 63-64), Philadelphia: Lippincott Williams &
Wilkins.
Arfken, C., Lach, H., Birge, S. & Miller, J. (1994). The prevalence and correlates of fear of falling in elderly persons living in the community. American journal of public health, 84(4), 565-570. Baierle, T., Kromer, T., Petermann, C., Magosch, P. & Luomajoki, H. (2013). Balance ability and postural stability among patients with painful shoulder disorders and healthy controls. BMC
Musculoskeletal Disorders, 14(1), 282.
Barth, E., Herrman, V., Levine, P., Dunning, K. & Page, S. (2008). Low-Dose, EMG-Triggered Electrical Stimulation for Balance and Gait in Chronic Stroke. Topics in Stroke Rehabilitation, 15(5), 451-455.
Berg, K., Wood-Dauphinee, S., & Williams, J. (1995). The Balance Scale: Reliability assessment for older residences and patients with an acute stroke. Scandinavian Journal of
Rehabilitation Medicine, 27(1), 27-36.
Botner, E., Miller, W. & Eng, J. (2005). Measurement properties of the Activities-specific Balance Confidence Scale among individual with stroke. Disability and Rehabilitation, 27(4), 156-163.
Boyé, N., Lieshout, E., Beeck, E., Hartholt, K., Cammen, T. & Patka, P. (2013). The impact of falls in the elderly. Trauma, 15(1), 29-35.
Branco, P. (2013). Determinação dos Pontos de Corte para Elevado Risco de Queda e Mobilidade Normal da Versão Portuguesa da Activities-Specific Balance Confidence (ABC) Scale. Revista da Sociedade Portuguesa de Medicina Física e de Reabilitação, 24(2), 12-17. Broadwin, J., Goodman-Gruen, D. & Slymen, D. (2001). Ability of Fat and Fat-Free Mass Percentages to Predict Functional Disability in Older Men and Women. Journal of the American
Geriatrics Society, 49 (12), 1641-1645.
Buffa, R., Floris, G., Putzu, P. & Marini, E. (2011). Body Composition Variations in Ageing.
Collegium antropologicum, 35(1), 259-265.
Bühren, K., Ribbeck, L., Schwart, R., Egberts, K., Pfeiffer, E., Fleischhaker, C., Wewetzer, C., Kennes, L., Dempfle, A. & Herpertz-Dahlmann, B. (2013). Body mass index in adolescent anorexia nervosa patients in relation to age, time point and site of admission. European Child &
15
Burkhauser, R. & Cawley, J. (2008). Beyond BMI: The value of more accurate measures of fatness and obesity in social science research. Journal of Health Economics, 27(2), 519-529. Callisaya, M., Blizzard, L., Schmidt, M., McGinley, J., Lord, S. & Srikanth, V. (2009). A population-based study of sensorimotor factors affecting gait in older people. Age and Ageing, 38(3), 290-295.
Campbell, W., Crim, M., Young, V. & Evans, W. (1994). Increased energy requirements and changes in body composition with resistance training in older adults. The American Society for
Clinical Nutrition, 60(2), 167-175.
Cervi, A., Franceschini, S. & Priore, S. (2005). Critical analysis of the use if the body mass index for elderly. Revista de Nutrição, 18(6), 765-775.
Christensen, K., Doblhammer, G., Rau, R. & Vaupel, J. (2009). Ageing populations: the challenges ahead. Lancet, 374(9696), 1196-1208.
Clegg, A., Young, J., Iliff, S., Rikkert, M. & Rockwood, K. (2013). Frailty in elderly people.
Lancet, 381(9868), 752-762.
Dal, V., Klassen, L., Sheppard, S. & Metcalfe, A. (2011). Psychometric Properties of Activity, Self-Efficacy, and Quality-of-Life Measures in Individuals with Parkinson Disease.
Physiotherapy Canada, 63(1), 47-57.
Davison, K., Cogswell, M. & Dietz, W. (2002). Percentage of Body Fat and Body Mass Index Are Associated with Mobility Limitations in People Aged 70 and Older from NHANES III. Journal
of the American Geriatric Society, 50(11), 1802-1809.
Deurenberg, P., Weststrate, J. & Seidell, J. (1991). Body mass index as a measure of body fatness: age- and sex- specific prediction formulas. British Journal of Nutrition, 65(2), 105-114. Deurenberg, P., Yap, M. & Staveren, W. (1998). Body mass index and percent body fat: a meta analysis among different ethnic groups. International Journal of Obesity, 22(12), 1164-1171. Donoghue, D. & Stokes, E. (2009). How much change is true change? The minimum detectable change of the Berg Balance Scale in elderly people. Journal of Rehabilitation Medicine, 41(5), 343-346.
Downs, S., Marquez, J. & Chiarelli, P. (2013). The Berg Balance Scale has high intra- and inter-rater reliability but absolute reliability varies across the scale: a systematic review. Journal of
Physiotherapy, 59(2), 93-99.
Fjeldstad, C., Fjeldstad, A., Acree, L., Nickel, K. & Gardner, A. (2008). The influence of obesity and quality of life. Dynamic Medicine, 7(4), 1-6.
Flegal, K., Carroll, M., Kit, B. & Ogden, C. (2012). Prevalence of Obesity and Trends in the Distribution of Body Mass Index Among US Adults, 1999-2010. The Journal of the American
Medical Association, 307(5), 491-497.
Flegal, K., Carroll, M., Ogden, C. & Curtin, L. (2010). Prevalence and Trends in Obesity Among US Adults, 1999-2008. The Journal of the American Medical Association, 303(3), 235-241. Garfein, A. & Herzog, A. (1995). Robust Aging among the Young-Old, Old-Old, and Oldest-Old.
16
Genton, L., Graf, C., Karsegard, V., Kyle, U. & Pichard, C. (2013). Low fat-free mass as a marker of mortality in community-dwelling healthy elderly subjects. Age Ageing, 42(1), 33-39. Gillain, S.; Elbouz, L.; Beaudart, C.; Bruyère, O.; Reginster, J.; Petermans, J. (2014). Falls in the Elderly. Revue médicale de Liège, 69(5-6), 258-264.
González-Martí, I., Bustos, J., Jordán, O. & Mayville, S. (2012). Validation of a Spanish version of the Muscle Appearance Satisfaction Scale: Escala de Satisfacción Muscular. Body Image, 9(4), 517-523.
Guo, S., Zeller, C., Chumlea, W. & Siervogel, R. (1999). Aging, body composition, and lifestyle: the Fels Longitudinal Study. The American journal of clinical nutrition, 70(3), 405-411.
Hatch, J., Gill-Body, K. & Portney, L. (2003). Determinants of Balance Confidence in Community-Dwelling Elderly People. Physical Therapy, 83(12), 1072-1079.
Hedstrom, A., Olsson, T. & Alfredsson, L. (2012). High body mass index before age 20 is associated with increased risk for multiple sclerosis in both men and women. Multiple Sclerosis, 18(9), 1334-1336.
Herman, K., Hopman, W., Vandenkerkhof, E. & Rosenberg, M. (2012). Physical activity, body mass index, and health-related quality of life in Canadian adults. Medicine and Science in
Sports and Exercise, 44(4), 625-636.
Hiengkaew, V., Jitaree, K. & Chaiyawat, P. (2012). Minimal detectable changes of the Berg Balance Scale, Fugl-Meyer Assessment Scale, Timed “Up & Go” Test, gait speeds, and 2-minute walk test in individuals with chronic stroke with different degrees of ankle plantarflexor tone. Archives of Physical Medicine and Rehabilitation, 93(7), 1201-1208.
Horak, F., Wrisley, D., & Frank, J. (2009). The Balance Evaluation Systems Test (BESTest) to Differentiate Balance Deficits. Physical Therapy, 89(5), 484-498.
Howland, J., Lachman, M., Peterson, E., Cote, J., Kasten, L. & Jette, A. (1998). Covariates of Fear of Falling and Associated Activity Curtailment. The Gerontological Society of America, 38(5), 549-555.
Huang, H., Lytle, T., Miller, K., Smith, K. & Fredrickson, K. (2014). History of falls, balance performance, and quality of life in older cancer survivors. Gait & Posture, 40(2014), 451-456. Huang, T., Wang, W. (2009). Comparison of three established measures of fear of falling in community-dwelling older adults: Psychometric testing. International Journal of Nursing Studies, 46(2009), 1313-1319.
Instituto Nacional de Saúde Doutor Ricardo Jorge (INSA). (2011). Adelia - Acidentes
Domésticos e de Lazer: Informação Adequada. Relatório 2006 – 2008, Lisboa.
Janssen, I., Katzmarkzyk, P. & Ross, R. (2005). Body Mass Index Is Inversely Related to Mortality in Older People After Adjustment for Waist Circumference. American Geriatric Society, 53(12), 2112-2118.
Jogi, P., Spaulding, S., Zecevic, A., Overend, T. & Kramer, J. (2011). Comparison of the Original and Reduced Versions of the Berg Balance Scale and the Western Ontario and McMaster Universities Osteoarthritis Index in Patients Following Hip or Knee Arthroplasty.
17
Kannus, P., Palvanen, M., Niemi, S. & Parkkari, J. (2007). Alarming Rise in the Number and Incidence of Fall-Induced Cervical Spine Injuries Among Older Adults. Journal of Gerontology, 62(2), 180-183.
Kejonen, P., Kauranen, K. & Vanharanta, H. (2003). The Relationship Between Anthropometric Factors and Body-Balancing Movements in Postural Balance. Archives of Physical Medicine
and Rehabilitation, 84(1), 17-22.
Kim, H., Oh, E., Lee, J., Moon, J., Oh, J., Shin, J., Lee, K., Baek, I., Jeong, S., Song, H., Sohn, E. & Lee, A. (2012). Relationship between changes of body mass index (BMI) and cognitive decline in Parkinson’s disease (PD). Archives of Gerontology and Geriatrics, 55(1), 70-72. King, S., Nyulasi, I., Bailey, M., Kotsimbos, T. & Wilson, J. (2014). Loss of fat-free mass over four years in adult cystic fibrosis is associated with high serum interleukin-6 levels but not tumour necrosis factor-alpha. Clinical Nutrition, 33(1), 150-155.
Kyle, U., Genton, L., Hans, D., Karsegard, V., Michel, J., Slosman, D. & Pichard, C. (2001). Total Body Mass, Fat Mass, Fat-Free Mass, and Skeletal Muscle in Older People: Cross-Sectional Differences in 60-Years-Old-Persons. Journal of the American Geriatrics Society, 49(12), 1633-1640.
Lach, H. (2005). Incidence and Risk Factors for Developing Fear of Falling in Older Adults.
Public Health Nursing, 22(1), 45-52.
Learmonth, Y., Paul, L., McFadyen, A., Mattison, P. & Miller, L. (2012). Reliability and clinical significance of mobility and balance assessments in multiple sclerosis. International Journal of
Rehabilitation Research, 35(1), 69-74.
Leddy, A., Crowner, B. & Earhart, G. (2011). Functional Gait Assessment and Balance Evaluation System Test: Reliability, Validity, Sensitivity, and Specificity for Identifying Individuals With Parkinson Disease Who Fall. Journal of the American Physical Therapy Association, 91(1), 102-113.
Lemay, J. & Nadeau, S. (2010). Standing balance assessment in ASIA D paraplegic and tetraplegic participants: concurrent validity of the Berg Balance Scale. Spinal Cord, 48(3), 245-250.
Logan, J. (1992). As Old as You Feel: Age Identity in Middle and Later Life. Social Forces, 71(2), 451-467.
Lopes, M., Passerini, C. & Travensolo, C. (2010). Eficácia de um protocolo fisioterapêutico para equilíbrio em idosos institucionalizados. Ciências Biológicas e da Saúde, Londrina, 31(2), 143-152.
Lorenzo, A., Andreoli, A., Matthie, J. & Withers, P. (1997). Predicting body cell mass with bioimpedance by using theoretical methods: a technological review. Journal of Applied
Physiology, 82 (5), 1542-1558.
Maia, A., Rodrigues-de-Paula, F., Magalhães, L. & Teixeira, R. (2013) Cross-cultural adaptation and analysis of the psychometric properties of the Balance Evaluation Systems Test and MiniBESTest in the elderly and individuals with Parkinson’s disease: application of the Rash model. Brazilian Journal of Physical Therapy, 17(3), 195-217.
Major, M., Fatone, S. & Roth, E. (2013). Validity and reliability of the Berg Balance Scale for community-dwelling persons with lower-limb amputation. Archives of Physical Medicine and
18
Maki, B. (1997). Gait changes in older adults: predictors of falls or indicators of fear. Journal of
the American Geriatrics Society, 45(3), 313-320.
Maki, B., Holliday, P. & Topper, A. (1991). Fear of falling and postural performance in the elderly. Journal of gerontology, 46(4), M123-M131.
Marzolini, S., Oh, P., Mcllroy, W. & Brooks, D. (2013). The Effects of an Aerobic and Resistance Exercise Training Program on Cognition Following Stroke. Neurorehabilitation & Neural Repair, 27(5), 392-402.
Miller, W., Deathe, A. & Speechley, M. (2003). Psychometric properties of the Activities-specific Balance Confidence Scale among individuals with a lower-limb amputation. Archives of Physical
Medicine and Rehabilitation, 84(5), 656-661.
Mitchell, R., Lord, S., Harvey, L. & Close, J. (2014). Association between obesity and overweight and fall risk, health status and quality of life in older people. Australian and New
Zealand Journal of Public Health, 38(1), 13-18.
Mitchell, R., Lord, S., Harvey, L. & Close, J. (2015). Obesity and falls in older people: Mediating effects of disease, sedentary behavior, mood, pain and medication use. Archives of
Gerontology and Geriatrics, 60(1), 52-58.
Miyamoto, S., Junior, I., Berg, K., Ramos, L. & Natour, J. (2004). Brazilian version of the Berg balance scale. Brazilian Journal of Medical and Biological Research, 37(9), 1411-1421.
Moniz-Pereira, V., Carnide, F., Machado, M., André, H. & Veloso, A. (2012). Falls in Portuguese older people: procedures and preliminar results of the study Biomechanics of Locomotion in the Elderly. Acta Reumatológica Portuguesa, 37 (4), 324-332.
Mullner, R. (2009). Encyclopedia of Health Services Research. SAGE Publication, Inc., 1(C), 266.
Myers, A. Fletcher, P. Myers, A. & Sherk, W. (1998). Discriminative and Evaluative Properties of the Activities-specific Balance Confidence (ABC) Scale. Journal of Gerontology: Medical
Sciences, 53A(4), M287-294.
Nagaya, T., Yoshida, H., Takahashi, H., Matsuda, Y. & Kawai, M. (1999). Body mass index (weight/height2) or percentage body fat bioelectrical impedance analysis: which variable better reflects serum lipid profile?. International Journal of Obesity and Related Metabolic Disorders, 23(7), 771-774.
Newstead, A., Hinman, M. & Tomberlin, J. (2005). Reliability of the Berg Balance Scale and balance master limits of stability tests for individuals with brain injury. Jounal of Neurologic
Physical Therapy, 29(1), 18-23.
Nilsagard, Y., Koch, L., Nilsson, M. & Forsberg, A. (2014). Balance Exercise Program Reduced Falls in People With Multiple Sclerosis: A Single-Group, Pretest-Posttest Trial. Archive of
Physical Medicine and Rehabilitation, 95(12), 2428-2434.
Padgett, P., Jacobs, J. & Kasser, S. (2012). Is the BESTest at Its Best? A Suggested Brief Version Based on Interrater Reliability, Validity, Internal Consistency, and Theoretical Construct.
Physical Therapy, 92(9), 1197-1207.
Panel on Prevention of Falls in Older Persons, American Geriatrics Society and British Geriatrics Society - Summary of the Updated American