Interictal spike quanti
fication in continuous spike–wave of sleep
(CSWS): Clinical usefulness of a wearable EEG device
Daniel Carvalho
a,b, Timóteo Mendes
c, Ana I. Dias
a, Alberto Leal
a,c,⁎
a
Pediatric Neurology (EEG Lab), Hospital Dona Estefânia, Lisbon, Portugal
bEscola Superior de Tecnologias e Saúde de Lisboa (ESTeSL), Lisbon, Portugal c
Department Clinical Neurophysiology, Centro Hospitalar Psiquiátrico de Lisboa, Lisbon, Portugal
a b s t r a c t
a r t i c l e i n f o
Article history: Received 3 September 2019 Revised 2 January 2020 Accepted 2 January 2020 Available online 25 January 2020Introduction: Continuous spike–wave of sleep (CSWS) syndrome is one of the most common epileptic encepha-lopathies of childhood. Because the associated cognitive/behavioral disturbances relate more to the amount of spike activity than of seizures, methods of spike quantification gained relevance in diagnosis and monitoring treatment. The conventional methodology for quantification of spike index (SI) relies on repeated full 10–20 long-term ambulatory electroencephalography (aEEG), which is both expensive and poorly tolerated. Objective: The objectives of this study were to demonstrate the clinical value of repeated SI assessments in CSWS and to build and validate a wearable device allowing inexpensive and well-tolerated, repeated quantifications. Methods: A group of N = 38 patients with CSWS were submitted to repeated SI quantifications based on aEEG, as seenfit by the medical clinical assistant. Responses to therapy with corticosteroids (N = 10), sulthiame (N = 7), and the ketogenic diet (N = 3) were monitored. We used a conventional method based on a semiautomatic tem-plate match spike search. The individual variability in time spans of days (N = 4) or months (N = 10) was assessed and used to determine the meaningful neurophysiological responses to the diverse therapies. A wearable device capable of recording 2 bipolar EEG channels for 24 h was used to simplify SI quantification. Results: Corticosteroids produced the most powerful SI reduction, but a large individual variability in both amount and time of onset of clinical response with some patients exhibiting recurrence shortly after therapy. A more frequent sampling of SI would provide a more accurate follow-up, with clinical benefit.
The comparison of the SI obtained from standard 10–20 electrodes and 2 bipolar EEG channel subsets in aEEG or between the 10–20 and simultaneous wearable recordings, demonstrated that the new method provides an ac-curate SI quantification.
Conclusions: A wearable EEG device with 2 bipolar channels simplifies the process of obtaining repeated SI quan-tification allowing a more accurate follow-up of spike activity in the clinical setting.
© 2020 Elsevier Inc. All rights reserved.
Keywords: Epilepsy CSWS EEG Wearable Epileptic encephalopathy 1. Introduction
The continuous spike–wave of sleep (CSWS) syndrome, first de-scribed in 1971 [1], is a condition of young children where onset of cog-nitive/behavioral problems (reviewed in [2]) associates with a peculiar type of spike activity, reduced in rapid eye movement (REM) sleep and wakefulness but very abundant during non-REM sleep. The association, strongly suggestive of a causal relationship [3], motivated efforts to quantify the interictal spike activity to distinguish it from similar EEG conditions, but without the cognitive effects, and to monitor response to therapy. Early attempts to quantify the spike index (SI) focused on determining the percentage of non-REM sleep with continuous spiking, using diverse, mostly poorly described, methods (reviewed in [4]). No
clear-cut threshold of the SI wasfirmly established for the appearance of cognitive/behavioral problems and the early proposal of 85% in the original article [1] persisted as a general historical reference. The intro-duction of digital EEG in the clinical settings allowed the introintro-duction of more objective and less labor-intensive methods [5], with a significant contribution from the ambulatory electroencephalography (aEEG) to make the task of recording whole night EEG easier.
The significant variability of clinical and neurophysiological features of CSWS throughout the course of the condition, which can extend from the early years of life until adolescence (reviewed in [6]), and the need for prolonged, often poorly tolerated [7], therapies has always func-tioned as a strong motivation for the objective quantification of spike activity as a monitoring tool (reviewed in [8]). In the clinical setting, the adoption of methods based on repeated aEEGs for detailed analysis has faced with practical difficulties and led to the persistent use of rou-tine sleep studies for such assessments, despite their well-known
⁎ Corresponding author at: Avenida do Brasil 53, 1749-002 Lisboa, Portugal. E-mail address:[email protected](A. Leal).
https://doi.org/10.1016/j.yebeh.2020.106902 1525-5050/© 2020 Elsevier Inc. All rights reserved.
Contents lists available atScienceDirect
Epilepsy & Behavior
limitations [9]. Several reasons contribute to the relatively poor use of aEEG for monitoring of CSWS, including cost, tolerability, and availability. These limitations led to relatively little data on the individual variability along the natural history of the condition and on the time relationship with recovery from the cognitive/behavioral impairments [8].
In the present paper we proposed to a) determine the variability of SI quantifications over a day-to-day or several months temporal span; b) explore the temporal profile of response to the most common thera-pies; c) quantify the SI with a full 10–20 montage and with a reduced montage with 2 bipolar electrodes in the same patients; and d) validate a wearable EEG logger to perform repeated SI quantifications through-out the natural history of CSWS.
2. Patients and methods 2.1. Clinical population
The clinical population (N = 38) was selected from patients referred to the Electroencephalography Lab of the Department of Pediatric Neu-rology of Centro Hospitalar Lisboa Central (Lisbon, Portugal) or to the Clinical Neurophysiology Department of Centro Hospitalar Psiquiátrico de Lisboa (Lisbon, Portugal), with the suspicion of CSWS. In all cases, cognitive and/or behavioral problems were associated with a sleep EEG demonstration of strong increase in spike activity at sleep onset and throughout. The diagnosis of CSWS was established by demonstrat-ing a sudden increase in the spike index (SI) to values higher than 85% in the transition from wakefulness to thefirst cycle of sleep in a 24 h aEEG using the full 10–20 system. Cases where it was not possible to record an all-night EEG or with abundant spike activity while awake were excluded.
Clinical and neurophysiological data for each patient are presented inTable 1.
2.2. EEG recordings
Recordings with the full 10–20 system were obtained in a clinical context using a medical grade aEEG system (TREX HD, XLTEK©), with sampling at 200 Hz and bandwidth 0.5–70 Hz. Both the timing and the number of recordings were freely determined by the clinical neurol-ogists as they sawfit to support clinical decisions. Most studies lasted 24 h, but in four cases, it was extended to 67 h, including 3 whole nights (Fig. 1b). Gold-plated disk-type Grass electrodes were applied with col-lodion and impedances adjusted to less than 5 kohm.
2.3. Spike quantification
The spike quantification was performed in the CURRY6 software (Neuroscan-Compumedics) and MatLab (R2018a) and included the fol-lowing steps (Fig. 1a):
Visual inspection by an experienced clinical neurophysiologist of the raw EEG and selection of representative spikes to quantify. Offline automatic template match search of similar spikes in the whole recording.
Selection of spikes with higher than 85% correlation and 60% peak amplitude with respect to the template spike.
The peak detection time of the remaining spikes was used as input to the script published by Larsson et al. [5], running in Matlab. Epochs of 3 s were used for discretizing the trace in on–off periods, [10], and the per-centage off on periods in 200 consecutive epochs, yielding a SI number for each 10 min of recording.
The maximum SI for each of thefirst four sleep cycles were deter-mined and averaged to obtain avgSI. Thefirst, maxSI1, and fourth,
maxSI4, were also individually selected. Those three parameters were used to represent each assessment of SI.
2.4. Clinical response
The clinical response (CR) to therapeutic trials was retrospectively obtained from the individual medical records of each patient, with an emphasis on information on developmental milestones, behavior, inter-personal interaction, and school performance. The clinical impression was formulated by a medical clinical neurophysiologist (AL) and was used to classify each therapeutic trial into one of three options: no CR (no improvement in behavior or school performance), fair CR (detect-able improvement in one of the previous two domains), and good CR (clear improvement in both behavioral and school performances). 2.5. Wearable EEG device
One of the authors (TM) constructed a logger (Neury) with the capa-bility to continuously acquire and store EEG from two bipolar channels at 200 Hz (band-with 0.5–70 Hz), using standard scalp disk electrodes. The device uses an Intan Technologies RHD2216 amplifier chip, and the data are stored in an internal memory (128 MB). The dimensions are 53 × 32 × 15 mm, and the weight is 35 g, including an internal Li-ion re-chargeable battery (Fig. 3c). During the procedure, the device is at-tached to the chest of the patients below the clavicle, using a snap EKG gel electrode which can also function as electrical ground. For the validation studies, the electrodes of the logger were applied 1 cm apart from electrode positions of a medical grade aEEG device (TREX, XLTEK®) so that EEG from the two devices could be compared for the various rhythms and graphic elements.
The position of electrodes on the scalp was established by the clinical neurophysiologist with the aim of recording with the maximal ampli-tude the spikes selected for quantification in previous clinical sleep EEG recordings (either short- or long-term). At the end of the recording, the EEG signal is downloaded to a PC through a mini-USB port connec-tion in the device. The study has been approved by the ethics committee of Centro Hospitalar Psiquiátrico de Lisboa..
3. Results
3.1. Stability of spike maps and temporal profiles in CSWS
In order to evaluate the variability of SI in multiple quantifications, we compared its parameters in two assessments months apart (aver-age: 1.14 years) in the same patient, with no changes in drug therapy. Of the three parameters tested, the avgSI proved to be the one with less variability in the 10 patients tested (Fig. 1c), with a range between assessments of−6.6 to +13% (Fig. 1c).
In general, the spike topography of the most abundant spikes used as templates was similar in the two assessments, except for one patient in which bilateral independent central-parietal spikes shifted hemisphere dominance between studies.
The daily variability was studied in four patients, with continuous recordings spanning three nights. A similar profile of the SI can be seen for the successive nights and naps of each patient (Fig. 1b, left), but some changes in the avgSI can be appreciated (Fig. 1b, right). 3.2. Variation of spike temporal profile with therapy
The effect of pharmacological therapy on the SI profile was studied using the avgSI, as this was the parameter with less variability in the previous assessments. InFig. 2, the changes after the most used thera-pies are shown, together with the range of temporal variability previ-ously determined (Fig. 1c).
In 8 of the 10 patients submitted to corticosteroids, it was possible to reduce the avgSI to a value lower than the previous range of normal
Table 1 Patient data.
Patients Age Sex Epilepsy EEG Imaging Therapy for CSWS⁎
Age onset
Seizure type Cognitive/behavioral impairment
Baseline Spike topogr 1st aEEG
Nr aEEGs
MRI Corticosteroids Sulthiame Ketogenic diet 1
9 M 5 y CPSN GTCS School performance N Right occipital 7 y 6 Normal 9 m (8 y)
2 10 F 4 y CPS + eye deviation N Right temporal-occipital 5 y 1 Normal 3 14 F 3 y Nocturnal PMS School performance, attention N Vertex 8 y 2 Normal 4
20 M 5 y CPS Language, memory N Left central 9 y 3 Thal lesion 12 m (10 y) 6 m (11 y)
5
7 F 4 y CPS None N Bilateral occipital 6 y 1 Normal
6
15 F 8 y PMSN GTCS Language N Bilateral central 8 y 2 Normal
7
16 F 5 y PMS School performance N Vertex 9 y 2 Thal lesion 6 m (9 y)
8
11 F 4 y Aphasic Language, moderate delay
N Left posterior quadrant
5 y 7 Normal 12 m (8 y)
9
15 M 2 y PMS + CPS Moderate delay N Bilateral central 8 y 3 Normal 12 m (8 y) 10
9 M 4 y CPSN GTCS Moderate delay N Right posterior quadrant
8 y 1 Right hemisph stroke 11
11 M 5 y PMSN GTCS School performance N Right temporal 8 y 4 None (8 y)⁎⁎
12
16 M 8 y Nocturnal PMS
Attention N Vertex 9 y 3 Normal
13
16 M 7 y GTCS School performance, language
N Left temporal 8 y 3 Without registration 24 m (9 y) 14 11 M 8 y CPSN GTCS School performance, aggression N Left central + temporal 9 y 7 Normal 6 m (9 y) 8 m (8 y) 15
11 F 2 y PMS None N Vertex 5 y 2 Normal
16
12 F 3 y PMSN GTCS School performance N Vertex 6 y 6 Normal 14 m (4 y) (5 y)⁎⁎
17
8 F PMSN GTCS Severe delay N Right posterior quadrant
7 y 1 Brain malformation 18
25 M 3 y PMS None N Right posterior quadrant
10 y 1 Thal lesion
19
14 M 8 m PMS Moderate delay N Left frontal 8 y 3 Thal lesion
20
16 M 7 m PMS + CPS Severe delay N Right posterior quadrant
10 y 7 Thal lesion (11 y)⁎⁎
21
11 F 4 y Aphasic Sensory aphasia N Left posterior quadrant
4 y 1 Normal
22
11 M 2 y PMS School performance N Right posterior quadrant
8 y 4 Thal lesion (9 y)⁎⁎
23
10 F Nocturnal PMS
Moderate delay N Right central 8 y 1 Normal
24
9 F 2 y PMS Aphasia N Left temporal 3 y 2 Normal
25 9 M – – Aphasia N Bilateral temp-parietal 6 y 1 Mild hydrocephalus 26
11 M 4 y PMS Sensory aphasia N Left temporal 5 y 3 Normal
27 16 M 4 y Nocturnal PMS Language, diplegic cerebral palsy N Bilateral central-parietal 9 y 3 Normal 28
17 M 4 y PMS Sensory aphasia N Left posterior quadrant
5 y 7 Normal 12 m (6 y)
28
10 F 1 y PMS + CPS None N Vertex 10 y 2 Thal lesion
30
9 M – – School performance, attention, aggression
N Bilateral central 8 y 1 Normal
31
12 F 2 y PMSN GTCS School performance N Right posterior quadrant
8 y 7 Thal lesion 5 m (8 y)
32
6 M 1 y Nocturnal PMS
N Right central 10 y 1 Normal
33
10 M 4 y Nocturnal PMS
Attention, language N Left central 4 y 5 Normal 12 m (5 y) 34
12 M Nocturnal PMS
N Right central 9 y 5 Normal 6 m (9 y) 12 m (10 y) 35
11 F 1 y CPS + SPS General delay Slow Right posterior quadrant
2 y 2 Thal lesion
36
3 F 2 y PMS Language, autistic regression
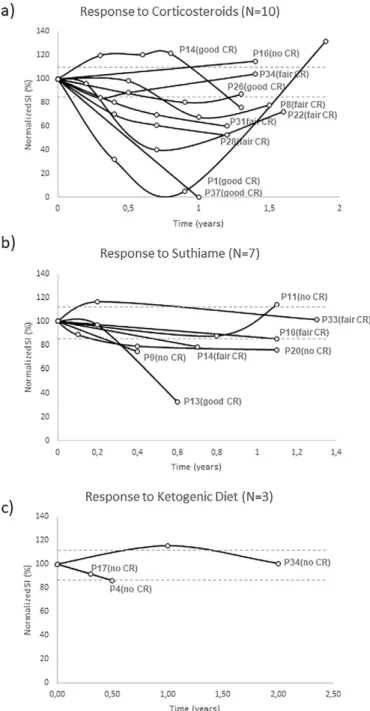
variability and, therefore, to produce a meaningful neurophysiology re-sponse (Fig. 2a). The time necessary to obtain a response proved highly variable, with some patients reaching it after 3–4 months (patients P1 and P37) while others only achieved it after longer periods (P26 and P14). The amount of the response was also very variable, with some pa-tients demonstrating a strong one (P1 and P37), while in the remaining, it was more modest.
Four of the responders presented with a late recurrence (P1, P8, P22, P34). The two nonresponders (P16, P26) were only assessed long after therapy onset, and so we cannot exclude that a short-term response might have occurred.
The 7 patients submitted to therapy with sulthiame showed mean-ingful responses in 4 cases, which were more modest in amplitude than the ones for corticosteroids (Fig. 2b). A notable exception was pa-tient P13 who exhibited a strong response.
In three patients submitted to ketogenic diet, it was not possible to demonstrate a meaningful neurophysiological response (Fig. 2c). Nev-ertheless, the follow-up is short on two cases, which precludes a de fin-itive statement.
An important limitation of the previous analysis is imposed by the sparse assessments after therapy, which is probably a multifactorial consequence of poor tolerability of the child population to repeated aEEG recordings and to the economic burden associated with such studies.
3.3. Correlation of temporal spike profiles from full 10–20 and 2 bipolar channel montages
In order to simplify the process of repeated assessments of the SI pa-rameters, we performed quantification of these parameters using the full set of 10–20 electrodes and a reduced set of 2 bipolar channels ob-tained from the same pretreatment recordings. The two bipolar chan-nels were composed individually for each patient in order to maximize the amplitude of the spikes that the clinical neurophysiologist considered adequate for quantification.
Results of the paired comparison of the avgSI for 19 and 2-channel datasets are represented inFig. 3a and demonstrate a range from −8.2 to +7.4% with an average difference of −1.8%. A paired t-test pro-duced a score of 0.0617 which leads to acceptance of the null hypothesis of no difference between the two dataset means at pb 0.05.
3.4. Validation of Neury 2-channel recording with simultaneous 10–20 montage
The good overlap of the SI obtained from the full 10–20 datasets and a selected 2 bipolar channel montage led us to design a wearable device (Fig. 3c), able to record two bipolar channels with medical grade quality for 24 h, with the goal of simplifying the process of quantification of spike activity in the clinical setting.
The Neury device was validated against a medical grade aEEG re-corder in a group of healthy subjects and then in patients with epilepsy submitted to clinical studies. A side by side comparison of the back-ground rhythms and spike activity revealed an excellent concordance
between the two devices, which was also apparent when comparing ictal recordings (Fig. 3b, below).
The typical application time of the Neury device, including con-nection of 4 electrodes on the scalp with collodium and placement on an ECG chest snap electrode, which functions both as electrical ground and support for the device, was around 15 min. This was much less than the typical 60–90 min for setting up the full 10–20 system montage. The tolerability of the Neury device was also re-ported as excellent by the patients, with no interference rere-ported in the daily activities.
The comparison of the SI obtained from the medical grade device and the Neury in patients with CSWS was within the variation range of the previously performed comparison of 19 referential to 2 bipolar electrodes (Fig. 3d), with an average difference of−2.8%.
4. Discussion
The quantification of the SI in a group of patients with CSWS highlighted the ability to simplify the conventional methodology with the use of a small wearable EEG logger, with a relevant reduction of the recording preparation time and improved tolerability, both of which can contribute to increasing patient adherence to a more fre-quent sampling of the SI throughout the natural history of the condition, allowing a better characterization of the natural and therapy-induced changes in the SI.
The analysis of the SI in our group of patients demonstrated an inter-individual variability which was of the same magnitude of the one found in previous studies (reviewed in [8]), ranging from average values higher than 85% to values less than 50% (Fig. 3a). The individual variation of the SI in the same patient several months apart, with no change in therapy, was much less (Fig. 1c) than the day-to-day variabil-ity (Fig. 1b). Our observations support the usefulness of individual as-sessments of the SI throughout the natural history of the syndrome as an effective monitoring method and provide us with normality ranges of variability to evaluate the effectiveness of therapeutic trials to reduce the spike activity at the heart of the CSWS.
The follow-up of SI in cases submitted to the most common therapies supports the well-known higher effectiveness of corticosteroids over both sulthiame and the ketogenic diet (reviewed in [7]) (Fig. 2), but most im-portantly puts in evidence a high variability in both the amount of the re-sponse and the time required to achieve it in individual patients. In the data fromFig. 2, a clear trend for recurrence of spike activity after stopping corticosteroids, which likely heralds clinical deterioration, can also be found. A more detailed assessment of the individual profile of the re-sponses to therapy onset and offset would benefit from a more frequent sampling of the SI than the one typically used in our study and in most clinics at the present time. Such improved sampling would provide the chance to determine the temporal relation between changes in the SI and clinical worsening/improvement, which is not possible in our current study because of the sparse SI determinations available.
Because of the significant morbidity associated with corticoste-roids, and the need for long-term trials, a fast and consistent method of assessing the clinical effects is highly desirable so that doses can be
Table 1 (continued)
Patients Age Sex Epilepsy EEG Imaging Therapy for CSWS⁎
Age onset
Seizure type Cognitive/behavioral impairment
Baseline Spike topogr 1st aEEG
Nr aEEGs
MRI Corticosteroids Sulthiame Ketogenic diet 37 8 M 4 y PMS Language N Left temporal–parietal 3 y 8 Normal 13 m (5 y), 8 m (7 y) 38
4 M – – Language, aggression N Left central 4 y 1 None CPS—complex partial seizures; PMS—partial motor seizures; GTCS—generalized tonic–clonic seizures; aEEG—ambulatory EEG.
⁎ Duration in months (m), age of onset in years (y). ⁎⁎ Ongoing therapy.
Fig. 1. a) Methodological steps for the quantification of SI parameters, from EEG visual inspection (left) to the final all-night SI profile (right). b) Continuous SI curve of four patients (P19, P18, P1, and P35) with three all-night recordings. A similar profile is apparent in several nights, with a small variability in the avgSI quantified on the right graph. c) Variability in the SI parameters between two assessments separated by several months (average: 1.14 years) with no change of therapy. The avgSI parameter is the one with less variability (−6.6% to 13%). Right, sample SI profiles for patient P7.
kept to an effective minimum. The conventional method of relying on cognitive/behavioral or school performance improvements to ad-just therapy suffers from the well-known delay of these indicators in relation to neurophysiological spike quantifications [3]. We there-fore propose that more frequent quantification of the SI can have an important role in timely adjustment of pharmacological thera-pies, particularly in the ones associated with important secondary effects.
The ability to simplify the quantification of the SI with the use of a re-duced set of scalp electrodes relies on the spatial stability of spike
activity throughout time. Our studies [11] and other's (reviewed in [12]) suggest that the spike activity associated with CSWS remains fo-calized in most patients, if care is taken to correct the confusing effect of secondary propagation patterns associated with the onset of sleep. Nevertheless, in a few cases, a clear shift in the dominant focus is appar-ent in repeated assessmappar-ents [13]. In order to overcome this possibility, we recommend the association of a conventional nap recording, which can provide a sensitive assessment of the spike pattern of the first cycle of sleep [4] and inform on the spatial distribution of the dom-inant spike activity, with a full 24-h SI assessment.
Repeated all-night quantifications of the SI are clearly more accurate that extrapolations obtained from conventional nap recordings which only sample thefirst cycle of sleep (reviewed in [4]). Some patients dem-onstrate a clear decrease in later cycles, and a good response to therapy can, at an early stage, be limited to those late stages of sleep and not be apparent in thefirst one [8].
The proposed wearable device takes advantage of the reduced num-ber of electrodes required for SI quantification, to minimize the weight and inconvenience associated with conventional full 10–20 ambulatory recorders. The additional benefits in preparation time, portability, re-duced social impact, and freedom of movement are particularly welcome to improve the tolerability [14] to repeated assessments in the typical child with CSWS.
The simplification of SI quantification to a set of 2 bipolar electrodes proved effective to sample the dominant spike patterns associated with CSWS in our patients, and the improved signal-to-noise ratio obtained by optimizing spike amplitudes with the individual tuning also made more robust the selection of the more adequate spike to perform the cru-cial template matching automatic search for spikes. This benefit is ob-tained at the expense of decreased sensitivity to less dominant spikes that might be present.
At the present stage, we feel that a more consistent quantification of the SI is obtained by selecting individual spike types (eventually more than one per patient) and performing a template match search, than quantifying all spikes together, because not all types show the same sen-sitivity to sleep onset [13] and mixing different types can increase noise in the data. An additional factor that plays against detecting all spikes to-gether relates to the fact that during sleep, secondary propagation pat-terns frequently arise, which can artificially increase detections and further compromise an accurate quantification.
Limitations of the paper are fundamentally its exploratory and retrospective character, which relied on clinical decisions on the timing of the SI quantifications and therefore led to nonuniform sam-pling across the diverse patients. This limitation nevertheless high-lights current clinical practices, where no clinical guidelines are presently established on the most appropriate strategy, and supports our suggestion that a more frequent sampling would certainly result in a more accurate and clinically useful understanding of the individ-ual time course of spike activity. Also, the heterogeneous number of patients in the different therapeutic groups precludes an unbiased comparison among them. Our goal in this respect was not so much to make this comparison but instead to demonstrate the large vari-ability in individual responses, which could benefit from more fre-quent SI determinations.
Declaration of competing interest None.
Acknowledgments
The authors are grateful to several pediatric neurologists who have referred the patients for neurophysiological studies and provided us with information on the results of the therapeutic trials performed. Funding for development of the EEG logger has been provided by a grant from AL Neurofisiologia Lda.
Fig. 2. a) Evolution of the avgSI under therapy with corticosteroids. The duration of therapy was variable between patients, ranging from 5 to 29 months (average: 10.6). The normalized avgSI range time course (dotted lines in gray), revealed widely variable maximum effect of therapy and also a variable time of onset of the neurophysiological response. In 4 patients, a recurrent pattern after an early response is apparent in the follow-up (P1, P22, P26, P8). b) Response for therapy with sulthiame puts in evidence a more modest response in the avgSI, except for patient P13, which demonstrated a strong reduction in the parameter. c) The ketogenic diet produced no clear response, but a reduced number of patients and assessments are available.
Fig. 3. a) Comparison of avgSI quantification from 10–20 montage and from the 2-channel bipolar one in N = 28 patients, left. The distribution of avgSI differences ranged from −8.2 to +7.4%, with a mean value of−1.8%, right. b) Comparison of electrical potentials from adjacent electrodes (1 cm apart) from a medical grade device and the Neury wearable, for baseline rhythms (upper curves), for spike activity (middle curves), and for ictal recordings (lower curves). c) Image of Neury wearable with and without enclosure as compared with 1-euro coin. d) Comparison of avgSI quantifications from 10–20 montage (medical grade device) and from simultaneous Neury recordings in N = 6 patients. The average difference between the two sets of data was−2.8%. Example of two all-night avgSI profiles obtained from the two devices used simultaneously in patient P14, right.
References
[1] Patry G, Luagoubi S, Tassinari C. Subclinical“electrical status epilepticus” induced by sleep in children. A clinical and electroencephalographic study of six cases. Arch Neurol 1971;24:242–52.https://doi.org/10.1001/archneur.1971.00480330070006. [2] Dorris L, O'Regan M, Wilson M, Zuberi S. Progressive intellectual impairment in
chil-dren with encephalopathy related to status epilepticus during slow sleep. Epileptic Disord 2019;21(Suppl. 1):S88–96.https://doi.org/10.1684/epd.2019.1063. [3] Maltoni L, Posar A, Parmeggiani A. Long-term follow-up of cognitive functions in
pa-tients with continuous spike–waves during sleep (CSWS). Epilepsy Behav 2016;60: 211–7.https://doi.org/10.1016/j.yebeh.2016.04.006.
[4] Boer M. Guidelines for EEG in encephalopathy related to ESES/CSWS in children. Epilepsia 2009;50(Suppl. 7):13–7.https://doi.org/10.1111/j.1528-1167.2009.02211.x. [5] Larsson P, Wilson J, Eeg-Olofsson O. A new method for quantification and assessment of
epileptiform activity in EEG with special reference to focal nocturnal epileptiform activ-ity. Brain Topogr 2009;22:52–9.https://doi.org/10.1007/s10548-008-0072-3. [6] Tassinari C, Rubboli G. Encephalopathy related to status epilepticus during slow
sleep: current concepts and future directions. Epileptic Disord 2019;21(Suppl. 1): S82–7.https://doi.org/10.1684/epd.2019.1062.
[7] Jansen F, Nikanorova M, Peltola M. Current treatment options for encephalopathy related to status epilepticus during slow sleep. Epileptic Disord 2019;21(S1): S76–81.https://doi.org/10.1684/epd.2019.1061.
[8] Cantalupo G, Pavlidis E, Beniczky S, Avanzini P, Gardella E, Larsson P. Quantitative EEG analysis in encephalopathy related to status epilepticus during slow sleep. Epi-leptic Disord 2019;21(S1):S1–S10.https://doi.org/10.1684/epd.2019.1055. [9] Gardella E, Kolmel M, Temey D, Petersen Khinchi M, Pavlidis E, Olofsson K, et al.
Afetrnoon nap vs. all-night sleep EEG for the diagnosis of ESES. Epilepsia 2016;57 (Suppl. 2):77.https://doi.org/10.1111/epi.13609.
[10] Peltola M, Palmu K, Liukkonen E, Gaily E, Vanhatalo S. Semiautomatic quantification of spiking in patients with continuous spikes and waves in sleep: sensitivity to set-tings and correspondence to visual assessment. Clin Neurophysiol 2012;123(7): 1284–90.https://doi.org/10.1016/j.clinph.2011.12.001.
[11] Leal A, Calado E, Vieira JP, Mendonça C, Ferreira JC, Ferreira H, et al. Anatomical and physiological basis of continuous spike-wave of sleep syndrome after early thalamic le-sions. Epilepsy Behav 2018;78:243–55.https://doi.org/10.1016/j.yebeh.2017.08.027. [12] Gibbs S, Nobili L, Halász P. Interictal epileptiform discharges in sleep and the role of
the thalamus in encephalopathy related to status epilepticus during slow sleep. Ep-ileptic Disord 2019;21(Suppl. 1):S54–61.https://doi.org/10.1684/epd.2019.1058. [13] Gardella E, Cantalupo G, Larsson P, Fontana E, Bernardina B, Rubboli G, et al. EEG
fea-tures in encephalopathy related to status epilepticus during slow sleep. Epileptic Disord 2019;21(S1):S22–30.https://doi.org/10.1684/epd.2019.1054.
[14] Bruno E, Simblett S, Lang A, Biondi A, Odoi C, Schulze-Bonhage A, et al. Wearable technology in epilepsy: the views of patients, caregivers, and health professionals. Epilepsy Behav 2018;85:141–9.https://doi.org/10.1016/j.yebeh.2018.05.044.