Discovery of novel bioactive
compounds: Molecular
awakening of silent clusters
in
Streptomyces natalensis
by
Rui Filipe Ferreira Vilar da Silva
Integrated Master in Bioengineering – Molecular Biotechnology
Master Thesis
Discovery of novel bioactive compounds: Molecular
awakening of silent clusters in Streptomyces natalensis
by
Rui Filipe Ferreira Vilar da Silva
Submitted in partial fulfilment of the requirements for the
Master of Bioengineering degree in the branch of Molecular Biotechnology at the Faculty of Engineering and Institute of Biomedical Sciences Abel Salazar of the University of Porto
Abstract
The healthcare system is facing a serious problem: the emergence of antimicrobial drug resistance. However, antimicrobial drug discovery and development has decelerated considerably throughout the past decades, creating an urgent need for the development of new strategies for antibiotic discovery. Streptomyces are the native producers of approximately 75% of the antibacterial drugs in clinical use and it is believed that we are only taking advantage of a small part of their production potential.
In this work, we performed an in silico genome mining approach combined with genetic engineering, for the development of novel hit compounds that will ultimately feed the drug discovery pipeline.
Genome mining analysis of S. natalensis ATCC 27448 unveiled 29 biosynthetic gene clusters coding for unknown specialized products. Six of these were submitted for an in silico and transcription analysis. Three predicted positive cluster situated regulators (CSRs), located within three different clusters and that showed no expression under laboratory conditions were selected for overexpression. RT-PCR analysis of S. natalensis strains overexpressing the CSR encoding genes SNA01173, SNA01239 and SNA06246 did not show up-regulation of structural genes at the analysed time point. Comparative metabolic profiling assays by bioassays and HPLC revealed different production patterns which suggest that novel biologically active compounds might being produced. Such products may further feed the drug discovery pipeline. Finally, overexpression of SNA01239 and SNA01173 also significantly altered pimaricin yield.
Supervisor: Marta Vaz Mendes, PhD
Co-supervisor
:
Tiago Beites, PhDYou can't put a limit on anything. The more you dream, the farther you get.
Acknowledgments
I would like to thank my supervisor, Doctor Marta Vaz Mendes, for the opportunity she gave me to work, not only at a group that I am keen on, but also in a very interesting, ambitious and well planned project. I am also grateful for her guidance and help during this semester. Since I have been working at the IBMC – Cell and Applied Microbiology group I feel that, besides improving my technical capabilities in regard of scientific experiments, I have developed my autonomy and improved my cognitive and research capabilities. This fact would not be possible without some good and committed leadership. For all of that I am truly thankful.
I also would like to thank my co-supervisor, Tiago, for being there every day, teaching me new experiments, encouraging me when I most needed it and listening to all my doubts, fears and questions. His patience with me was admirable and priceless.
My thanks to IBMC – Cell and Applied Microbiology group members Rita Vilaça, Rute Oliveira, Sílvia Pires and Nuno Carvalho for their interest, availability and encouragement. They had a boundless patience, answering all my never-ending questions at any time. Moreover, altogether, they have created the most amazing atmosphere at the laboratory, making daily life richer and more fun. Because of that, I am tremendously grateful to all.
I am also thankful to the members of IBMC - Redox Cell Signalling and Bioengineering
and Synthetic Microbiology groups for all the help and friendship.
Special thanks to my very good friends: João Pedro Almeida, Sérgio Baptista, Liliana Pinho, Henrique Duarte, Frederico Carpinteiro, Miguel Ferraria, Sara Campos and Vitor Pereira, for their love, unconditional support and encouragement. Furthermore, I would also like to acknowledge my swimming coach, Rui Borges, as well as my swim mates Ana Neto, Bernardo Valente, Bruno Silva, João Travanca, Júlio Gonçalves, Maria Amorim, Nuno Guerra and Tomás Silva, for their friendship and willingness to put up with all my (monotonous) laboratory conversations.
To Connor Cassidy, Máté Ambrus, Schuyler Ellis, Anis Ouguenoune, André Meireles, Miren Otaegi, Tímea Balogh, Ágnes Duzs, Hegedűs Botond, Carlos Martínez, Laura Felix, despite the fact that we do not talk that often, mostly due to the geographical distance between us, I address my sincerest thanks. They are all very important people to me and I have learned a lot from each one of them.
Last, but not the least, a few words to my family: mum, dad, Mitó, Guigo, Rozinho, Ná, Zézé, Vovó Dilita, Inha and Nana! Since I remember I have always been taught to study and work as much as I can so one day I may have the reward. Furthermore, they have also been
there for me, at any time, no matter what. That are no words that can describe how truly thankful I am to all of them. Their love and help will never be forgotten.
I have saved a last couple of words to my grandfather, Zé. He was an inspiration of what a human being must be: hard worker, but, simultaneously, generous person and lover of life. Wherever you are, “Obrigado”!
List of contents
Abstract ... i
Acknowledgments ... v
List of contents ... vii
List of figures ... ix
List of tables ... xi
List of abbreviations ... xiii
1. Introduction ... 1
1.1 The need for novel compounds ... 3
1.2 Streptomyces and specialized metabolites ... 4
1.3 Genome mining ... 5
1.4 Silent clusters activation strategies ... 7
1.5 Aim of this work ... 10
2. Materials & methods ... 11
2.1 Strains, growth conditions and plasmids ... 13
2.1.1 Streptomyces strains ... 13
2.1.2 Escherichia coli strains ... 13
2.1.3 Test microorganisms ... 13
2.1.4 Plasmids ... 14
2.2 DNA procedures ... 14
2.2.1 Purification of total DNA from Streptomyces ... 14
2.2.2 Enzymatic manipulation of DNA ... 14
2.2.3 Transformation of E. coli strains ... 15
2.2.4 Intergeneric conjugation ... 15
2.2.5 Southern blot hybridization ... 16
2.3 Purification of total RNA from Streptomyces ... 16
2.4 Polymerase Chain Reactions (PCR) and Reverse Transcription (RT) PCR ... 17
2.5 Bioassay experiments ... 19
2.6 Analysis of specialized metabolites by high performance liquid chromatography (HPLC) ... 19
2.7 In silico analysis ... 20
2.7.1 Prediction and analysis of secondary metabolite biosynthetic gene clusters .... 20
2.7.2 Internet resources ... 20
3. Results and discussion ... 21
3.1 S. natalensis ATCC 27448 genome mining ... 23
3.1.1 S1C1 – a putative terpene biosynthetic gene cluster ... 24
3.1.2 S1C2 – a putative type II PK-terpene hybrid biosynthetic gene cluster ... 28
3.1.3 S1C3 – a putative type III PK biosynthetic gene cluster ... 35
3.1.4 S1C4 – a putative bacteriocin biosynthetic gene cluster ... 38
3.1.5 S1C5 – a putative NRP biosynthetic gene cluster ... 41
3.1.6 S5C20 – a putative type I PK-NRP biosynthetic gene cluster ... 47
3.1.7 Conclusions... 52
3.2.1 Strategy ... 53
3.2.2 Exconjugants validation... 54
3.2.3 Transcription analysis of the exconjugants ... 56
3.2.4 Comparative metabolomics ... 63
3.2.5 Conclusions... 71
4. Concluding remarks and future perspectives... 75
5. References ... 81
6. Appendix I ... 91
List of figures
Figure 1 – Logistic model reflecting the trend of antimicrobial compounds discoveries per year,
from 1947 to 1997 ... 4
Figure 2 – The life cycle of Streptomyces spp. ... 4
Figure 3 – The influence of the sources of carbon, nitrogen, and phosphate upon CSR expression ... 10
Figure 4 – Schematic representation of cluster S1C1. ... 25
Figure 5 – Schematic representation of terpenes biosynthesis ... 26
Figure 6 – 2-methylisoborneol (MIB) ... 27
Figure 7 – Transcription analysis of S1C1 selected genes by RT-PCR ... 28
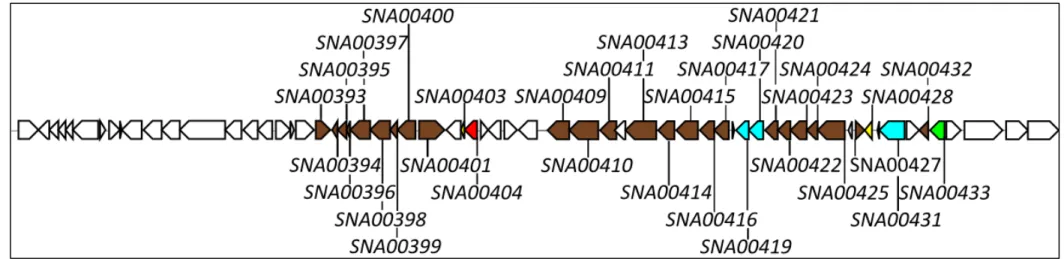
Figure 8 – Schematic representation of cluster S1C2 ... 30
Figure 9 – Top five S1C2 homologous gene clusters regarding synteny ... 31
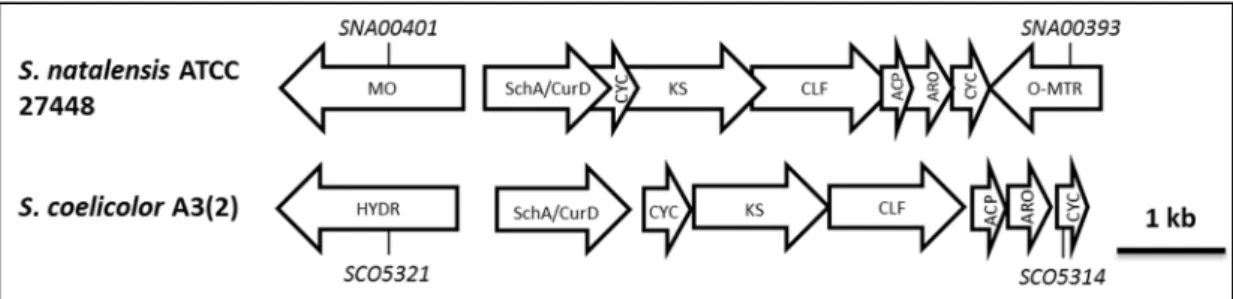
Figure 10 – Organization of the S1C2 putative polyketide subcluster in S. natalensis ATCC 27448, together with the whie cluster in S. coelicor a3(2) ... 31
Figure 11 – Schematic representation of the proposed possible biosynthetic pathways for the S1C2 terpene biosynthesis ... 32
Figure 12 – Transcription analysis of S1C2 selected genes by RT-PCR ... 34
Figure 13 – Schematic representation of cluster S1C3 ... 36
Figure 14 – Schematic representation of some type III PKS gene clusters from streptomycetes. ... 37
Figure 15 – Transcription analysis of S1C3 selected genes by RT-PCR ... 38
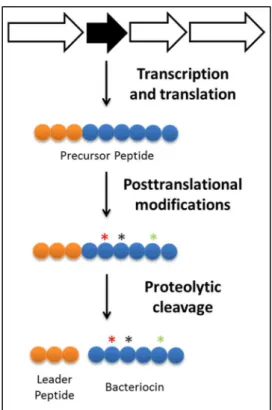
Figure 16 – Bacteriocins biosynthesis ... 39
Figure 17 – Schematic representation of cluster S1C4 ... 40
Figure 18 – Transcription analysis of S1C4 selected genes by RT-PCR ... 41
Figure 19 – Schematic representation of cluster S1C5 ... 43
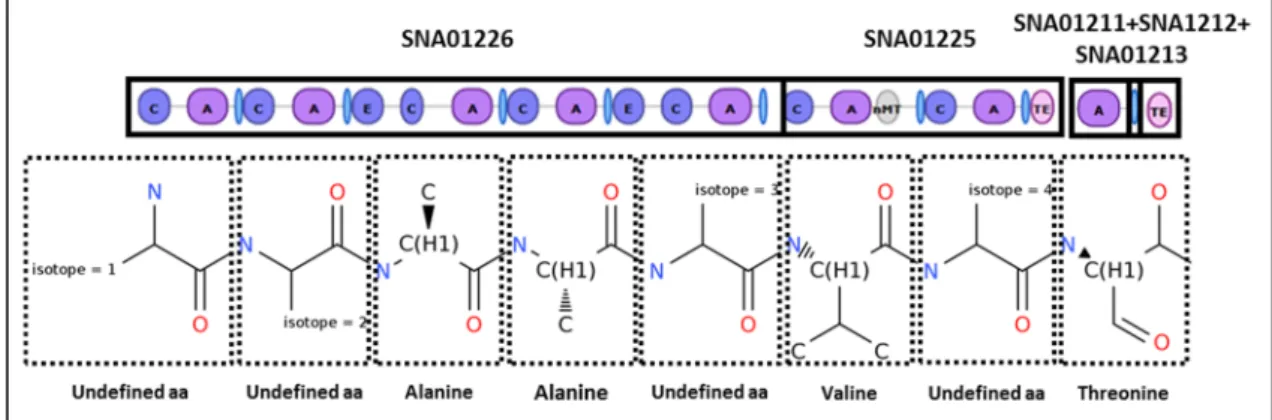
Figure 20 – Antismash prediction for protein domain specificities and chemical structure of the S1C5 NRP ... 44
Figure 21 – Top S1C5 homologous gene cluster: himastatin biosynthetic gene cluster from Streptomyces himastatinicus ATCC 53653 ... 44
Figure 22 – Himastatin chemical structure ... 44
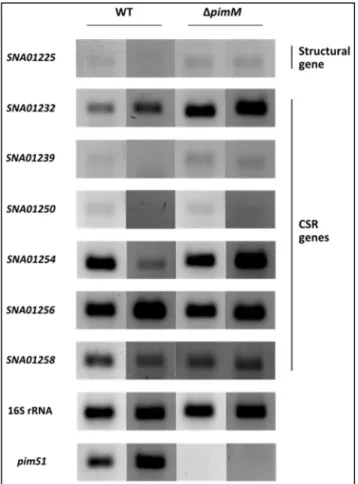
Figure 23 – Transcription analysis of S1C5 selected genes by RT-PCR ... 46
Figure 24 – Schematic representation of cluster S5C20 ... 48
Figure 25 – Antismash prediction for protein domain specificities and chemical structure of the S5C20 hybrid PK-NRP ... 49
Figure 26 – Transcripton analysis of S5C20 selected genes by RT-PCR ... 51
Figure 27 – Schematic representation of the chosen approach for the overexpression of the selected genes in S. natalensis and S. natalensis ΔpimM ... 54
Figure 28 –PCR validation of exconjugants ... 55
Figure 29 – Southern blot confirmation of strains S. natalensis [pIB139] and S. natelensis ΔpimM [pIB139] genetic identity ... 57
Figure 30 – Southern blot confirmation of strains S. natalensis [pIBSNA01173] and S. natelensis ΔpimM [pIBSNA01173] genetic identity ... 58
Figure 31 – Southern blott confirmation of strains S. natalensis [pIBSNA01239] and S. natelensis ΔpimM [pIBSNA01239] genetic identity ... 59
Figure 32 – Southern blott confirmation of strains S. natalensis [pIBSNA06246] and S.
natelensis ΔpimM [pIBSNA06246] genetic identity. ... 60
Figure 33 – Transcription analysis of S1C5 selected genes by RT-PCR ... 61
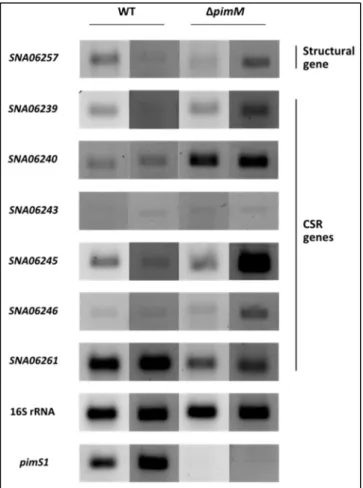
Figure 34 – Transcripton analysis of S5C20 selected genes by RT-PCR ... 61
Figure 35 – Transcription analysis of S1C4 selected genes by RT-PCR ... 63
Figure 36 – Bioassay results for the collected culture medium, using Saccharomyces cerevisiae as test organism ... 64
Figure 37 – HPLC chromatogram at 304 nm of S. natalensis culture broth extracts ... 65
Figure 38 – Last step for pimaricin biosynthesis: de-epoxypimaricin conversation into pimaricin, catalysed by PimD ... 66
Figure 39 – HPLC chromatogram at 400 nm of S. natalensis [pIBSNA06246] and S. natalensis [pIB139] culture broth extracts ... 67
Figure 40 – HPLC chromatogram at 400 nm of S. natalensis [pIBSNA01239] and S. natalensis [pIB139] culture broth extracts ... 67
Figure 41 – HPLC chromatogram at 400 nm of S. natalensis [pibsna01173] and S. natalensis [pIB139] culture broth extracts ... 68
Figure 42 – Peak areas per dry weight (mg) ratios identified in HPLC chromatograms at 400 nm ... 68
Figure 43 – HPLC chromatogram at 400 nm of s. Natalensis ΔpimM [pIBSNA06246] and S. natalensis [pIB139] culture broth extracts ... 70
Figure 44 – HPLC chromatogram at 400 nm of S. natalensis ΔpimM [pIBSNA01239] and S. natalensis [pIB139] culture broth extracts ... 70
Figure 45 – HPLC chromatogram at 400 nm of s. Natalensis ΔpimM [pIBSNA01173] and S. natalensis [pIB139] culture broth extracts ... 71
Figure 46 – Pimaricin production ... 71
Figure A1 – HPLC diode array analysis of S. natalenis wild-type culture broth extract. ... 105
Figure A2 – HPLC diode array analysis of S. natalenis [pIB139] culture broth extract ... 105
Figure A3 – HPLC diode array analysis of S. natalenis [pIBSNA06246] culture broth extract ... 106
Figure A4 – HPLC diode array analysis of S. natalenis [pIBSNA01239] culture broth extract ... 106
Figure A5 – HPLC diode array analysis of S. natalenis [pIBSNA01173] culture broth extract ... 107
Figure A6 – HPLC diode array analysis of S. natalenis ΔpimM culture broth extract ... 107
Figure A7 – HPLC diode array analysis of S. natalenis ΔpimM [pIB139] culture broth extract . 108 Figure A8 – HPLC diode array analysis of S. natalenis ΔpimM [pIBSNA06246] culture broth extract. ... 108
Figure A9 – HPLC diode array analysis of S. natalenis ΔpimM [pIBSNA01239] culture broth extract. ... 109
Figure A10 – HPLC diode array analysis of S. natalenis ΔpimM [pIBSNA01173] culture broth extract ... 109
List of tables
Table 1 – Primers used in this work ... 17
Table 2 – S. natalensis ATCC 27448 biosynthetic gene clusters predicted by antiSMASH ... 24
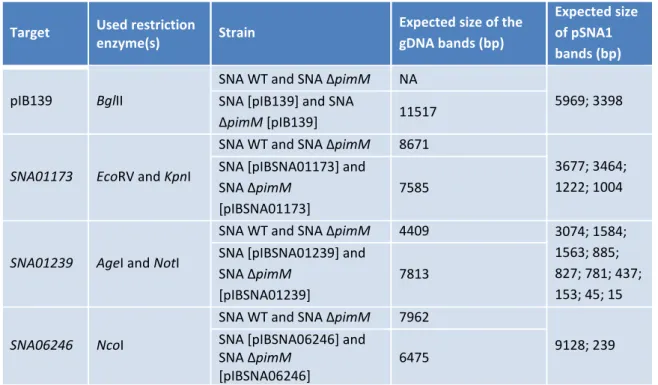
Table 3 – Expected sizes of the amplicons of the different S. natalensis (SNA) strains ... 54
Table 4 – Expected sizes for Southern hybridization bands of the different S. natalensis (SNA) strains ... 56
Table A1 – BLASTp analysis of S1C1 encoding genes ... 93
Table A2 – BLASTp analysis of S1C2 encoding genes ... 94
Table A3 – BLASTp analysis of S1C3 encoding genes ... 96
Table A4 – BLASTp analysis of S1C4 encoding genes ... 97
Table A5 – BLASTp analysis of S1C5 encoding genes ... 98
Table A6 – BLASTp analysis of S5C20 encoding genes ... 100
Table A7 – Typical roles of the different families of regulators identified in the selected clusters ... 102
List of abbreviations
1-deoxy-D-xylulose 5-phosphate DOX
1-deoxy-D-xylulose 5-phosphate synthase DXS
2-methylisoborneol MIB
Acyl carrier protein ACP
Acyltransferase AT
Adenylation A
Amino acids aa
Antimicrobial resistance AMR
Aromatase ARO
Base pairs bp
cAMP receptor protein CRP
Chain length factor CLF
Chalcone synthase CHS Cluster-situated regulators CSR Coenzyme A CoA Condensation C Cyclase CYC Dehydratase DH Digoxygenin DIG
Dimethyl sulphoxide DMSO
Dimethylallyl diphosphate DMAPP
Enoylreductase ER
Ethylenediamine tetracetic acid EDTA
European Molecular Biology Laboratory EMBL
Farnesyl diphosphate FPP
Farnesyl diphosphate synthase FPPS
Fumarate and nitrate reduction regulatory protein FNR
Geranyl diphosphate GPP
Geranyl diphosphate synthase GPPS
Geranylgeranyl diphosphate GGPP
Geranylgeranyl diphosphate synthase GGPPS
Glyceraldehyde-3-phosphate G3P
Helix-turn-helix HTH
Hydroxylase HYDR
Isopentenyl diphosphate IPP
Isopentenyl diphosphate isomerase IPPI
Isopropyl β-D-1-thiogalactopyranoside IPTG
Ketosynthase KS
Luria-Bertani LB
Major facilitator superfamily MFS
Mass Spectrometer MS
Methylerythritol phosphate MEP
Mevalonate MVA
Monooxygenase MO
Multidrug resistance MDR
National Centre for Biotechnology Information NCBI
Nuclear magnetic resonance NMR
O-methyltransferase O-MTR
Optical density OD
Over-night O/N
Peptidyl carrier protein PCP
Phytoene PE
Phytoene dehydrogenase PD
Phytoene synthase PSY
Polyketide synthase PKS
Polymerase chain reaction PCR
ppGpp 5'-diphosphate 3'-diphosphate ppGpp
quantitative RT-PCR RT-qPCR
Retention time RT
Reverse transcriptase polymerase chain reaction RT-PCR
Ribonucleic acid RNA
RNA polymerase RNAP
Room temperature RT
Rotations per minute rpm
Squalene synthase SQS
Thioesterases TE
Tripeptidyl aminopeptidase TAP
Volume per volume v/v
Weight per volume w/v
World Health Organization WHO
1.1
The need for novel compounds
Antibiotics are agents that, due to their ability to kill microorganisms or suppressing their growth, have been widely used for the treatment of infectious diseases. However, the improper or unsuitable use of these drugs together with a poor prevention and control of infectious diseases, gives rise to the phenomenon known as antimicrobial resistance (AMR).
Infections caused by resistant microorganisms often fail to respond to conventional treatment, resulting in prolonged illness, greater risk of death and higher costs. Each year in the European Union more than 25 000 people die as a direct result of the antibiotic resistant bacteria and is estimated economical loses of 1.5 billion euros (European Centre for Disease Prevention and Control, 2013). In fact, according to the World Health Organization (WHO), the world is heading towards a post-antibiotic era in which common infections and minor injuries, treatable for decades, can kill again.
It should be noted that AMR is a not a novel problem. It has been present in society over the last decades and continues to increase. Moreover, multi-drug resistant Gram-negative bacteria such as Escherichia coli, Klebsiella pneumonia, Acinetobacter baumannii and
Pseudomonas aeruginosa have been red-flagged as antimicrobial priority targets (European Centre for Disease Prevention and Control, 2009, 2013).
Therefore, there is a political and social demand to find a solution for antimicrobial resistance. Besides imposing preventive measures, such as the prudent use of antibiotics, the development of new antimicrobials to control antibiotic-resistant bacteria is needed.
Antimicrobial drug discovery and development has slowed down significantly during the last decades (Watve et al., 2001) (Fig. 1). Only a handful of antibiotics were developed and have hit the market in recent decades. The low profitability of antibiotics’ market from the point of view of pharmaceutical industry (these drugs are only taken for a short time and only when a patient suffers specific infections) has contributed for the lack of investment on the development of new antibiotics. However the need to fight AMR sets antibacterial drugs as a market of billions of dollars (Devasahayam et al., 2010). Moreover, the FDA and its European counterpart, EMA, are now actively committed in encouraging the pharmaceutical industry on developing new antimicrobials and in streamlining the validation of those drugs (Food and
Figure 1 – Logistic model reflecting the trend of antimicrobial compounds discoveries per year, from 1947 to 1997
[Adapted from Watve, et al., 2001].
1.2
Streptomyces
and specialized metabolites
Streptomyces, the largest genus of the Actinobacteria phylum, are Gram-positive,
filamentous, obligated aerobes, soil-dwelling bacteria that present a high G+C content in the genome (Chater and Chandra, 2006). Their life cycle begins with the germination of a spore that leads to the formation of the vegetative mycelium which, after a morphological differentiation, gives rise to the emergence of aerial hyphae (Hardisson et al., 1978). New spores are originated once the aerial hyphae are divided into unigenomic compartments by the septation of the aerial mycelium (Fig. 2).
Over the years, Streptomyces bacteria have attracted the interest of the scientific community due to their ability to produce a wide range of secondary metabolites (a.k.a. as specialized metabolites) of clinical, agricultural and biotechnological value. Nearly 75% of the antibacterial drugs in clinical use are, or are derived from, natural products synthesized by
Streptomyces or other closely related actinomycetes species (Berdy, 2005). Additionally, Streptomyces also produce antifungal (amphotericin), immunosuppressive (e.g. rapamycin and
FK506), neuroprotectant (e.g. meridamycin) and anticancer compounds (e.g. doxorubicin and epothilone), among others. About 7 000 secondary bioactive metabolites have already been isolated from Streptomyces cultures (Berdy, 2005). However, it is estimated that more than 100 000 new bioactive compounds are still waiting to be discovered, which underlines the tremendous unclaimed potential of these bacteria (Watve et al., 2001). Altogether, these facts highlight Streptomyces as a very promising and powerful source of compounds that could be used to fight antibiotic resistance.
Secondary metabolites are considered non-essential for the development and survival of microorganisms but there is no doubt that they play an important ecological role in their ability to adapt to environmental changes. The biosynthesis of these compounds generally occurs in a growth-dependent manner and is regulated by environmental signals.
Current developments in DNA sequencing technologies have made genome sequencing faster, cheaper and more efficient. By October 2014 so far, 19 Streptomyces genomes have been completely sequenced and annotated and 158 more are available in scaffolds at the NCBI database (http://www.ncbi.nlm.nih.gov/genome/). Streptomyces spp. present large linear chromosomes (approximately 8–10 Mb) with over 20 putative secondary metabolite biosynthetic gene clusters per strain on average. The secondary metabolism diversity of these bacteria is reflected on the structural diversity of the proteins that govern the biosynthesis of polyketides, peptides, bacteriocins, terpenoids, aminoglycosides, and other natural products (Staunton and Weissman, 2001, Marahiel and Essen, 2009, Moore, 2008). Nonetheless, only a small fraction of them is expressed under laboratory controlled conditions. These biosynthetic clusters with reduced or no expression are known as silent or cryptic clusters and their activation is an auspicious strategy to produce novel bioactive compounds with the potential to revolutionize drug discovery pipelines.
1.3
Genome mining
Recent advances in DNA sequencing techniques have led to a relatively easy and inexpensive access to large numbers of biosynthetic gene clusters via in silico genome mining. The identification of the gene clusters is facilitated, firstly, by the fact that the resulting
enzymes can be categorised into a small set of families (e.g. terpene cyclases, NRPS, PKS) and, secondly, by the characteristic patterns shared by each protein family at the protein level, which is reflected at the genomic level. These two facts, together with the tendency of biosynthetic genes to be co-localized in the genome and organized in clusters, provide the basis for homology-driven genome mining, where conserved protein motifs and consensus sequences are used to identify the loci of putative biosynthetic clusters (Gross, 2007, Nett et
al., 2009).
Currently there are several available bioinformatics tools for the in silico analysis of specialized metabolite biosynthetic gene clusters. These softwares differ from each other on their usability, which, in turn, depends on the following factors: (1) the quality of the sequence data, the user’s needs, and the user computer proficiency; (2) the capability of performing other functions such as predicting substrate specificity of polymerization enzymes or generating putative 3D structures; and (3) the ability of detecting entire secondary metabolites gene clusters in microbial genomes (Fedorova et al., 2012). The only ones that can actually identify whole biosynthetic gene clusters, rather than individualized genes, as well as different types of secondary metabolites are the Secondary Metabolite Unknown Regions Finder (SMURF; http://jcvi.org/smurf/index.php) and the antibiotics & Secondary Metabolite Analysis Shell (antiSMASH; http://antismash.secondarymetabolites.org/) (Khaldi et al., 2010, Medema
et al., 2011). Both tools incorporate and integrate multiple algorithms dedicated to more
specific analysis, such as Cluster Sequence Analyzer (CLUSEAN), NRPSPredictor, Cluster Scanner (ClustScan), Structure Based Sequence Analysis of Polyketide Synthases (SBSPKS), or Natural Product searcher (NP.searcher).
Finally, it should also be mentioned that what distinguishes antiSMASH from SMURF is the fact that the latter is specific to analyse the fungal secondary metabolites gene clusters, while the first was preferentially developed to examine bacterial genomes. Furthermore, antiSMASH has some other advantages which have turned it a standard tool to analyse the bacterial potential to produce specialized metabolites. Those advantages are: (1) it is comprehensive, rapid and has a good usability; (2) it examines neighbouring regions on the chromosome to predict the entire gene clusters; (3) it allows running additional analyses such as clusters of orthologous groups, (4) it integrates into the pipeline other prediction tools, and (5) it combines more functionalities than any other similar programme (Medema et al., 2011, Blin et
1.4
Silent clusters activation strategies
Several different approaches for the activation of silent clusters in Streptomyces have already been described. Ribosome engineering is one of them. This method arose from the initial finding of the production of the blue-pigmented antibiotic actinorhodin by a
Streptomyces lividans strain with a mutation on the rpsL gene, which encodes the 30S ribosomal subunit protein S12 (Shima et al., 1996). Later, the bacterial alarmone ppGpp was found to bind to RNA polymerase (RNAP) (Artsimovitch et al., 2004), leading to the production of antibiotics (Bibb, 2005, Ochi, 2007). This last discovery suggested that RNAP might be modified in order to mimic ppGpp-bound form and activate the expression of secondary metabolite biosynthetic gene clusters (Lai et al., 2002, Xu et al., 2002). Furthermore, studies with Streptomyces mauvecolor 631689, a strain with no antibacterial activity in any tested medium, demonstrated that when the strain was mutated on the rpoB gene, which encodes the RNAP β subunit, and/or on rpsL, becomes able to produce a family of antibiotics known as piperidamycins. The result was ascribed to the increased affinity of the mutant RNAP to the gene promoters (Hosaka et al., 2009).
Another possible strategy to unlock the clusters expression is to grow bacteria under particular stress conditions or to vary culture conditions (Scherlach and Hertweck, 2009, Williams et al., 2008, Bok et al., 2009). However, this approach is largely empirical, as the physiological conditions responsible for the activation of the silent gene clusters are not clearly understood and it is often not possible to predict the complex regulatory circuits involved in pathway regulation (Scherlach and Hertweck, 2006).
Communication between microorganisms is also another way to induce the expression of silent biosynthesis gene clusters. Its potential was already demonstrated through the intimate interaction between the fungus Aspergillus nidulans and Streptomyces hygroscopicus, which resulted in the activation of a polyketide gene cluster (Schroeckh et al., 2009), or by the co-culturing of Streptomyces clavuligerus with the methicillin-resistant Staphylococcus aureus, which gave rise to the activation of the holomycin biosynthesis by the Streptomyces strain (Charusanti et al., 2012). However, likewise the previous strategy, the activation of the silent gene clusters is not completely understood and it is hard to predict what are the pathways involved.
One other approach to access the compounds uncovered behind silent clusters is to induce their expression in a surrogate strain (Gomez-Escribano and Bibb, 2011). This is a very useful approach while working with difficult-to-culture microorganisms, such as rare terrestrial
and marine actinomycetes (Fenical and Jensen, 2006, Baltz, 2008) or myxobacteria (Wenzel and Müller, 2009), especially at a large scale.
A potential candidate for heterologous protein production is the Gram-negative bacterium Escherichia coli, since it is well-known and its manipulation well established (Terpe, 2006). In fact, E. coli is the most commonly used organism for this kind of experiments. The expression of a cryptic terpene synthase gene of Streptomyces coelicolor in E. coli was already achieved and it led to the identification of a new sesquiterpene, epi-isozaene (Lin et al., 2006). However, the use of a different bacterial genus as a host, such as E. coli, may result in difficulties, namely by the existence of rare codons or an unsuited metabolic background (Kane, 1995, Goldman et al., 1995).
For this reason Streptomyces avermitilis and S. coelicolor, whose genome has already been sequenced, have been utilized for the development of expression hosts (Komatsu et al., 2010, Gomez-Escribano and Bibb, 2012). While bellowing to the same bacterial genus, there is a higher chance for these bacteria to have the required supply of primary metabolic precursors for a successful production of the secondary metabolites, as well as reducing agents and energy source, also derived from primary metabolism, such as NAD(P)+ and ATP (Komatsu et al., 2010). Additionally, the mentioned drawbacks, such as the existence of rare codons, should
no longer exist. In fact, it has already been shown that S. avermitilis is able to produce cephamycin C (from S. clavuligerus ATCC 27064) or pladienolide (from S. platensis Mer-11107) in higher levels than those of the native-producing species (Komatsu et al., 2010). Nevertheless, despite the described advantages, some other technical challenges, such as the transferring of large gene clusters or reduced expression may also stand as an obstacle and compromise the efficacy of this approach. Therefore, new molecular tools addressing those issues, such as the construction of vectors for the shifting of large DNA fragments, are being developed (Jones et al., 2013).
Along with heterologous expression, the recent developments on high-throughput DNA sequencing technologies also contributed to reinforce the cluster-situated regulators (CSRs) manipulation as a strategy to activate silent gene clusters. The first molecular analyses of secondary metabolite biosynthetic gene clusters highlighted the presence of regulatory genes, which often have major effects on the production levels of the related antibiotic (Liu et al., 2013). These CSR regulators, formerly known as pathway-specific, are located within the biosynthetic gene cluster and its regulating activity is often limited to that biosynthetic cluster, although some studies have revealed that pathway-specific regulators can exert a wider effect on global transcription patterns (Huang et al., 2005).
It is a fact that CSRs can directly control the expression and activity of biosynthetic gene clusters. However, it should still be noted that the action of pleiotropic regulators, presenting a wide-range effect over cell metabolism, may also result in the modulation of the biosynthesis of secondary metabolites (Gust et al., 2004) (Fig. 3). For example, in S. coelicolor, the two-component system PhoR-PhoP, besides being the major signal transduction system for phosphate control, it has also been associated with the negative regulation of some secondary, and even primary metabolic pathways (Allenby et al., 2012, Liu et al., 2013). Once phosphorylated by PhoR, PhoP binds to the promoter region of the target gene, influencing its expression. The promoter of afsS, which encodes a global activator of antibiotic production, is a target, and its repression affects indirectly actinorhodin and undecylprodiginine production in S. coelicolor (Santos-Beneit et al., 2009). The CSR encoding gene, cdaR, which regulates the calcium-dependent antibiotic biosynthesis in S. coelicolor, is regulated directly by PhoP (Allenby et al., 2012). Furthermore, PhoR-PhoP system also plays an important role in the regulation of nitrogen metabolism in S. coelicor, due to PhoP ability to bind to the promoter region of glnR. GlnR is the main nitrogen regulator and controls the expression of several genes involved in nitrogen metabolism. In fact the nitrogen metabolism, through a different two-component regulatory system AfsQ1/Q2, may also stand as another example of an indirect effect over CSRs. AfsQ1 has been revealed as a direct repressor of primary nitrogen assimilation genes and as an activator of several CSRs such as actII-ORF4, redZ, and cdaR (Wang et al., 2012). Moreover, AfsQ1 recognizes a moderately conserved pair of sequences similar to that recognized by the nitrogen regulator GlnR, leading to a competition between GlnR activation and AfsQ1 repression (Wang et al., 2012).
Understanding the major role of CSRs highlights their genetic manipulation as a straightforward approach to activate silent gene clusters either by overexpressing activators or deleting repressors. In the year of 2007, Bergmann and co-workers demonstrated that the expression of a putative CSR encoding gene under the control of an inducible promoter causes the expression of a normally silent gene cluster in Aspergillus nidulans upon the addition of the inducer (Bergmann et al., 2007). Aspyridones, the metabolic products of that gene cluster, were identified by comparative metabolic profiling of the wild-type and mutant strains and spectroscopic analyses showed them to have novel structures (Bergmann et al., 2007). In the same way, the overexpression of the CSR samR0484, a LAL-family regulatory gene of
Streptomyces ambofaciens, activated the expression of a cryptic type I PKS cluster, resulting in
the production the stambomycins, macrolides with anti-proliferative activity against cancer lines (Laureti et al., 2011). Concordantly with the previous experiments, the removal of scbR2, a gene encoding an inhibitory protein, allowed initiating the expression of the antibacterial
compound abCPK, from S. coelicolor (Gottelt et al., 2010), and, thus, proving the utility of this approach for discovering new natural products of silent biosynthetic gene clusters that are not expressed in laboratory cultures (Scheffler et al., 2013).
Figure 3 – The influence of the sources of carbon, nitrogen, and phosphate upon CSR expression. Solid lines
represent direct interactions, while the dotted ones represent unknown routes (dotted lines). Arrows indicate activation, and bars indicate repression [Adapted from Liu et al., 2013].
1.5
Aim of this work
The present work aimed to activate silent clusters in Streptomyces natalensis by manipulating CSR encoding genes.
Streptomyces natalensis ATCC 27448 was used as work model. This strain was first
isolated from a soil sample originated from South Africa (Natal province) and is the producer of the antifungal polyene macrolide pimaricin (commercial name natamycin, E235) widely used in the food industry to prevent mould contamination of cheese and other non-sterile foods. Additionally, S. natalensis ΔpimM, a strain that lacks pimaricin production due to the absence of the positive CSR PimM (Anton et al., 2007) has also been used.
As specific objectives it was proposed (1) the in silico and (2) transcription characterization of six biosynthetic gene clusters detected by antiSMASH in S. natalensis genome; (3) the overexpression of three selected CSR; and (4) evaluate the effect of CSR overexpression on the transcription and metabolic profile.
2.1
Strains, growth conditions and plasmids
2.1.1 Streptomyces strains
The Streptomyces strains used in this work were Streptomyces natalensis ATCC 27448, a pimaricin producer, and the derivative S. natalensis 40D9-1 (ΔpimM) (Antón et al., 2007), a pimaricin non-producing strain.
Sporulation was achieved in TBO medium [2% (w/v) oat flakes, 2% (w/v) tomato paste, 2.5% (w/v) agar, pH 6.5] (Higgens et al., 1974) at 28 °C. After 8-10 days of growth, spores were scrapped from solid medium using a 0.025% (v/v) Triton X-100 and 30% (v/v) Glycerol solution, filtered with cotton and stored at -80°C in the same solution. Spore concentration was determined spectrophotometrically at 600 nm using the following ratio: 0.1 units of absorption corresponds to 108 spores per mL (Kieser et al., 2000).
For Streptomyces liquid cultures, 108 spores were inoculated in YEME medium without
sucrose [0.3% (w/v) yeast extract, 0.5% (w/v) bacto peptone, 0.3% (w/v) malt extract, 5 mM MgCl2 and 1% (w/v) glucose] (Kieser et al., 2000) and grew in an orbital incubator shaker at
28°C and 220 rpm, with a ratio of medium culture volume:flask volume of 1:10.
2.1.2 Escherichia coli strains
Escherichia coli ET12567 was used as a donor strain in intergeneric conjugation with Streptomyces. This strain does not methylate DNA (dam-) (MacNeil, 1992), which helps
circumventing the methyl-specific restriction system of Streptomyces. In addition, it harbours the non-transmissible plasmid pUZ8002 that contains the genes (tra genes) necessary for the mobilization of other vectors. Moreover, pUZ8002 also holds kanamycin and chloramphenicol as selection markers. E. coli DH5α was routinely used to transform and replicate plasmid DNA
and also for bioassay experiments.
E. coli strains were routinely grown in LB medium [1% (w/v) bacto-tryptone, 0.5% (w/v)
yeast extract, 0.5% (w/v) NaCl] (Miller, 1972) at 37 °C. For solid LB medium 2% (w/v) agar was added.
2.1.3 Test microorganisms
The Gram-positive bacterial strains Bacillus cereus ATCC 14579, Enterococcus faecalis ATCC 29212 and Staphylococcus aureaus ATCC 29213 were used together with E. coli DH5α and Saccharomyces cerevisiae BY4741, as test organisms for bioassay experiments. These microorganisms were first grown O/N in submerged cultures and 1 mL was used for growth inhibition assays. B. cereus was grown in LB medium at 37°C, Enterococcus faecalis and
Saccharomyces cerevisiae was grown in YPD medium [1% (w/v) yeast extract, 2% (w/v) bacto
peptone, 2% (w/v) glucose] (Ausubel et al., 1992) at 26 °C. For solid TSB and YPD media 2% (w/v) agar was added.
2.1.4 Plasmids
The oriT-containing pIB139 plasmid (Wilkinson et al., 2002) was used for the expression of genes under the strong promoter ermE*p in Streptomyces (Paget et al., 1999). Apramycin stands as the selection marker for this plasmid.
PCR amplicons were cloned in pGEM®-T Easy vector (Promega) for DNA sequencing. Ampicillin is the selection marker for this plasmid, together with lacZ gene that codes for the β-galactosidase.
2.2
DNA procedures
2.2.1 Purification of total DNA from Streptomyces
Purification of total DNA from Streptomyces was carried out using the MasterPure™ Gram Positive DNA Purification Kit (Epicentre). A sample of 1 mL of culture broth was harvested and washed in 1 mL of TE buffer [10 mM Tris-HCl, pH 7.5, 1 mM EDTA]. For cell lysis, mycelium was resuspended in 300 μL of TE Buffer containing 2 μL of Ready-Lyse Lysozyme to each sample and incubated at 37 °C for 1.5 h. Then, 300 μL of Lysis Solution with 2 μL Proteinase K were added to each sample, mixed thoroughly and incubated at 65 °C for 30 min. DNA cleaning and purification was achieved firstly by adding 350 μL of MPC Protein Precipitation Reagent and mixing vigorously by vortex. Next, 2 μL RNAse A were added and samples were incubated at 37 °C for 30 min. Protein precipitation was carried out by mixing the samples with 1 vol. of phenol-chloroform-isoamyl alcohol (25:24:1). The aqueous phase was recovered after centrifugation (10 min, 12100 g) to a new tube and 0.6 vol. of isopropanol and 0.1 vol. of 3 M sodium acetate pH 5.2 were added. Samples were centrifuged at room temperature (10 min, 12100 g) and the supernatant was discarded. The DNA pellet was rinsed with 500 μL cold ethanol 75% (v/v) and resuspended in 50 μL of H2O.
Plasmid DNA was isolated using the GenEluteTM Plasmid Miniprep Kit (Sigma-Aldrich,
Saint Louis, MO) following manufacturers’ instructions.
2.2.2 Enzymatic manipulation of DNA
For the ligation of DNA molecules a ligase isolated from the phage T4 (T4 DNA ligase) was used. T4 DNA ligase from Promega and Fermentas were used according to manufacturers’ instructions.
Restriction endonucleases were used to cleave DNA of specific nucleotide sequences.
EcoRV, NdeI, BglII, AgeI, NcoI and NotI (Fermentas) were used according to the indications
provided by the manufacturer.
2.2.3 Transformation of E. coli strains
E. coli DH5α transformation was performed as previously described (Sambrook and
Russel, 2001). First, 5 µL of recombinant DNA was added to competent cells prepared by the rubidium chloride method and incubated on ice 45 min. Aliquots were then heat shocked at 42°C for 1.5 min, 1 mL of LB was added, and cells were further incubated at 37 °C. Finally, recombinant cells were plated on solid LB medium, supplemented with IPTG (100 μM), X-Gal (20 μg/mL) and ampicillin (50 µg/mL) if transformed with pGEM®-T Easy derivative plasmids, or with apramycin (SIGMA-Aldrich) (50 μg/mL) if transformed with pIB139 derivative plasmids.
E. coli ET12567 [pUZ8002] was transformed by electroporation. Briefly, 1 mL of an O/N
culture was inoculated in 10 mL of fresh LB supplemented with kanamycin (50 μg/mL), and chloramphenicol (25 μg/mL) and grown at 37 °C until an OD600nm of 0.8-0.9. Then, cells were
washed twice in 10 mL of cold-ice H2O and in 5 mL of cold-ice 10% (w/v) glycerol. Cells were
resuspended in 50 mL of 10% (w/v) glycerol and 100 ng of DNA was added. Electroporation was performed in a Gene Pulser® (BioRad) with an intensity of 2.5 Ω. Cells were left to recover at 37 °C for 1 h and plated in solid LB medium supplemented with kanamycin (50 μg/ml), chloramphenicol (25 μg/mL) and apramycin (50 μg/mL).
2.2.4 Intergeneric conjugation
A culture of the donor strain E. coli ET12567 [pUZ8002], harbouring pIB139 or derivatives was inoculated in LB supplemented with kanamycin (50 μg/mL), chloramphenicol (25 μg/mL) and apramycin (50 μg/mL), and grown overnight at 37 °C. 1 mL of this pre-culture was inoculated in 10 mL fresh LB supplemented with the same antibiotics and grown at 37 °C until an OD600nm of 0.5-0.6. Cells were washed twice with LB medium without antibiotics and
resuspended in 25 mL of the same medium. Spores of S. natalensis or S. natalensis ΔpimM were used as recipients. For each strain, 108 spores were washed with 2xTY medium [1.6%
(w/v) bacto-tryptone, 1% (w/v) yeast extract, 0.5% (w/v) NaCl] (Sambrook and Russel, 2001) and resuspended in 500 µL of the same medium. Spores were then subjected to a heat-shock (45 °C for 10 min). 500 µL of E. coli ET1256 [pUZ78002] cells harbouring the plasmid to be transferred was added to the treated spores and the mixture was incubated at 30 °C for 15 min. The mixture was pelleted, resuspended in the residual liquid and spread on MS [2% (w/v) manitol, 2% (w/v) soya flour, 2% (w/v) agar %] (Hobbs et al., 1989) supplemented with 10 mM MgCl2. Plates were incubated at 30 °C for 16-18 h and then overlaid with 500 µL of an aqueous
solution containing apramycin (50 mg/mL) and nalidixic acid (25 mg/mL). Plates were incubated for further 10-15 days until exconjugants appeared. Exconjugants colonies were transferred to a new TBO plate supplemented with nalidixic acid and apramycin. For validation purposes, the identity of all new strains was confirmed by Southern blot hybridization and PCR.
2.2.5 Southern blot hybridization
The screening of the pIB139 plasmid integration into S. natalensis ATCC 27448 and S.
natalensis 40D9-1 was made first by antibiotic resistance selection and confirmed by Southern
blot hybridization, as previously described (Sambrook and Russel, 2001).
Initially, DNA was digested by restriction endonucleases and the resulting fragments were separated by electrophoresis in a 0.8% (w/v) agarose gel. The lambda (λ) phage DNA digested with Hind III labelled with digoxigenin (DIG) (Roche) was used as molecular weight ladder. DNA was transferred from the agarose gel to a nylon membrane (Amersham) in the vacuum system (Bio-Rad) and following manufactures’ instructions.
DNA probes were labelled with digoxygenin using the “DIG-High prime” (Roche) kit and following the protocol provided by the manufacturer. Generally, 300-500 ng of DNA template were used in the digoxigenin labelling procedure. Hybridization and detection were performed as afore described (Sambrook and Russel, 2001) and using the alkaline phosphatase substrate CPD-Star (Roche).
2.3
Purification of total RNA from Streptomyces
Total RNA purification from Streptomyces was performed using RNeasy Mini Kit (Qiagen) and following a protocol optimized for Streptomyces (Beites et al., 2011). Briefly, 500 µL of S.
natelensis culture broth was collected and mixed with 1 mL of RNA Protect Bacteria Reagent
(Quiagen), incubated for 5 min at room temperature, harvested by centrifugation (10 min, 3600 g) and immediately stored at -80 °C. For total RNA extraction, mycelium pellets were resuspended in Buffer RLT with 1% (v/v) β-mercaptoethanol. Cellular disruption was achieved by sonication (Branson Sonifier, Model B-15) using cycles of 5 seconds, duty cycle of 50%and an output of 3. RNeasy Mini Spin columns were used to recover total RNA and DNA was removed by two serial DNase treatments, an in-column DNase I RNase-free (Qiagen), followed by a batch treatment using the DNA-free Kit (Ambion). The absence of genomic DNA was confirmed by PCR.
RNA quantification was assessed by NanoDrop ND-1000 spectrophotometer (Thermo Scientific), and its quality and integrity was evaluated in an ExperionTM Automated
2.4
Polymerase Chain Reactions (PCR) and Reverse Transcription (RT) PCR
DNA amplification by PCR was performed with Pfu DNA polymerase (Fermentas) or GoTaq Flexi DNA Polymerase (Promega) according to manufactures’ instructions. The DNA amplification was performed in a C1000™ Thermal Cycler (BIORAD). Used primers are listed in Table 1.
The genetic identity of the PCR products used for overexpression was confirmed by sequencing (STAB Vida). For gene expression studies 1 µg of DNase-treated total RNA was transcribed with the iScript™ Select cDNA Synthesis Kit (Bio-Rad), following the manufacturer's instructions. To check if there was any trace of genomic DNA in the samples, a standard PCR reaction was performed using specific primers for S. natalensis ATCC 27448 16s rRNA gene and 3 μl of the DNAse treated RNA sample as template. As a positive control it was used the S.
natalensis ATCC 27448 genomic DNA. The housekeeping gene 16S rRNA was used as a positive
internal control for both strains, while the PimM direct target pimS1 (pimaricin biosynthetic gene cluster) (Santos-Aberturas et al., 2011) was used as a negative control for the ΔpimM strains. Genomic DNA was used as control for RT-PCR reactions where transcripts were not detected, or detected in low levels.
Table 1 – Primers used in this work. They are categorized according to their application: RT-PCR, gene
overexpression or strain validation. Primers included in the strain validation category were used for both PCR studies and amplification of the Southern blot hybridization probes. Primers marked with (*) were also utilized for strains validation by PCR. Primers marked with (ϯ) were additionally used for the
development of the probes required for Southern blot hybridization.
Primer Sequence (5’-3’) Target Amplicon Size (bp)
RT-PCR S1C1R1_AS ACCAACGACCAGGACACCCTC SNA00088 119 S1C1R1_S TCGCGCAGGGAACGGAAG S1C1R2_AS ATGCGAACCGGCGAGGAC SNA00096 102 S1C1R2_S GCTGACCCCCATGAAGCACA S1C1S1_AS TCAAGAGCCCCGGCCGAC SNA00095 104 S1C1S1_S GTCGTTGTGGACCTCTACCGCC S1C2R1_AS AAGTGGACCTGGACGGCGAG SNA00399 118 S1C2R1_S TGGAAGACCATCCGGACCTCT S1C2R2_AS GAGTGCGTCGAAGCCATGCG SNA00403 125 S1C2R2_S GCCTTCGCGCCTTCGATGAA S1C2R3_AS GGGCCGTGATGGACGAGACC SNA00404 133 S1C2R3_S CCGGAAGCGAAGGGCATGAC S1C2R4_AS TCATGGACGGTCTGCTGCTG SNA00428 152 S1C2R4_S CTTGGGACGGTAGGGGTGGT S1C2R5_AS ACCTGGTCGTCTTTCTGCGC SNA00433 115 S1C2R5_S TTCTCGGTGATCCACTGCTGG
Table 1 – Primers used in this work (continuation).
Primer Sequence (5’-3’) Target Amplicon Size (bp)
RT-PCR S1C2S1_AS GACACACCGCGACCTTCACC SNA00397 122 S1C2S1_S GAAGACCACATCGACCTCCTCC S1C2S2_AS ACGACCGTACCGCCGACAT SNA00414 157 S1C2S2_S ACGACCGGCAGCGACTTCT S1C3R1.2_AS AGACGCACGGCCTGCTACG SNA00830 117 S1C3R1.2_S TGTAGGTCTGGACGACGATGCC S1C3R2.2_AS TCGTAGCCGGTCAGCAGCC SNA00835 141 S1C3R2.2_S ACACCTCGACGTCCCCGTAC S1C3R3_AS ATTCCCAAGGGGTCGGTGA SNA00851 193 S1C3R3_S GCACCACGAAAGGCAGCTT S1C3S1_AS CCGGCGACCTGGACTTCTACAT SNA00841 133 S1C3S1_S GCGATGTTGCCGTACTCGGTC S1C4R1_AS*; ϯ AGAGTGCGAGGCCGTTGGG SNA01173 106 S1C4R1_S ϯ AACCCGCGCGACATCTGC S1C4S1_AS ATGGCGCTGGGTGTCGGT SNA01166 115 S1C4S1_S CGCCCGCGCCTATGACTT S1C5R1_AS CAGGAACTCCCGGAAGATGCC SNA01232 174 S1C5R1_S AAGGTCGGCAAGGGAACGGT S1C5R2_AS*;ϯ CGCAGAACACTCCGACGCA SNA01239 102 S1C5R2_Sϯ GGTCATGGACCGGGAGCTCT S1C5R3_AS ATCTCGCGGCAGTCCGGTC SNA01250 103 S1C5R3_S CGTGGTGGCCCAGGAAGATG S1C5R4_AS ATCGACGTACGAGGCGAGCT SNA01254 147 S1C5R4_S GAGCGGCACAAGCGTCATCT S1C5R5_AS GATCCTCGCTGAAGGTCGTCTC SNA01258 109 S1C5R5_S CTCCAGGACGCCATCGACTT S1C5R6.2_AS GGACTGGACCCGCTCGAAGA SNA01256 143 S1C5R6.2_S CCAAGGACGACCTCACCCTC S1C5S1_AS GGCAGCAGGTCTACGAGCGTAT SNA01225 117 S1C5S1_S ACTGCCGCATCTCTGCCAGA S5C20R1_AS TGACCGTCCAGGGCACTGAAC SNA06239 108 S5C20R1_S CTTCCGCAGCCACCCATGG S5C20R2_AS ACGGCGAGGCCCTGAATGTAG SNA06240 132 S5C20R2_S CCCCTTGATGCTGCCCAA S5C20R3_AS TGAGCTGGAGGCGACTGTGCT SNA06245 157 S5C20R3_S AAGGATTTCGCCGCCGGA S5C20R4_AS*; ϯ CTTTCCCGGCAGCGATGA SNA06246 157 S5C20R4_S ϯ CCATCTGGGAAATGACGCGC S5C20R5_AS ACGATGCCCTTCCCGCTGA SNA06261 114 S5C20R5_S CTCCGGTTTCTGTTTCTCGCG
Table 1 – Primers used in this work (continuation).
Primer Sequence (5’-3’) Target Amplicon Size (bp)
RT-PCR S5C20R6_AS CGGCAGCCGATGGTGAGTT SNA06243 192 S5C20R6_S CCTCATCCGCGCCTACACG S5C20S1_AS TACTCACCATGGCTGTGCCCC SNA06257 160 S5C20S1_S TGCTGTCCGTGCTGTTCCCT PimS1_AS CCACCTTCGGACGCAACAC pimS1 108 PimS1_S TGGCTCGGCATCGGATCA 16S_AS CTCCTCAGCGTCAGTATCG 16s rRNA 117 16S_S CAGGCTAGAGTTCGGTAGG Gene overexpression SNA01239_F TAGGGCATATGGACGCGATGACCCTCTAC SNA01239 957 SNA01239_R AGGATATCGACTATACGTCGCGGTCGATCCG SNA06246_F GCGGCATATGAAGAACTCACTGCTGGTC SNA06246 672 SNA06246_R CCGATATCTCAGCCGGGGAGGAGGATCTG SNA01173_F GGCCCATATGGTCGTCGTGGCCGAC SNA01173 617 SNA01173_R GCGATATCGGTCAGTGGATGATGCCCGTACG Strains validation
pIB_U_F GGCTTGCGCCCGATGCTAGT pIB139
plasmid 293
pIB_U_R CCGGCTCGTATGTTGTGTGG
2.5
Bioassay experiments
S. natalensis strains were cultured in YEME liquid medium for 72 h, in order to ensure
the production of secondary metabolites. 8 mL of culture broth were centrifuged twice (5 min, 12 100 g) and 250 µL of the recovered supernatants were concentrated, until a final volume of 40 µL, before being transferred to holes of 0.5-cm diameter cut in solid LB, TSB or YPD plates, and let diffuse in the media for 1 h at room temperature. Next, 1 mL of O/N cultures of test microorganisms was added to the plates, within 15 mL of pre-warmed LB, TDB or YPD supplemented with 1% (w/v) agar. Inhibition zones were measured 2 days later using a Vernier caliper.
2.6
Analysis of specialized metabolites by high performance liquid
chromatography (HPLC)
For pimaricin quantification, 500 μL of S. natalensis culture broth was collected and mixed with 1 vol. of methanol. Samples were left 2 h at 30 °C with agitation in order to enhance the extraction of the pimaricin to the organic phase. The organic phase was recovered through centrifugation (5 min, 12 100 g) before HPLC analysis. Pimaricin quantification was performed on a Merck-Hitachi liquid chromatograph (Merck-Hitachi, Tokyo, Japan), equipped
with a detector L-4000, an autosampler L-7250, a pump L-7100, an L-7300 column oven and an interface D-7000. Chromatograms were recorded and processed on a Merck-Hitachi D-7000 HSM PC-based chromatography data system, setting wavelength at 304 nm. Strain metabolic profile was performed on a Dionex UltiMate 3000 system (Thermo Fisher Scientific, Bremen, Germany) equipped with an UltiMate 3000 RS pump, an UltiMate 3000 RS autosampler and an UltiMate 3000 RS column compartment, and coupled to an Accela PDA detector. Both systems were filted with a SunFire™ C18 column (5 μm, 4.6 × 250 mm; Waters). Elution was performed
with a gradient of mobile phase composed of 0.1% (v/v) trifluoroacetic acid (solvent A) and HPLC-grade methanol (solvent B) at a flow rate of 0.6 mL/min and according to the following progam (methanol concentration): 50% B, 0-3 min; 90% B, 3-12 min; 90% B, 12-22 min; down to 50% B, 22-26 min; 50% B, 26-30 min. Purified pimaricin (Biocam) was used as standard solution for the quantification of this metabolite.
Dry weight was used to determine the specific pimaricin production. 1 mL of culture broth was collected and washed twice in 1mL of 0.9% (w/v) NaCl. Mycelium was pelleted by centrifugation (5 min, 12 100 g) and dried at 60 °C for 5 days.
2.7
In silico
analysis
2.7.1 Prediction and analysis of secondary metabolite biosynthetic gene clusters
Secondary metabolite gene clusters were identified in silico using the bioinformatic tool antiSMASH (http://antismash.secondarymetabolites.org/). Additionally, this software was also utilized for the prediction of the putative chemical structures of the products derived from PKS, NRPS or hybrid PKS-NRPS gene clusters, as well as the domain specificities of their biosynthetic core genes. Finally, in order to get more reliable predictions on the clusters’ genes function and the chemical structure of the secondary metabolite, antiSMASH results have been manually curated. In specific, a BLASTp analysis (www.ncbi.nlm.nih.gov/BLAST/) on every gene of each cluster has been performed, as well as a literature review regarding putative identical biosynthetic gene clusters.
2.7.2 Internet resources
EMBL (European Molecular Biology Laboratory, Germany): www.ebi.ac.uk/. BLAST: www.ncbi.nlm.nih.gov/BLAST.
NCBI genome database: www.ncbi.nlm.nih.gov/genome/browse.
Streptomyces genome project: http://streptomyces.org.uk/.
3.1
S. natalensis
ATCC 27448 genome mining
The S. natalensis ATCC 27448 genome has been recently sequenced (Mendes et al., unpublished results). The draft genome is distributed among 40 scaffolds and is estimated to have a total size of 8 653 788 bp, a G+C content of 70.63% and an estimated total of 8 318 protein-coding genes. The S. natalensis genome was submitted to a preliminary genome mining analysis using antiSMASH (http://antismash.secondarymetabolites.org/) – a software especially developed to identify and delimit secondary metabolites biosynthetic gene cluster (for more detailed description see section 1.3).
The antiSMASH analysis retrieved a total of 29 predicted biosynthetic gene clusters putatively involved in the production of secondary metabolites (a.k.a. specialized metabolites), including 8 terpenes, 3 bacteriocin-like toxins, 3 siderophores, 3 polyketides, 2 nonribosomal peptides, 1 oligossacharide, 1 phosphonate, 1 polyketide-siderophore-terpene hybrid and 1 polyketide-terpene hybrid (Table 2). Based on PFAM domain probabilities 33 additional putative biosynthetic gene clusters were identified with no assigned category. Moreover, the majority of the identified secondary metabolite biosynthetic gene clusters harboured at least one putative cluster situated regulator (CSR). Finally it should be mentioned that the 29 biosynthetic gene clusters may turn out to be 34 due to the classified hybrid ones (S1C2, S3C9 and S3C14). antiSMASH defines gene clusters by locating clusters of signature gene pHMM hits, spaced within <10 kb mutual distance, including flanking accessory genes. Then, gene clusters are extended by 5, 10 or 20 kb on each side of the last signature gene pHMM hit (Medema et al., 2011). Consequently, gene clusters that are closely located may be merged and wrongly assigned as a hybrid one.
Due to time constraints, this work has focused on six clusters (S1C1, S1C2, S1C3, S1C4, S1C5 and S5C20). The selection process was based on (1) the chemical family of the predicted metabolite, to favour chemical diversity, (2) low genetic synteny with homologous gene clusters, to increase the probabilities of finding a new compound and (3) the existence of positive CSRs. Biosynthetic gene clusters were named according to the scaffold they belong sequentially (e.g. S3C12 is the 12th found cluster and is located in scaffold no 3). A detailed in silico analysis of the selected clusters was performed based on the antiSMASH results.
Individual BLASTp results for each gene of the selected clusters are presented in Tables A1-6 (Appendix I). Table A7 summarizes the CSR found and their predicted role (i.e. if activators or repressors) based on previous studies. It should still be noted that all the proposed functions were foreseen according to (1) the position of the homologous hits presented by NCBI, (2) the
number of similar obtained homologies and (3) the core domains detected by the alignment search tool.
Table 2 – S. natalensis ATCC 27448 biosynthetic gene clusters predicted by antiSMASH. Gene loci was identified with
the SNA prefix in accordance with the genome sequencing data.
Gene
cluster Type No Scaffold: Location (bp) SNA loci
S1C1 Terpene S1: 77463-100227 SNA00083-SNA00105 S1C2 PKS-II-terpene S1: 370687-434883 SNA00375-SNA00437 S1C3 PKS-III S1: 835946-878512 SNA00822-SNA00859 S1C4 Bacteriocin S1: 1186177-1211143 SNA01156-SNA01179 S1C5 NRPS S1: 1222359- 1330255 SNA01188-SNA01259 S1C6 Siderophore S1: 1490934-1508777 SNA01393-SNA01404 S2C7 Phosphonate S2: 524293-566518 SNA03120-SNA03161 S3C8 Other S3: 1795-46346 SNA03856-SNA03898 S3C9 Terpene-Lantipeptide-NRPS S3: 278972-346052 SNA04152-SNA04201 S3C10 Terpene S3: 390167-411216 SNA04263-SNA04289 S3C11 Terpene S3: 492921-516009 SNA04392-SNA04413 S3C12 Oligosaccharide S3: 519254-572380 SNA04417-SNA04462 S3C13 PKS-I S3: 587907-651587 SNA04479-SNA04537 S3C14 PKS-I-Siderophore-Terpene S3: 652887-799820 SNA04539-SNA04613 S3C15 Lantipeptide S3 985892-1012524 SNA04789-SNA04809 S3C16 Bacteriocin S3: 1126391-1138879 SNA04917-SNA04925 S4C17 Terpene S4: 336772-360465 SNA05344-SNA05364 S4C18 Bacteriocin S4: 574834-586218 SNA05566-SNA05578 S5C19 Terpene S5: 66559-91614 SNA05856-SNA05877 S5C20 PKS-I S5: 460920-515784 SNA06231-SNA06280 S6C21 NRPS S6: 266965-367965 SNA06673-SNA06733 S6C22 Siderophore S6: 491157-507468 SNA06857-SNA06869 S7C23 Other S7: 100-42269 SNA06906-SNA06955 S7C24 Terpene S7: 435422-456849 SNA07423-SNA07440 S8C25 Ectoine S8: 393588-404835 SNA07875-SNA07887 S10C26 Terpene S10: 267-15488 SNA01458-SNA01477 S10C27 Siderophore S10: 301253-310365 SNA01750-SNA01755 S13C28 Terpene S13: 20834-44430 SNA02207-SNA02226 S16C29 Butyrolactone S16: 433-13110 SNA02426-SNA02441
Finally, the transcription of one selected structural gene together with CSRs encoding genes from the six clusters was analysed by RT-PCR nature. The large amount of structural genes, together with the short period of time available for this project, justifies the performed selection. For gene expression studies RNA samples were collected at early experimental phase where secondary metabolism is active. Two biological replicates were analysed.
3.1.1 S1C1 – a putative terpene biosynthetic gene cluster 3.1.1.1 In silico analysis
Cluster S1C1 spanning from 682408-700166 in scaffold 1 (SNA00083-SNA00105) was classified by antiSMASH as responsible for the production of a terpene (Fig. 4). Terpenes (a.k.a.
isoprenoids) are a ubiquitous group of molecules biosynthetically derived from units of isoprene precursor units (C5H8). Currently, over 55 000 of terpenes have been isolated and are
present in our daily life, such as components of fragrances, hormones and medicines, among other products (Nicolaou & Montagnon, 2008; Chen & Baran, 2009).
In Streptomyces, terpenes biosynthesis can occur via two independent non-homologous metabolic pathways: the methylerythritol phosphate (MEP) pathway and the mevalonate (MVA) pathway (Dairi, 2005). Both pathways converge in the formation of isopentenyl pyrophosphate (IPP), from the condensation of a pyruvate and a glyceraldehyde-3-phosphate (G3P) (MEP pathway) or from the condensation of acetyl-CoA and acetoacetyl-CoA (MVA pathway) (Fig. 5).
Figure 4 – Schematic representation of cluster S1C1. Brown arrows represent putative structural genes, which might
be involved in the biosynthesis of the end terpene (SNA00094, methyltransferase; SNA00095, terpene synthase metal-binding domain-containing protein; SNA00100, AMP-dependent synthase SNA00101, phosphopantetheine-binding protein; SNA00102, decarboxylase). Green arrows represent the putative positive CSRs encoding genes: SNA00088 (LysR-family); SNA00096 (Cyclic AMP (cAMP) receptor protein). White arrows represent other genes.
Once formed, either by MVA or MEP pathways, IPP is rearranged by isopentenyl diphosphate:dimethylallyl diphosphate isomerase (IPP isomerase), to form dimethylallyl diphosphate (DMAPP) (Dairi, 2005).
The condensation of DMAPP with one, two or three IPP units gives rise to geranyl diphosphate (GPP), farnesyl diphosphate (FPP) and geranylgeranyl diphosphate (GGPP) that once cyclized by terpene synthases, constitute the parent skeletons of monoterpenes (C10), sesquiterpenes (C15) and diterpenes (C20). Two farnesyl units joined head-to-head by squalene synthase (SQS) lead to the formation of squalene, the precursor of triterpenes (C30). Tetraterpenes (C40) are formed from two geranylgeranyl units joined head-to-head by phytoene synthase (PSY), originating phytoene as an intermediate. Terpenes structural backbones can be further modified by hydroxylation, methylation and glycosylation, among others. It should be noted that terpene synthases are also referred as terpene cyclases (Greenhagen and Chappell, 2001).
BLASTp and protein domain analysis of SNA00095 identified a terpene synthase metal-binding domain-containing protein between amino acid 60 and 367 (PFAM03936) with 82% identity (306 aa/373 aa) with the one from Streptomyces violaceusniger Tu 4113 (Table A1) which corroborates the antiSMASH prediction. Furthermore, SNA00095 also shares 79%
identity (296 aa/374 aa) with a 2-methylisoborneol (MIB) synthase from Streptomyces sp. NRRL S-237. This enzyme is involved in the formation of the monoterpene MIB (Fig. 6A) – an organic chemical with a strong odour, which is one of the chemicals with major influence on the quality of drinking water (Newcombe and Cook, 2002). MIB biosynthesis is associated to clusters that include, besides the monoterpene cyclase, a cyclic nucleotide-binding protein and a methyltransferase, which are both also present in S1C1: SNA00096 [73% identity (52 aa/71 aa) with Streptomyces sp. NRRL S-237] and SNA00094 [88% identity (261 aa/ 265 aa) with
Streptomyces sp. NRRL S-237], respectively (Fig. 6B). The results suggested that S1C1 may be
responsible for the production of a MIB analogue or structurally related compound.
Figure 5 – Schematic representation of terpenes biosynthesis. Once formed either from MEP or MVA pathways, IPP
is converted to its allylic isomer DMAPP, by IPPI. The condensation of one, two or three molecules of IPP to DMAPP, by GPPS, FPPS or GGPP, respectively, lead to the formation of GPP, FPP or GGPP. In turn, two molecules of FPP, by SQS, or GGPP, by PSY give rise up to squalene or phytoene respectively. The latter compounds, as well as GPP, FPP and GGPP, once cyclised by terpene synthases give rise to monoterpenes, sesquiterpenes or diterpenes, respectively. (G3P, glyceraldehyde-3-phosphate; MEP, 2-C-methyl-D-erythritol 4-phosphate; MVA, mevalonate; IPP, isopentenyl diphosphate; IPPI, isopentenyl diphosphate isomerase; DMAPP, dimethylallyl diphosphate; GPPS, geranyl diphosphate synthase; GPP, geranyl diphosphate; FPPS, farnesyl diphosphate synthase; FPP, farnesyl diphosphate; GGPPS, geranylgeranyl diphosphate synthase; GGPP, geranylgeranyl diphosphate; SQS, squalene synthase; PSY, phytoene synthase) [Adapted from Schmidt et al., 2010].
![Figure 1 – Logistic model reflecting the trend of antimicrobial compounds discoveries per year, from 1947 to 1997 [Adapted from Watve, et al., 2001]](https://thumb-eu.123doks.com/thumbv2/123dok_br/15787460.1077701/20.892.204.692.106.406/figure-logistic-reflecting-antimicrobial-compounds-discoveries-adapted-watve.webp)