Revista de Economia Polítca
All the contents of this journal, except where otherwise noted, is licensed under a
Creatve Commons Attributon License
. Fonte:
http://www.scielo.br/scielo.phpp
script=sci_arttexttpid==S0101-31572013000100006tlng=enttlng=en
. Acesso em: 26 dez. 2019.
REFERÊNCIA
BAUMANN, Renato. Brazilian, Chinese, and Indian exports: is the regional market really a source of
learningp. Revista de Economia Polítca, =São Paulo, v. 33, n. 1, p. 102-119, jan./mar. 2013. DOI:
http://dx.doi.org/10.1590/=S0101-31572013000100006. Disponível em:
http://www.scielo.br/scielo.phppscript=sci_arttexttpid==S0101-31572013000100006tlng=entnrm=iso. Acesso em: 26 dez. 2019.
Brazilian, chinese, and indian
exports: is the regional
market really a source of learning?
rEnato BauMann*
In some Latin American countries the exporting activity starts at a regional level, with producers only later venturing into more competitive markets. The implicit risk is that a country might never progress from the regional stage to a more global market. This article compares the experiences of Brazil, China and India. It is shown that Brazil relied on the regional market far more intensely than these Asian coun-tries. There were clear gains accruing to China and India for having exploited more sophisticated markets from the very beginning of their export drive.
Keywords: international trade; regional trade; export competitiveness; manufac-tured exports; export survival.
JEL Classification: F13; F14; F15; F43.
INTRODUCTION
Some Latin American countries are typical examples of a ‘learning process’: the exporting activity (mainly in manufactures) starts at a regional level, with pro-ducers in one country exploiting the (less sophisticated) neighboring markets (often under preferential trade agreements) and later venture into more competitive mar-kets, with stricter consumer protection norms, higher requirements with regard to quality and delivery time, among other characteristics.
The implicit risk in this model is, of course, that an exporting country might never progress from the first, regional stage, to the second, more globalized stan-Brazilian Journal of Political Economy, vol . 33, nº 1 (130), pp . 102-119, January-March/2013
* Technical staff of IPEA and professor at Universidade de Brasília. This work could not be done without the efficient support by Rubem Ceratti, from IPEA, in processing primary data. Opinions herein are my own and do not necessarily correspond to the official position of these two institutions. E-mail: renato. baumann@ipea.gov.br.
dard of trade. It might even lose its potential competitiveness over time and stop the exports of some more sophisticated products. Brazil seems to be a clear ex-ample both of the systematic trade relation at the regional level and of the difficul-ties in acquiring competitiveness to venture into more sophisticated markets.
At the same time, the aggregate indicators for China show not only an un-matched pace of export growth in general, with high share of manufactured prod-ucts. Since the beginning of its export drive, in the early 1990s, China’s main partners have systematically been economies with much higher per capita income than its own. Since 1991 the main destinations for Chinese exports remain the US, Hong Kong, Japan, South Korea and Germany. This has not changed over time.
India presents apparently a third perspective, with less dynamic performance than the Chinese, but also a focus on developed markets.
If one considers as developed market the sum of the US, the European Union and Japan, the Brazilian, Chinese and Indian shares have varied as follows. In year 2000 Brazilian products accounted for 1.0% of manufactured imports by the de-veloped markets, Indian manufactures represented 1.1% and the Chinese products 11.6%. In year 2009 these shares were, respectively, 0.9%, 2.0% and 28.2%. Hence,
the share of Brazilian products in the more competitive markets remained rather constant throughout the decade, whereas the exports of the other two countries boomed.
At the same time, the destination of manufactured exports to regional markets was as follows. For Brazil, South America absorbed 30.6% of its manufactured exports in year 2000 and 30.4% in 2009. For India, South Asia absorbed 2.6% in 2000 and only 1.0% in 2009. And for China, East Asia1 absorbed 20.2% in 2000
and only 14.1% in 2009.
This loss of trade opportunities in developed markets has no single cause, and domestic policies do play an important role. But there are also some relative ‘ac-commodation’ in domestic producers exploring regional markets, where they are comparatively more competitive than most neighbors. In so doing they reduce their efforts to foster competitiveness at an international level. Alternatively, aiming at more sophisticated markets from the beginning of the export drive might pay in terms of acquiring skills and developing a network of market channels.
These three realities call for a more detailed, comparative analysis of the com-position of trade flows and the changes in their geographical destination, in order to try and identify policy lessons from the experiences of these BRICs. As recalled by Besedes and Prusa (2004), positive trade theory usually asks questions which address the “who, what, when, and why” of international trade. It hardly poses the question of “how long”: when countries trade, how long does their trade relation-ship last?
This article deals with these questions. To what extent the ‘dependency’ upon
1 According to a ‘ad hoc’ definition, dropping the rich economies of Japan, South Korea and Singapore, as described in the third section of this article.
the regional market is a Latin American characteristic, as indicated by the figures relative to the Brazilian, Chinese and Indian exports? To what extent have these Asian countries started their export efforts directly relying upon the more sophis-ticated markets? Is such difference — if it exists — associated to different degrees in adapting the structure of exports over time?
The article has five sections. Following this Introduction the second section presents a brief survey of the (rather recent) literature on the types of traded goods and the markets of destination for exports, as well as on the duration of the exports of certain types of products. The third section shows the methodological approach adopted here, and the fourth section the main results. The last section presents some final remarks.
THE LOGIC OF THE RELATIONSHIP BETWEEN EXPORTS, LEARNING AND TyPES OF MARKETS
1. the portfolio approach to productive and export diversification
The causality linking economic growth to export composition is more easily dealt with in the theoretical literature than in the mapping of how exports affect output growth. It is conceived (Brenton & Newfarmer, 2007) that rapid and sus-tained economic growth is associated with a fast pace of export growth. Integrating into the global economy can provide new sources of productivity gains through trade, new investment, and access to technology.
At the micro level, the idea that firms learn by exporting follows from a caus-al link between export and productivity, and is associated to three aspects (Wang & Xu, 2009): a) firms improve their relative productivity after they start exporting due to the reallocation of resources and to changes in the markets of destination for exports; firms with higher productivity are capable to cope with the sunk costs associated with exploiting new export markets; b) export demand provides a mul-tiplier effect on investment and output; c) being exposed to a richer source of knowledge and technology exporting firms could take advantage of these inputs, and benefit from the technical expertise of their buyers as well as the design speci-fications of their suppliers.
Product standardization with low technological requirements diverts produc-tion into developing economies where competitive advantages lie in the lower pro-duction cost. There are, hence, positive outcomes stemming from an efficient export activity, with significant impacts over output growth and on the economy’s par-ticipation at the international market. It follows that a pro-active export policy might be part of an efficient growth strategy.
The idea of promoting the diversification of exports has often been proposed as an antidote to sharp, unforeseen variations in foreign exchange revenue. It has actually become an explicit policy target in several developing economies — Latin Americans for sure — for quite some time. The argument is double-sided. It refers
both to diversifying the export bill as well as to increasing the number of trade partners.
Rapid export growth is associated with diversification into new products. The process of export diversification is not, however, a linear process. As Balza and Caballero, Ortega and Pineda (2005) suggest, the export basket of a certain coun-try begins to diversify by the increase in its income, until it reaches a point where the diversification stops and specialization takes place. Economies tend to become more diversified until they move into the upper reaches of middle-income status, after which trends towards increased specialization begin to dominate.
This brings about the three related questions of i) fostering exports via the increase in the share of new products in the export bill or selling more of the same goods in non-traditional markets, ii) choosing the markets of destination for ex-ports by considering their geographical proximity or the degree of sophistication of their import requirements and iii) maintaining export lines over time or replac-ing them after some years. These issues are dealt with in the comreplac-ing subsections.
2. Extensive x intensive export growth
According to Brenton and Newfarmer (2007) a change in total exports can be divided into: i) an intensive margin (equal to the increase in the exports of existing products to current markets minus the decrease or extinction in exports of existing products to current markets) and ii) an extensive margin (equal to new exports of existing products to new markets plus new exports of new products to existing markets plus new exports of new products to new markets).
At the beginning of the development process export diversification occurs mostly at the extensive margin, as new export items multiply and are marketed at increasingly large initial scales. Several works have studied whether countries with fast export growth have achieved that good performance because they have inten-sified their exports to traditional markets or alternatively whether they have start-ed to exploit new markets more intensely.
Recent works show, however, that most of the recent export growth in develop-ing countries has been driven predominantly by the intensive rather than the ex-tensive margin of trade (Brenton, Saborowski & Uexkull, 2009).
According to Evenett and Venables, 2002) on average only about 10% of total export growth by developing economies can be accounted for by the introduction of new products. About 60% of the trade growth is accounted for by greater ex-ports to long-standing trading partners of traditional product lines traded, and a third of export growth is in existing product lines to new trading partners. Similar results obtain in the empirical work by Balza, Caballero, Ortega and Pineda, 2008). These changes can be understood by looking at the exporting activity as a process. As Brenton and Newfarmer (2007) recall, firms in developing economies tend to under-invest in discovery because the first movers into export markets fear their initially high returns might be eroded by subsequent new entrants. This results
in under-investment in searching for new export activities. They propose four stag-es for the export procstag-ess of a product, on the linstag-es of the product cycle reasoning. In a first stage (‘discovery’) firms seek out profitable activities abroad and launch a new product into a foreign market. This is followed by a rapid growth phase, when successful firms reinvest and expand into existing and new geograph-ic markets for their exports. A third stage is a ‘maturation’ phase when products face competition, and successful firms aim at maintaining market share by improv-ing quality and productivity. In a fourth (‘declinimprov-ing’) stage firms exploit existimprov-ing products for rent that is invested in other activities.
This reasoning provides a possible line of explanation for the differences in performance among developing economies, with some of them maintaining and eventually improving their market presence whilst others experience a higher rate of ‘product death’.
Cadot, Carrère and Strauss-Khan (2009) obtained some indications of thresh-old levels, by associating the extensive and intensive export growth to levels of per
capita income (according to purchasing-power-parity criterion and in constant 2005
US dollars). They find that for income levels below US$ 22,000 there is diversifica-tion at both the extensive and intensive margins, an indicadiversifica-tion that rich countries close export lines.
Furthermore, because the initial trade in homogenous products requires high-er values than initial trade in diffhigh-erentiated products (export costs make firms to discover the profitability of the export activity only after they have engaged in exporting), they find a low proportion of homogeneous goods in the total number of new export lines, meaning that new export products are essentially low-value differentiated goods traded by low-income countries.
So far the argument has focused on the product composition of the export bill. The choice of markets for the firm’s entry strategy is also varied. As Albornoz, Pardo, Corcos and Ornelas (2010) put it, if a firm faces two different markets it has some possibilities. It can either a) enter both markets simultaneously; b) enter only one market first leaving the decision whether to enter the other market or not to a later date; or c) enter neither market.
This has at least three implications. First, firms differ with respect to their export strategies, hence different composition of the external trade sector might lead to different outcomes. Second, if there are differential trade preferences, say, via regional agreements, there might be different effects in the short and the long runs, affecting entry in third countries. Third, there is likely to be an asymmetry, where bilateral trade liberalization with distant countries increases exports to close countries immediately, while bilateral trade liberalization with close countries in-creases exports to distant countries with a lag.
The latter two conditions seem to be behind what is observed in some Latin American countries: Eaton, Eslava, Kugler and Tybout (2007) find empirical evi-dence of such behavior for Colombian firms. Most exporting firms sell to only one foreign market, with the frequency of firms selling to multiple markets declining with the number of destinations. At the same time, firms selling to only a small
number of markets tend to sell to the most popular ones. Less popular markets are served by firms that export very widely.
These findings lead to a closer discussion of the actual role of neighboring markets for a given country’s export growth and diversification.
3. the learning process — the role of neighboring markets
A good deal of the explanatory reasons for the participation of a firm in a given market has to do with costs. As Brenton, Saborowski e Uexkull (2009) recall, when information on the costs of exporting is known or can be obtained at little cost we are more likely to observe entry on a larger scale and exit after a short period should be less frequent. Firms discover their profitability as exporters only after actually engaging in exporting. Only then can they adjust quantities and de-cide whether to exit and whether to serve new destinations.
According to Martincus and Carballo (2010), information problems tend to be more severe when firms attempt to export to a new country or sell a new prod-uct abroad than when they simply expand their export activities in countries they already export to or increase their sales of already exported products. In order to export to new destinations a firm must learn about the alternative ways and respec-tive costs of shipping its merchandises, the tariffs and non-tariff measures, the technical regulations applied on its goods, consumer preferences, the distribution channels, the marketing strategies of competing firms, among many other aspects. For Albornoz, Pardo, Corcos and Ornelas (2010), since breaking in new mar-kets entails significant costs, firms in small countries often use neighbors’ marmar-kets, less costly to serve than larger markets, as “testing grounds”. A regional trade agreement would tend to stimulate such “export experimentation” by lowering the costs of exporting to the regional partners. As a result, a greater number of domes-tic firms would eventually find it profitable to export also to third countries. This ‘learning process’ might eventually provide a tool for trade creation, stimulating
exports to non-union members.
As a result, evidence shows that firms start exporting by selling small export volumes to neighbor countries. The successful exporters substantially increase their export volumes, and subsequently start exporting to new destinations. And because search costs are higher for differentiated products, the matching of exporters and buyers will tend to be easier for standard and homogeneous products.
This is indirectly confirmed by the results in Brenton, Saborowski and Uexkull (2009), who find that the exporting experience is product- and region-specific. This appears to matter most for low-income economies. Furthermore, factors determin-ing search costs as well as cultural and geographic ties between traddetermin-ing partners matter more for differentiated than for homogeneous products.
For Evenett and Venables (2002) to the extent that poorer and smaller coun-tries export fewer product lines, the principal mechanism through which these economies learn about potential export markets is through their sales to existing
overseas markets. The probability of a firm exporting to a given foreign economy is determined in part by where it has exported to in the past.
As Eaton, Eslava, Kugler and Tybout (2007) have found for Colombian firms, as exporters add or drop markets, they appear to follow certain geographic patterns. Neighboring markets appear to act as stepping stones for Latin American markets. Once firms have successfully penetrated both neighboring and other Latin American destinations, they are more likely to reach larger OECD markets, but not vice versa.
A significant branch of the literature on exports by developing economies stresses yet another major characteristic, namely the beginning and sudden end of exports of some products or for some markets. This is the object of the next subsec-tion.
4. Export survival
Conventional trade theory explains the composition of trade flows based on several factors, ranging from comparative advantages in factor endowment to the existence of economies of scale, product cycle or the diversification of the spectrum of goods actually traded.
One implicit assumption in the theory is, however, that once initiated a given trade flow will last forever. yet evidence shows that the rate of ‘survival’ might be rather limited, and even more so for the exports by developing economies.
The costs involved in the export activity explain a good deal of this outcome. If firms have imperfect information about the fixed costs of exporting a product to a particular market or there is some uncertainty about the value of these costs, then those firms with relatively low productivity may find that they are unable to survive.
As Brenton, Saborowski and Uexkull (2009) stress, informational costs decline as exporting experience is accumulated and the exporter becomes better informed about the characteristics of the market. The probability that an export flow will disappear falls the longer is the duration of the flow.
According to evidence, countries at higher stages of development are more likely to see their export flows survive for longer periods of time. Besedes and Blyde (2010) find that the hazard increases with the distance between partners, the effi-ciency of transportation systems, and with the price- and income-elasticity of im-port demand of the goods traded. Partners that are large in size, share a common border or language and have a free trade agreement tend to exhibit lower hazard rates. A depreciated exchange rate also increases the odds of export survival. And exporters in countries with more developed financial systems and with institutions that support contract enforceability tend to maintain their export relationships longer.
These are the departure points for the present study, aiming at a comparison of these dimensions in the experiences of Brazil, China and India with exports of manufactures. The next section presents the methodology adopted.
METHODOLOGICAL ASPECTS
Previous sections have shown that there are differences in the various experi-ences with exporting. A country’s export performance can be related to the increase in its sales of the same products to traditional markets or to new markets, as dif-ferent from increasing sales of new products. There are also differences between the exports of homogeneous or differentiated products. Furthermore, there are differences between the factors that help consolidate exports to a neighboring coun-try in comparison with trade with more selective and competitive markets. Last but not least, once initiated it is not assured that a given trade flow will last forever.
The present analysis emphasizes the results obtained for manufactured goods (defined as SITC chapters 5 to 8). It is expected that the trajectories of these three countries are reasonably different, insofar as the composition of the export bill and markets of destination for their exports are concerned.
China has — since the beginning of its export drive — exploited the access to developed economies and only recently started to penetrate the markets of less developed economies. The following Figure illustrates the point.
China: Share of developing countries in total exports
0.0% 2.0% 4.0% 6.0% 8.0% 10.0% 12.0% 1990 1992 1994 1996 1998 2000 2002 2004 2006 2008
Brazil has, differently, relied upon the regional market for its exports of man-ufactures — by and large stimulated by the preferences stemming from trade agree-ments — but could hardly expand its sales of those products towards more sophis-ticated markets.
The Indian trajectory is less easy to define, but it has also aimed more in-tensely at developed markets than on neighboring countries, in parallel to its intense participation in the international market of export services, by and large concen-trated in industrial countries.
The present analysis relies on the literature that tries to identify new export products and the survival of export flows, as briefly surveyed in previous sections.
The Chinese and Indian export drive became more significant in the last decade. The Brazilian experience with market and product diversification dates back to the
1970s and was quite intense in the 1980s. The choice of the period for analysis has to take that into consideration, so it is based on the average figures for 1983-1985, 1993-1995 and 2007-2009.
The analysis is done at the 5-digit product classification. This condition, cou-pled to the definition of the period of analysis, impose a limitation for the use of data to SITC Rev.2, since data relative to Rev.3, with several new products, are available only since the mid-1990s. Focus is centered on the exports of manufac-tures (5-digit products classified under SITC chapters 5 to 8) in comparison to total trade.
The markets to be considered in the analysis are classified in accordance to two dimensions: geographic proximity and the level of per capita income. The geographical dimension is not immediate and its definition involves a good deal of arbitrariness. The three countries belong to two geographical regions, namely Asia and Latin America. For Brazil it is easy to identify its neighborhood, if this set comprises the economies from Mexico to Argentina. None of the countries in this area can be considered as developed, according to the criterion adopted here (see below).
The Chinese and Indian cases are less trivial. There are marked differences in the two sub-regions to which these countries belong, namely East Asia and South Asia, both in terms of the degree of economic integration as well as in terms of the economic potential. Also, Asia as a whole comprises some economies that are clearly classified as developed countries, such as Japan, South Korea and Singapore. The quantitative estimates have to take that into consideration.
With these remarks, we define the following sets of countries or markets for the analysis:
a) regional Market: i) For Brazil:
.latin america — Argentina, Paraguay, Uruguay, Bolivia, Chile, Colombia, Ecuador, Peru, Venezuela, Mexico, Costa Rica, El Salvador, Guatemala, Honduras, Nicaragua and Panama
.south america — Argentina, Paraguay, Uruguay, Bolivia, Chile, Colombia, Ecuador, Peru and Venezuela
ii) For china:
.asia — Japan, Hong Kong, Mongolia, South Korea, Taiwan, Indonesia, Malaysia, Philippines, Singapore, Thailand, Vietnam, Bangladesh, India, Pakistan, Sri Lanka, Bhutan and Maldives
.East asia — Japan, Hong Kong, Mongolia, South Korea, Taiwan, Indonesia, Malaysia, Philippines, Singapore, Thailand and Vietnam
.East asia 2 — Hong Kong, Mongolia, Taiwan, Indonesia, Malaysia, Philippines, Thailand and Vietnam
iii) For india:
.asia — China, Japan, Hong Kong, Mongolia, South Korea, Taiwan, Indonesia, Malaysia, Philippines, Singapore, Thailand, Vietnam, Bangladesh, Pakistan, Sri Lanka, Bhutan and Maldives
.asia 2 — Hong Kong, Mongolia, South Korea, Taiwan, Indonesia, Malaysia, Philippines, Thailand, Vietnam, Bangladesh, Pakistan, Sri Lanka, Bhutan and Maldives
.south asia — Bangladesh, Pakistan, Sri Lanka, Bhutan and Maldives
B) rest of the World:
i) For Brazil: USA, European Union (25), China and Japan ii) For china: USA and European Union (25)
iii) For india: USA and European Union (25) c) set of Developing countries:
For each one of the three countries considered the set of countries (among those indicated above) with per capita income (PPP) worth less than US$ 12 thou-sand in constant value, on average, in 2000-20092.
There is no point in taking into consideration every bilateral trade flow into the analysis. It is therefore necessary to define a threshold for export values. We adopt as a bottom line those products corresponding to at least 0.1% of the aver-age export value (in each case) in 1990-1999.
The analysis is based on the pioneering work of Evenett and Venables (2002), as shown in the Appendix. The basic rationale is to identify the products that were exported by a given economy in a specific period and compare the composition of the export bill with that in another, subsequent period. In the present exercise, we consider three points in time3: the average export value for each product in
1983--1985, the average value in 1993-1995 and the average value in 2007-2009. The analysis focuses on the comparison of the export composition between the first and the second periods, and between the second and the third periods.
The methodology emphasizes the existence of four types of products:
a) ‘continued’ products — items exported in each pair of periods, for instance in both 1983-1985 and 1993-1995
b) ‘dead’ products — items exported in one period but not in the subsequent period; for instance, in 1993-1995 but not in 2007-2009
2 Notice that this set of countries differs from the concept of regional partners, since it comprises all countries with per capita income below the threshold in both Asia and Latin America.
c) ‘new’ products — items not exported in one period but exported in the subsequent period; for instance, items not exported in 1983-85 but actu-ally exported in 1993-1995
d) ‘no exports’ — items listed in the product classification but not exported by the country considered for analysis in any period
MAIN RESULTS
The databank used for the present exercise, UN/COMTRADE, brings system-atic information for Chinese trade at the 5-digit level starting from the early 1990s. As previously stated, however, it is necessary to take into account the previous decade, in order to identify the export promotion effort to foster Brazilian exports. As a consequence, it is only in the comparison between 1993-1995 and 2007-2009
that we have the characteristics for all three countries.
Table 1: Changes in manufactured exports in the two periods by types of products (number of items)
1983-1985 / 1993-1995
Continued Dead New No exports
Brazil 886 57 157 37
China - - -
-India 931 59 121 26
1993-1995 / 2007-2009
Continued Dead New No exports
Brazil 1011 32 24 70
China 1040 42 2 53
India 1048 4 30 55
In accordance with the literature, most of the manufactured exports of the three countries in both periods are ‘Continued Products’, and this number has in-creased between the two periods. The number of ‘Dead Products’ was much small-er in the second than in the first psmall-eriod, suggesting that the three economies have achieved a certain stability of the composition of their exports after some point. It is worrying that there has also been a sharp reduction — for Brazil and India — in the number of ‘New Products’.
The last column of Table 1 shows that there has actually been an increase in the number of products that are non-traded by these countries, reinforcing the perception of an increasing concentration of the export bill in the same products.
These results are suggestive of the export bill following a peculiar trajectory: there is an increase in the number of new products up to a certain point; from then on this number falls, with the export bill becoming centered on traditional items,
with a stable set of exported products and limited addition of new items, which is strictly in line with the literature surveyed in the second section. The following chart illustrates the point.
Net addition of new exported products
time
A more relevant dimension than number of items is the actual contribution of these types of products to the export performance in value terms. Table 2 shows the contribution of each of these types of products to the overall growth of exports for each of the three countries.
Table 2: Decomposition by products — manufactures 1983-1985 / 1993-1995
Continued Dead New
Brazil 88,02% -1,18% 13,16%
China - -
-India 97,48% -0,14% 2,65%
1993-1995 / 2007-2009
Continued Dead New
Brazil 100,09% -0,13% 0,05%
China 100,76% -0,78% 0,02%
India 99,00% -0,06% 1,07%
In the first period most of the growth in manufactured exports was due to ‘Continued Products’, as expected, with a contribution ranging between 88% and 97%. In the second period for the three countries the contribution of ‘Continued Products’ explains totally the growth in manufactured goods exports. The role of ’Dead’ and ’New’ products is marginal. This means that Brazil and India have achieved throughout the 1980s a stable export composition and maintained it throughout the following decade, whereas China, even being a ‘latecomer’ in the international market, did not experience significant changes in its export bill be-tween 1993-1995 and 2007-2009.
It remains to evaluate the actual contribution of the markets for the growth of exports by each of the three countries. This is shown in Table 3.
Over 70% of manufactured export growth in Brazil and India between 1983-1985 and 1993-1995 was achieved by exporting to traditional (‘Continued’) mar-kets. Brazil has been quite active insofar as the geographical distribution of exports is concerned: ‘New markets’ contributed with almost 54% of total export growth and the withdrawal from some markets corresponded to about 24% of total export growth. Figures for India are much lower.
Between 1993-1995 and 2007-2009 the number of ’Dead markets’ is rather small for the three countries (although much higher for Brazil), and there is, once again, clear predominance of traditional markets.
Table 3: Decomposition by markets — manufactures 1983-1985 / 1993-1995
Continued Dead New
Brazil 70,19% -23,92% 53,73%
China - -
-India 73,84% -9,53% 35,68%
1993-1995 / 2007-2009
Continued Dead New
Brazil 80,01% -10,89% 30,88%
China 89,32% -1,00% 11,68%
India 76,56% -2,00% 25,44%
The period between 1993-1995 and 2007-2009 presents indications of a far more stable dependency upon traditional markets. The contribution of traditional markets is higher, at the same time that the contributions of ‘Dead markets’ and‘ New markets’ are much lower than in the first period, for Brazil and India.
It remains to evaluate the relation between types of products and each se-lected market. This is done in two steps. First, we estimate the composition, by types of products, of the exports to each market. Next we evaluate the actual contribu-tion of each market.
Table 4: Decomposition by product — manufactures
Brazil
Market 1983-1985 / 1993-1995 1993-1995 / 2007-2009 C1(Xi) D1(Xi) N1(Xi) C2(Xi) D2(Xi) N2(Xi) Latin America 37.46% -0.22% 4.34% 33.75% -0.06% 0.04% South America 34.10% -0.19% 4.14% 31.77% -0.06% 0.14% China+Japan -0.03% -0.69% 4.12% 3.49% -0.55% 0.57% USA 14.94% -1.11% 2.86% 14.16% -0.35% 0.23% European Union 13.87% -0.88% 5.29% 25.22% -0.33% 0.66% Developing countries 35.88% -0.19% 4.61% 37.65% -0.04% 0.02%
According to Table 4, almost 38% of the growth of manufactured exports between 1983-1985 and 1993-1995 were due to traditional exports to Latin America, (34% to South America only). The set of developing economies absorbed 36% of the increase in manufactured exports between these two moments.
In the same period the contribution of ‘Continued products’ was much higher than the other types of products. The other remarkable information on Table 4 is that the contribution of ‘Continued’ products did not change as significantly be-tween the two periods. The main difference is to be found in the contribution of manufactured exports to China and Japan. Latin America still accounted for over a third of the increase in manufactured exports.
What Table 4 indicates is that the regional market plays an important role for the dynamism of Brazilian manufactured exports. yet there has been little change in the composition of the export bill.
It remains to compare these results with those relative to the Indian and Chinese exports.
As different from Brazil the increase in Indian manufactured exports between 1983-1985 and 1993-1995 (Table 5) is far less dependent upon the regional market: there are significant contributions of ‘Continued’ products exported to the US, the European Union and Asia1, all of them comprising rather sophisticated and more competitive markets. At the same time the contribution of developing countries is almost one-quarter of the one obtained for Brazilian total exports. The contribution of ‘Asia 2’ is far less important than the corresponding figures for Brazilian exports to the regional market, and the contribution of Indian exports to South Asia is quite low.
Other characteristics are: a) the same geographical pattern remained between 1993-1995 and 2007-2009; b) there is a high contribution of the US and the European markets, as well as the developed Asian economies (Asia 1); c) the con-tribution of ‘Dead’ products is marginal in both periods and d) the concon-tribution of ‘New’ products is much smaller than in Brazil in the first period and as low as in
Table 5: Decomposition by product — manufactures
India
Market 1983-1985 / 1993-1995 1993-1995 / 2007-2009 C1(Xi) D1(Xi) N1(Xi) C2(Xi) D2(Xi) N2(Xi) USA 19.02% -0.01% 0.84% 14.75% -0.01% 0.35% European Union 25.60% -0.04% 2.21% 22.93% -0.02% 0.65% Asia 1 26.97% -0.02% 2.71% 20.69% -0.00% 0.54% Asia 2 17.48% -0.03% 1.91% 14.58% -0.00% 0.68% South Asia 3.47% -0.02% 0.53% 2.42% -0.00% 0.55% Developing countries 7.80% -0.03% 1.69% 10.41% -0.00% 0.73%
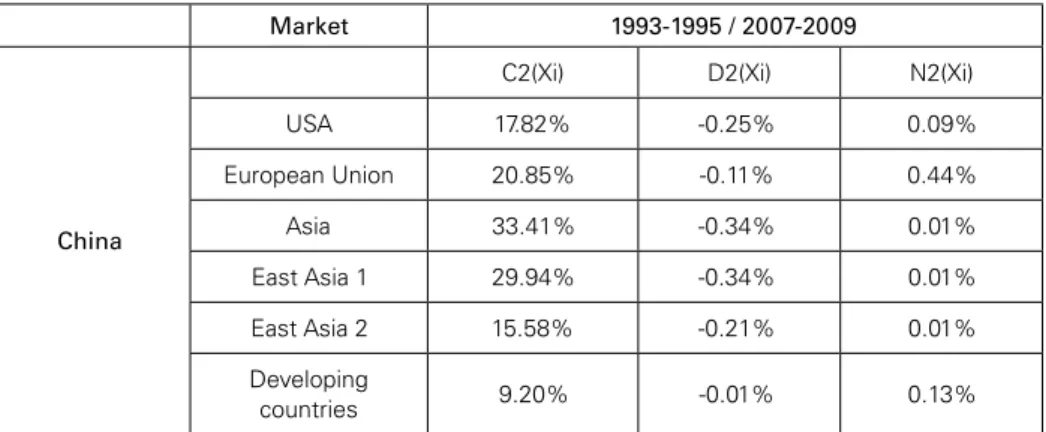
Table 6 confirms the predominance of ‘Continued products’ as the engine of Chinese export growth in manufactures; the contribution of ‘Dead‘ and ‘New’ prod-ucts is quite marginal in all cases. Most of the increases in Chinese export growth between 1993-1995 and 2007-2009 were ‘Continued’ products destined to rich markets. Once the wealthier economies of Asia are dropped, as in East Asia 2, the contribution to export growth by regional markets and developing countries is much smaller.
Table 6: Decomposition by products — manufactures
Market 1993-1995 / 2007-2009
China
C2(Xi) D2(Xi) N2(Xi)
USA 17.82% -0.25% 0.09% European Union 20.85% -0.11% 0.44% Asia 33.41% -0.34% 0.01% East Asia 1 29.94% -0.34% 0.01% East Asia 2 15.58% -0.21% 0.01% Developing countries 9.20% -0.01% 0.13%
The following, last step is to estimate the contribution of each market to the growth of exports by these three countries.
Once again, there are indications that most of the contribution to the increase in Brazilian manufactured exports (Table 7) comes from the regional market. The contribution of ‘New Markets’ to export growth was reduced in the trade with Latin America between the two periods. This is a possible indication of a ‘accom-modation’ of the structure of the export bill, stemming from the intense regional trade.
Table 7: Decomposition by markets — manufactures Brazil Market 1983-1985 / 1993-1995 1993-1995 / 2007-2009 C1(Xj) D1(Xj) N1(Xj) C2(Xj) D2(Xj) N2(Xj) Latin America 32.84% -1.05% 9.79% 31.49% -0.86% 3.10% South America 30.72% -0.75% 8.08% 30.76% -0.61% 1.70% China+Japan 0.12% -1.02% 4.30% 3.41% -0.83% 0.94% USA 14.94% -1.11% 2.86% 14.16% -0.35% 0.23% European Union 7.69% -4.28% 14.87% 16.25% -1.60% 10.90% Developing countries 31.01% -1.48% 10.77% 34.85% -0.95% 3.73%
Indian manufactures were highly dependent upon the US, EU and rich Asian markets between 1983-1985 and 1993-1995 (Table 8). Between 1993-1995 and 2007-2009 there was a small reduction in the contributions of the US market, of the Asian market in its three dimensions, as well as of the European Union, only partially compensated by an increase in the contribution of the set of de-veloping countries. As before, the contribution of trade within South Asia re-mained marginal.
Table 8: Decomposition by market — manufactures
India Market 1983-1985 / 1993-1995 1993-1995 / 2007-2009 C1(Xj) D1(Xj) N1(Xj) C2(Xj) D2(Xj) N2(Xj) USA 19,02% -0,01% 0,84% 14,75% -0,01% 0,35% European Union 14,59% -0,35% 13,53% 15,70% -0,09% 7,95% Asia 1 22,33% -0,21% 7,54% 15,49% -0,17% 5,91% Asia 2 14,51% -0,12% 4,97% 11,90% -0,13% 3,49% South Asia 3,16% -0,03% 0,85% 2,00% -0,03% 1,00% Developing countries 5,52% -0,12% 4,06% 6,58% -0,10% 4,66%
The increase of Chinese manufactured exports between 1993-1995 and 2007--2009 relied mostly upon the US market, the European market as well as the mar-kets of the rich Asian economies, as shown on Table 9. The regional market — as indicated by Asia 2 — played a minor role and the set of developing countries were even less important. The contribution of ‘New markets’ was extremely low.
Table 9: Decomposition by markets — manufactures Market 1993-1995 / 2007-2009 China C2(Xj) D2(Xj) N2(Xj) USA 17,82% -0,25% 0,09% European Union 17,57% -0,12% 3,72% Asia 32,12% -0,35% 1,32% East Asia 1 29,32% -0,34% 0,64% East Asia 2 15,20% -0,22% 0,39% Developing countries 8,28% -0,01% 1,06% FINAL REMARKS
This work was motivated by the perception that Brazilian manufactured ex-ports have remained by and large concentrated on the regional market, for quite some time now, and have not been able to ‘graduate’ and explore the markets of developed economies. At the same time, two ‘latecomers’ in the export activity, China and India, show much better indicators of success in this regard.
To deal with this issue this paper relies upon the recent literature on the inten-sive growth of exports by developing countries, as well as on the ‘survival’ of export flows.
The results obtained are quite in line with the findings (Evenett & Venables, (2002) that on average only about one-tenth of total export growth can be ac-counted for by the introduction of new products. The three countries rely intense-ly on the same sets of products for their export growth. This is particularintense-ly remark-able in the Chinese case, where not only the percentage of ‘Continued products’ is higher than in the other two countries, but the incidence of ‘Dead products’ and — even more significant — of ‘New’ products is marginal. This proves that a bril-liant export performance can be obtained even with a relatively stable, but diversi-fied, export bill.
This leads to the role of the markets of destination for exports. Evidence in the literature surveyed here leaves little doubt that firms in small countries use neigh-bors’ markets — less costly to serve than larger markets — as ‘testing grounds’ to venture into larger markets. This is clearly the case of the Brazilian economy, but not the Indian or the Chinese experience. The latter two have relied upon developed markets from the very beginning of their export drive.
Brazil, with a much longer experience with export promotion has remained dependent upon the regional market and has not apparently surpassed this stage, with essentially the same products being sold to the same regional markets. Furthermore, there are differences over time, with a more dynamic process of di-versification of Brazilian export markets between 1983-1985 and 1993-1995 than between 1993-1995 and 2007-2009. The indicators presented here are suggestive of a certain ‘accommodation’, mainly in recent years.
The reasons for this outcome are varied, and comprise domestic distortions, international price signals benefitting non-processed products, trade barriers to more elaborated products, increasing competition by other countries and a number of others. There is no point in blaming one or two guilty elements.
Also, this is not to blame the emphasis in the regional market as an important initial step in the ‘learning process’ of exporting. The point to stress is that as dif-ferent from China and India, who have relied from the very beginning on being able to compete in developed markets, the Brazilian economy has not been able to move one step further, and remained largely dependent upon the regional market for its exports of manufactures. This has apparently affected its ‘learning process’, by the country having accommodated itself on the basis of its comparative advan-tage in relation to regional partners, hence affecting its chances to reach a degree of competitiveness at a broader scale.
REFERENCES
ALBORNOZ, Facundo; Héctor F. CALVO PARDO; Gregory CORCOS; Emanuel ORNELAS (2010), “Sequential exporting”, Discussion Paper Series No. 8103, Centre for Economic Policy Research,
London, available at www.cepr.org/pubs/dps/DP8103, November
AMITI, Mary; Caroline FREUND (2008), “The anatomy of China’s export growth”, Policy Research Working Paper 4628, The World Bank, May
BALZA, Lenin; María CABALLERO; Leonardo ORTEGA; José PINEDA (2008), “Market diversifica-tion and exports growth in Latin America”, Universidad Central de Venezuela, January, available at www.ecomod.org/files/papers/665.pdf
BESEDES, Tibor; Juan BLyDE (2010), “What drives export survival? An analysis of export duration in Latin America”, January, available at www.editorialexpress.com/cgi-bin/conference/download. cgi?db_name=MWITSpring2010&paper_id=66
BESEDES, Tibor; Thomas J. PRUSA (2004), “Ins, outs, and the duration of trade”, available at www. econ.ku.dk/nguyen/teaching/besedes-prusa-iodt.pdf
BRENTON, Paul; Richard NEWFARMER (2007), “Watching more than the discovery channel: Ex-port cycles and diversification in development”, Policy Research Working Paper 4302, The World Bank, August
BRENTON, Paul; Christian SABOROWSKI; Erik von UEXKULL (2009), “What explains the low survival rate of developing country export flows?”, Policy Research Working Paper 4951, The World Bank, June
CADOT, Olivier; Céline CARRÈRE; Vanessa STRAUSS-KAHN (2009), “Export diversification: What’s behind the hump?” CERDI, Etudes et Documents, E 2009.34, November
EATON, Jonathan; Marcela ESLAVA; Maurice KUGLER; James TyBOUT (2007), “Export dynamics in Colombia: firm-level evidence”, Department of Economics, Wilfrid Laurier University, Water-loo, Ontario, Canada, Working Paper Series, 2007-04 EC
EVENETT, Simon J.; Anthony J. VENABLES (2002), “Export growth by developing countries: market entry and bilateral trade”, mimeo, available at www.nottingham.ac.uk/shared/shared_levents/ conferences/2002_june_everett.pdf
MARTINCUS, Christian Volpe; Jerónimo CARBALLO (2010), “Entering new country and product markets: does export promotion help?”, IDB Working Paper Series No. IDB-WP-203, August –
WANG, Fang; Zhaoyuan XU (2009), “Learning by exporting under international Schumpeterian com-petition: evidence for Chinese firms, available at www.Gredeg.cnrs.fr/Colloques/DIME-IS-GEP-2-1-/Papers/Wang-Xu.pdf