Manuscript ID: 1770 DOI: 10.18462/iir.icr.2019.1770
Parametric study by means of 3D CFD to improve the airflow
pattern and temperature distribution in data center rooms
Diogo G.C.S. MACEDO
(a), Radu GODINA
(a,b), Pedro D. GASPAR
(a,b),
Pedro D. SILVA
(a,b),Miguel T. COVAS
(c)(a) Department of Electromechanical Engineering, University of Beira Interior
Covilhã, 6201-001 Portugal
(b) C-MAST - Centre for Mechanical and Aerospace Science and Technologies, Covilhã, Portugal
Covilhã, 6201-001 Portugal, [email protected]
(c) ALTICE/MEO - Serviços de Comunicações e Multimédia, SA, Quinta Grila DATACENTER
Covilhã, 6200-292, Portugal
ABSTRACT
The processing efficacy and energy efficiency of data centers (DC) is directly related with the cooling performance of the air-conditioning systems. The cooling effectiveness depends on airflow pattern and temperature distribution. This paper presents the parametric study of three-dimensional (3D) computational fluid dynamics (CFD) models to improve these technical characteristics. In this case study the most suitable thermal load, as deemed by the organization, of the heat flow boundary condition is simulated and studied for maximum and minimum airflow. The analysis of the numerical results provides a prediction of the thermal performance, i.e., the lower values and spatial gradients (hot spots) of air temperature and velocity while maintaining the computational processing requirements. These results allow the development of an optimized CFD model for setting up the operational parameters of CRAC systems for DC rooms.
Keywords: Computational Fluid Dynamics, Computer Room Air Conditionings, Data Centers, Air-conditioning Systems, Hot Spots, Energy Efficiency.
1. INTRODUCTION
In the last decades the Data Centers (DCs) have undergone a significant evolution, adopting more efficient techniques and practices, but their energy consumption continues very high. By 2015 this consumption accounted for around 1.3% of world energy consumption (Díaz et al., 2017). Due to the increased need for data storage, there is a trend to build larger DCs, thereby increasing energy consumption, which leads to increased concern about minimizing the environmental impact, reducing energy consumption costs, and optimizing the energy performance (Dayarathna et al., 2016). As expected, power consumption for DC cooling has been increasing over the years, due to the large increasing amount of information technology (IT) systems that DC rooms hold. This is due to the advance of the technology that causes the continuous components miniaturization, which allows the installation of more components in the same space. This requires adequate cooling so that there is no high temperature or humidity gradients or spots, as these factors lead to deficiencies in the operation of electronic equipment (Song et al., 2015). The constant escalation in the recent years of the heat density of IT servers caused a rise of 40% in the energy consumption of data centers’ cooling systems (Nada et al., 2016a). The energy efficiency of DCs is very dependent on their thermal performance. Since the refrigeration system is a relevant energy consumer in these infrastructures, the development of parametric studies that predict the variation of relevant quantities in the airflow and heat transfer processes, depending on the layout, dimensions and operational characteristics of devices and systems, can translate into improvements in the thermal performance of the infrastructure, and simultaneously of energy efficiency. The results can be tested in the next phases of the DC infrastructure, with the prospect of achieving additional gains in reducing energy consumption (Zhang et al., 2018). Computational Fluid Dynamics (CFD) is a set of numerical methods for obtaining an approximate solution to a problem of fluid dynamics and/or heat transfer. The equations that come into play are those of fluid mechanics and heat transfer, solved by numerical methods. The solution is approximate and not exact for several reasons. However, thanks to the development of digital methods and increasingly powerful computers with a large memory capacity, the CFD allows having very
satisfactory solutions. This is more than enough in certain areas of industry where very often a prediction of the order of magnitude of average values is amply sufficient (Wendt, 2009). This topic has been gaining interest and several researchers have been drawing attention to such types of studies (Li and Kandlikar, 2015). Nadjahi et al. (2018) review the thermal management and novel cooling strategies for data center and addresses energy saving procedures/techniques/ technologies. Nada et al. (2016b) simulate the thermal performance of DCs considering different configurations of CRAC units and physical separations of cold and hot aisles. The authors concluded that the performance strongly depends on the racks location. A thermal management system for a small data center incorporating noise reduction is proposed by Zhou et al. (2018) and is verified by experimental testing. The authors argue that his solution avoids the formation of hot spots. Ni et al. (2017) used CFD to model the airflow in a data center with floor air supply to identify the optimal conditions of air distribution that provide the best energy savings. Distinct airflow strategies for data centers are analyzed in Behere (2015) and different approaches for the optimization of the airflow are proposed. A fast-executing hybrid lumped capacitance-CFD model for the simulation of data center transient thermal events is proposed by Erden et al. (2014). The model effectively predicts such events since the results of study were compared with experimental data acquired from a three-rack data-center test cell. However, the abovementioned studies lack complexity since the proposed models are fairly simple and focus on small data centers with a low number of racks. For this reason, such types of studies are simulated in a short period of time and are validated without difficulty. This paper presents the parametric study of three-dimensional computational fluid dynamics model to improve airflow pattern and temperature distribution of a real data center room with substantial dimensions and considering 208 racks. This data center is located in an average European city. In this case study the proper thermal load, as deemed by the organization, of the heat flow boundary condition is simulated and studied for maximum and minimum air flow velocity. ANSYS™ Fluent package is used to simulate the airflow and heat transfer processes in the room. This paper is organized as follows. In section 2 the proposed model and the computational processing requirements are described. The results are shown and analyzed in section 3. Finally, in chapter 4 the concluding remarks are given.
2. MODEL DESCRIPTION
The geometric model was developed taking into account the characteristics of computational processing in order to avoid divergence patterns during the simulations run. Thus, the three-dimensional geometry was simplified in order to avoid a highly complex mesh. A complex mesh requires high computational processing, which leads to an increase of time running each simulation, being necessary every so often to adjust the mesh to the availability of time and processing capacity of the simulating tools. In order to achieve such scenario, the racks are represented as parallelepipeds, and the cables, rails, access doors and fixtures have been concealed to facilitate the construction of the mesh. In the case of illumination, these were concealed not only by the complexity they would generate in the developed mesh, but also because they were disconnected during the operation of the IT room, thus generating no heat.
The continuity, momentum, energy equations and the standard k-ε model equations are based on the equations exposed in Ni et al. (2017) and Hoang et al. (2000). The constants of the standard k-ε model: σk, σε, C1ε, C2ε e Cμ are set to the following values 1, 1.3, 1.44, 1.92 and 0.09, respectively,
as provided by Hoang et al. (2000).
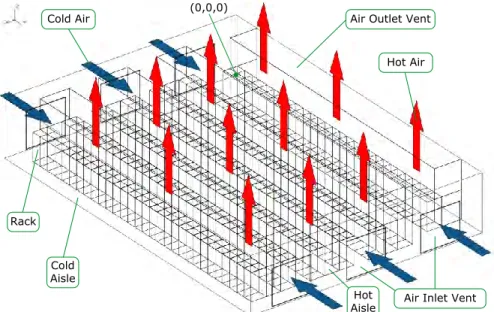
The CFD software used for this simulation was ANSYS™ Fluent. To perform the numerical simulation it was necessary to elaborate a three-dimensional geometry of the IT room with its 208 racks. The number of nodes is 1 183 613, the number of control volumes is 2 341 172, the Aspect Ratio is 1.645 and the skewness is 0.177. These numbers required a high computational power. This geometry was developed in AutoCAD 2017 software and later exported to a compatible format (.sat) with Ansys Software. The 3D geometry developed for the present study can be observed in Fig. 1.
Figure 1: Three-dimensional geometry of the studied data center room
The resulting mesh consists of tetrahedral elements (cold aisles) and hexahedral (hot aisles and racks). This solution was adopted because the mesh would have a high number of control volumes if only the mesh were used with tetrahedral elements. This solution was employed due to the fact that having only tetrahedral elements, albeit the ideal model, it was not possible due to extremely high computational power required for this purpose.
2.1. Boundary Conditions
The boundary conditions defined in the numerical models were based on the data collected in the DC room. To the values collected was also added the value of pressure loss in the racks provided by North (2011) in which 80% perforation causes a pressure loss of 7.5 Pa. It is important to point out that from now on all coordinate values and parameters are presented in a non-dimensional way to simplify the comparison between case studies. The dimensionless quantities of the values to be considered are the value 0 for the minimum value and the value 1 for the maximum value. The maximum height value of the rack is 0.489. It should be noted that in the case of temperature, the maximum value corresponds to a temperature value that exceeds the operating specifications of the racks. That is, it is an air temperature value with the possibility of malfunctioning or damage to the equipment included in the IT rooms, which are intended with uninterrupted operation.
The equations previously mentioned are solved at the fluid zone, that is, it contains the control volumes where these equations are solved. The fluid used in the present study is air, considered to be incompressible, which means that the values of the values presented in Table 1 are constant and the gravitational acceleration was considered as g = 9.81 m.s-2. The fluid zone was considered with
the dimensionless temperature of 7.09×10⁻⁴. A solution converges when all the residuals reach the
stopping criterion, λ = 1×10⁻³ for all variables, except for the energy variable that assumes a stop
criterion of λ = 1×10⁻⁶. The factors concerning relaxation were the ones given by the default settings
of the software.
The iterative process of the various numerical models was defined to be 1500 iterations, since it was concluded that the solution would not reach the stopping criterion. However, the possible convergence was easily achieved by using 1500 iterations since the variables stabilized before this number of iterations.
Table 1. Atmospheric properties if the air
Constants Values Specific mass ρ = 1.21 kg.m-3 Dynamic viscosity µ = 1.82528×10⁻⁵ kg.m-1.s-1 Thermal conductivity k = 0.0256706 W.m-1.K-1 Specific heat Cp = 1006.14 J.kg-1.K-1 Rack
Air Outlet Vent
Air Inlet Vent Cold Air Hot Air Cold Aisle Hot Aisle (0,0,0)
3. SIMULATION RESULTS AND ANALYSIS
In this case study, case study 1, the most suitable thermal load, as considered by the organization, of the heat flow boundary condition is simulated and studied for maximum and minimum air flow velocity. In this case study the changes in boundary conditions are as follows: the typical dimensionless thermal load dissipated by the racks: qadm = 0.340 and the minimum dimensionless air flow velocity: vadm = 0.
In the Figs. 2, 3 and 4 it is possible to observe the predictions of dimensionless temperature field for this case study.
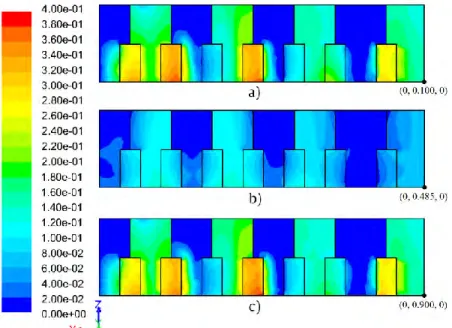
Figure 2: Dimensionless temperature fields in the x-z plane for a) yadm = 0.100, b) yadm = 0.485 and c) yadm = 0.900.
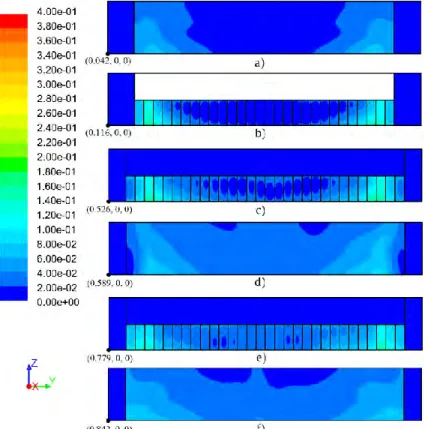
Figure 3: Dimensionless temperature fields in the y-z plane for a) xadm = 0.042, b) xadm = 0.116, c) xadm = 0.526, d) xadm = 0.589, e) xadm = 0.779 and f) xadm = 0.842
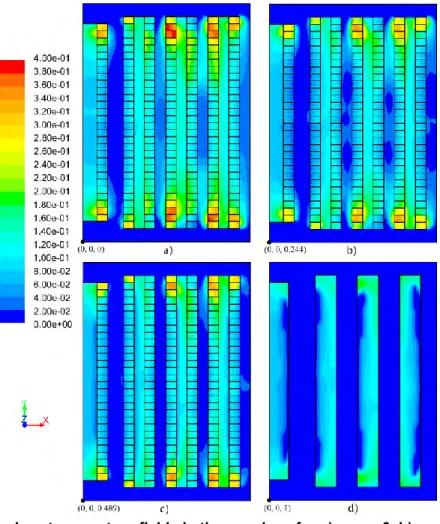
Figure 4: Dimensionless temperature fields in the x-y plane for a) zadm = 0, b) zadm = 0.244, c) zadm = 0.489, d) zadm = 1
By observing Fig. 3 it can be predicted several hots spots at the extremity of the rack lines. This is confirmed also by observing the y and z planes, as depicted by Figs. 2 and 4, respectively. These hot spots are considered to be of values of dimensionless temperature higher than Tadm > 0.350. It
can also be observed in Fig. 4a) that the heat is more intense at the base of the racks due to lower airflow in this zone. This happens because the airflow is more intense in the middle of the air vents and not at the bottom.
In case 2, the changes in boundary conditions are as follows: the typical dimensionless thermal load dissipated by the racks: qadm = 0.340 and the maximum dimensionless airflow velocity: vadm = 1. Figs. 5, 6 and 7 show the predictions of the dimensionless temperature field for this case study.
Figure 5: Dimensionless temperature fields in the x-z plane for a) yadm = 0.100, b) yadm = 0.485 and c) yadm = 0.900
Figure 6: Dimensionless temperature fields in the y-z plane for a) xadm = 0.042, b) xadm = 0.116, c) xadm = 0.526, d) xadm = 0.589, e) xadm = 0.779 and f) xadm = 0.842
Figure 7: Dimensionless temperature fields in the x-y plane for a) zadm = 0, b) zadm = 0.244, c) zadm = 0.489, d) zadm = 1
It should be noticed that in both case studies the scale was changed in order to perceive the differences of temperature in the DC room. Thus, the scale ranges from 0 to 0.4 dimensionless. By observing Figs. 5, 6 and 7 it can be noticed that there is no formation of hot spots. This condition occurs due to the maximum air airflow, and consequently, maximum air velocity possible. Therefore, all the heated air is exhausted successfully. Even with this air velocity it is possible to predict that the warmer air is located at the extremity of the rack lines. By comparing Fig. 7a) with Fig. 7c) it is possible to confirm that the heat is more intense at the base of the racks. The numerical model is validated by 3 measurements made and supplied by the data center.
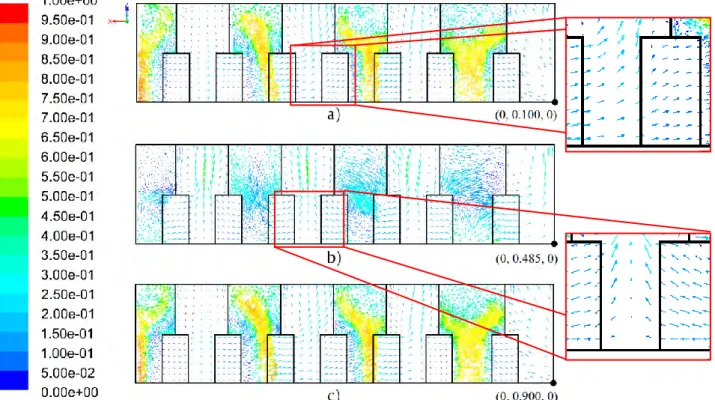
The hot spots observed at the extremities of the lines of the racks occur due to the improper airflow in these locations, as shown in Figs. 8a) and 8b). However, in the middle of the room, represented by Fig. 8b), the air flows as intended. The poor airflow that occurs at the extremities of the racks’ lines exists due to a deficient layout of the DC room. This can be noticed by observing the zoomed section of Fig. 8a) in which the air flows incorrectly from the hot aisle to the cold aisle, in the zoomed section from left to right. The correct direction of the air should be from the cold aisle to the hot aisle, as shown in the zoomed section of Fig. 8b).
Figure 8: Dimensionless velocity vectors profiles for the x-y plane a) yadm = 0.100, b) yadm. = 0.485, and c) yadm. = 0.900
4. CONCLUSIONS
In this paper a parametric study of CFD models to study the airflow of a data center room with 208 racks was presented. Two case studies were simulated with the most suitable thermal load, as deemed by the organization that provided the data in which the heat flow boundary condition is simulated and studied for maximum and minimum air velocity. The analysis of the numerical results showed that no hot spots occur in the case study with the maximum air flow and several hot spots occur in the case study with the minimum air flow. These hot spots are observed at the extremities of the lines of the racks and occur due to the improper airflow in these locations. Both case studies confirm this scenario. The poor air flow at the extremities of the lines of the racks occurs due to a deficient layout of the room. This study confirmed that the layout of the room is not ideal. A solution could be the removing at least a few racks from both lines’ extremities in order to enable a more adequate air flow in that location.
ACKNOWLEDGEMENTS
The current study was funded in part by Fundação para a Ciência e Tecnologia (FCT), under project UID/EMS/00151/2013 C-MAST, with reference POCI-01-0145-FEDER-007718.
REFERENCES
Behere, S., 2015. Airflow Optimization In Data Centers. Energy Eng. 112, 33–54. https://doi.org/10.1080/01998595.2015.11414491
Dayarathna, M., Wen, Y., Fan, R., 2016. Data Center Energy Consumption Modeling: A Survey. IEEE Commun. Surv. Tutor. 18, 732–794. https://doi.org/10.1109/COMST.2015.2481183 Díaz, A.J., Cáceres, R., Cardemil, J.M., Silva-Llanca, L., 2017. Energy and exergy assessment in a
perimeter cooled data center: The value of second law efficiency. Appl. Therm. Eng. 124, 820–830. https://doi.org/10.1016/j.applthermaleng.2017.06.066
Erden, H.S., Khalifa, H.E., Schmidt, R.R., 2014. A hybrid lumped capacitance-CFD model for the simulation of data center transients. HVACR Res. 20, 688–702. https://doi.org/10.1080/10789669.2014.930280
Hoang, M.L., Verboven, P., De Baerdemaeker, J., Nicolaı̈, B.M., 2000. Analysis of the air flow in a cold store by means of computational fluid dynamics. Int. J. Refrig. 23, 127–140. https://doi.org/10.1016/S0140-7007(99)00043-2
Li, Z., Kandlikar, S.G., 2015. Current Status and Future Trends in Data-Center Cooling
Technologies. Heat Transf. Eng. 36, 523–538.
https://doi.org/10.1080/01457632.2014.939032
Nada, S.A., Said, M.A., Rady, M.A., 2016a. Numerical investigation and parametric study for thermal and energy management enhancements in data centers’ buildings. Appl. Therm. Eng. 98, 110–128. https://doi.org/10.1016/j.applthermaleng.2015.12.020
Nada, S.A., Said, M.A., Rady, M.A., 2016b. CFD investigations of data centers’ thermal performance for different configurations of CRACs units and aisles separation. Alex. Eng. J. 55, 959–971. https://doi.org/10.1016/j.aej.2016.02.025
Nadjahi, C., Louahlia, H., Lemasson, S., 2018. A review of thermal management and innovative cooling strategies for data center. Sustain. Comput. Inform. Syst. 19, 14–28. https://doi.org/10.1016/j.suscom.2018.05.002
Ni, J., Jin, B., Zhang, B., Wang, X., 2017. Simulation of Thermal Distribution and Airflow for Efficient Energy Consumption in a Small Data Centers. Sustainability 9, 664. https://doi.org/10.3390/su9040664
North, T., 2011. Understanding How Cabinet Door Perforation Impacts Airflow. BICSI News Mag. 36–42.
Song, Z., Zhang, X., Eriksson, C., 2015. Data Center Energy and Cost Saving Evaluation. Energy Procedia, Clean, Efficient and Affordable Energy for a Sustainable Future: The 7th International Conference on Applied Energy (ICAE2015) 75, 1255–1260. https://doi.org/10.1016/j.egypro.2015.07.178
Wendt, J. (Ed.), 2009. Computational Fluid Dynamics: An Introduction, 3rd ed. Springer-Verlag, Berlin Heidelberg.
Zhang, K., Zhang, Y., Liu, J., Niu, X., 2018. Recent advancements on thermal management and evaluation for data centers. Appl. Therm. Eng. 142, 215–231. https://doi.org/10.1016/j.applthermaleng.2018.07.004
Zhou, C., Yang, C., Wang, C., Zhang, X., 2018. Numerical simulation on a thermal management system for a small data center. Int. J. Heat Mass Transf. 124, 677–692. https://doi.org/10.1016/j.ijheatmasstransfer.2018.04.005