Universidade do Minho
Escola de Ciências
Andreia Fernandes Afonso
Protective effect of acetic acid
against ethanol-induced cell death in
Saccharomyces cerevisiae
Dissertação de Mestrado em Genética
Molecular
Trabalho efectuado sob orientação da
Professora Doutora Maria João Sousa
Trabalho efectuado sob co-orientação da
Professora Doutora Manuela Côrte-Real
DECLARAÇÃO
Nome: Andreia Fernandes Afonso
Endereço electrónico: [email protected] Telefone:916842242
Número de Identificação Civil: 13426378
Título da tese de mestrado:
Protective effect of acetic acid against ethanol-induced cell death in Saccharomyces
cerevisiae
Efeito protetor do ácido acético na morte celular induzida por etanol em
Saccharomyces cerevisiae
Orientadora:
Professora Doutora Maria João Sousa Co-orientadora:
Professora Doutora Manuela Côrte-Real
Ano de conclusão: 2011
Designação do Mestrado ou do Ramo de Conhecimento do Doutoramento: Ciências - Mestrado em Genética Molecular
1. É AUTORIZADA A REPRODUÇÃO INTEGRAL DESTA TESE/TRABALHO APENAS PARA EFEITOS DE INVESTIGAÇÃO, MEDIANTE DECLARAÇÃO
ESCRITA DO INTERESSADO, QUE A TAL SE COMPROMETE;
Universidade do Minho, ___/___/______
iii
Acknowledgments/Agradecimentos
Quero expressar o meu mais sincero agradecimento às minhas orientadoras Professora Doutora Maria João Sousa e Professora Doutora Manuela Côrte-Real, pela orientação científica, apoio prestado, simpatia, paciência e pela forma sempre positiva como analisaram todo o meu trabalho…mesmo quando eu mesma não conseguia ver algo de positivo nos meus resultados! Muito obrigada.
Gostaria de agradecer aos meus pais por todo o amor, pelo apoio incondicional e pelo grande esforço que fizeram para me financiarem o mestrado. Sem eles a realização desta tese não era possível. Espero poder recompensar-vos em breve...
À minha irmã, Mariana, quero agradecer-lhe o carinho, preocupação, alegria e admiração pelo meu trabalho…Quem sabe não estará no Micro I daqui a alguns anos...! Além disso, quero agradecer-lhe pela compreensão dos fins-de-semana e feriados em que estive ausente por motivos de trabalho.
Ao meu namorado, Filipe, pelo amor, alegria, carinho e acima de tudo paciência, pelas longas horas à espera que eu terminasse os meus ensaios…Pelos fins-de-semana em que estive ausente e pelo apoio nos momentos mais difíceis…
Aos meus colegas de mestrado, em particular à Joana Tulha, à Joana Carvalho, ao Rui, ao Fábio, à Catarina e à Ângela, pelos longos debates sobre trabalho, pelos almoços atribulados no corredor do departamento e por toda a alegria e apoio ao longo deste ano.
Aos meus colegas de laboratório, pela alegria, amizade, boa disposição e pelos bons momentos que passamos juntos. À Susana pelo apoio e pela revisão do inglês, à Dulce e à Marlene, pela companhia e ajuda em todos os momentos, ao Rui e á Sara pela simpatia, à Gabriela pela alegria e dicas de culinária , à Helena e ao António pela boa disposição e simpatia, ao Dário pela preocupação, disponibilidade e ajuda incondicional, ao Flávio, meu assessor de campanha, pela alegria, simplicidade e disponibilidade para prestar auxilio em tudo e a todos.
Em especial, o meu agradecimento à Andreia Pacheco, que sempre me apoiou de forma incondicional e pelas vezes que deixou de parte o seu trabalho para me ajudar. Ajudou-me a crescer na ciência e como pessoa. Ficarei eternamente grata por todo o apoio.
A todos, o meu muito obrigado! Graças a todos vós, atrevo-me a dizer que estive no melhor laboratório do CBMA!
Quero agradecer à Dona Isabel, à Nádia, à Dona Sameiro, ao Sr. Amaro, à Manuela, à Manela, à Dr. Cristina e à Eng. Magda pelo simpatia, profissionalismo e ajuda para que estivessem sempre reunidas todas as condições de trabalho.
Por fim, gostaria de agradecer ao Centro de Biologia Molecular e Ambiental, ao programa FEDER através do POFC–COMPETE e ao projecto da FCT PEst-C/BIA/UI4050/2011 e PTDC/AGR-ALI/102608/2008 pelo financiamento deste trabalho.
iv
Resumo
O etanol é um produto final bem conhecido da fermentação alcoólica realizada por Saccharomyces cerevisiae. Em altas concentrações, é responsável pela redução de viabilidade celular e inibição da fermentação. Além disso, durante a fermentação alguns ácidos fracos, como os ácidos acético, butírico e pirúvico, produzidos pelo metabolismo da levedura, podem acumular-se no meio de crescimento e aumentar a toxicidade do etanol, o que resulta numa maior inibição de crescimento e fermentação (Gibson, et al., 2007). No entanto, dados obtidos anteriormente mostraram que culturas celulares de S.
cerevisiae tratadas simultaneamente com concentrações tóxicas de etanol e baixas
concentrações de ácido acético exibiam maiores taxas de sobrevivência (medido pela contagem de UFC e por ensaios citométricos) quando comparado com células tratadas apenas com etanol. Estes resultados indicam que o ácido acético induz uma resposta celular que confere proteção contra os efeitos citotóxicos do etanol (Vieira et al., resultados não publicados).
Posteriormente, foi demonstrado que a MAP cinase Hog1p e a aquogliceroporina Fps1p, envolvidas na resistência em ácido acético, não mediam este efeito protetor do ácido (Trindade, 2009).
O objetivo do presente trabalho foi estudar o papel de outras vias de sinalização e os mecanismos envolvidos na proteção do ácido acético contra a morte induzida pelo etanol (13% v / v, pH 3,5). Demonstramos que esse efeito depende da dose de ácido adicionado, sendo a concentração ótima 0,1% (v / v). Ácido propiónico, à semelhança do ácido acético e contrariamente ao ácido lático e fórmico, também confere proteção. O mutante na cinase Slt2/Mpk1, conhecida por ser ativada na presença de ácido acético (Mollapour e Piper, 2006), reverte parcialmente o efeito de proteção do ácido, especialmente em relação à preservação da integridade da membrana plasmática. A presença de trealose no meio de cultura promove o efeito protetor do ácido acético. O transporte e acumulação de trealose parecem ser necessários para a proteção por ácido acético contra a perda da integridade da membrana plasmática, mas não de viabilidade celular induzida por etanol. Culturas celulares com a cadeia respiratória afectada (0) não apresentam maiores taxas de viabilidade célular na presença de ácido acético, quando comparado com as mesmas culturas tratadas apenas com etanol, sugerindo que a mitocôndria pode estar envolvida no efeito protetor.
v
Abstract
Ethanol is a well-known end product of alcoholic fermentation carried out by
Saccharomyces cerevisiae. At high concentrations it reduces cell viability and inhibits
fermentation. During fermentation, some weak acids such as acetic, butyric and pyruvic acids, produced by yeast metabolism, may accumulate in the growth medium and enhance ethanol toxicity, which results in a higher inhibition of yeast growth and of fermentation (Gibson, et al., 2007) However, previous data obtained in our lab showed that S. cerevisiae cells exposed simultaneously to toxic concentrations of ethanol and low concentrations of acetic acid displayed higher survival (measured either by CFU or by propidium iodide staining) than cells treated only with ethanol. These results indicated that acetic acid induces a cellular response that provides protection against the cytotoxic effect of ethanol (Vieira et al., unpublished results). Subsequently, it was shown that the Mitogen-Activated Protein Kinase (MAPK) Hog1p and the aquoglyceroporin Fps1p, involved in acetic acid resistance, did not mediate this protective effect of the acid (Trindade, 2009).
The aim of the present work was to study the role of other signaling pathways and the mechanisms by which acetic acid confers protection against death induced by ethanol (13% v/v, pH 3.5). We found that this effect is dose-dependent and optimal for 0.1% (v/v) of acetic acid. Propionic, but not lactic or formic acids, also confer protection from ethanol-induced cell death. Deficiency in the MAPK Slt2/Mpk1, which is activated in the presence of acetic acid (Mollapour and Piper, 2006), partially reverts the acetic acid protective effect, especially in the preservation of plasma membrane integrity. We also found that the presence of trehalose in the culture medium promoted the protective effect of acetic acid. Trehalose transport and accumulation seem to be necessary for acetic acid to protect cells from loss of the plasma membrane integrity induced by ethanol, but not of cell viability. Finally, we show that the protective effect of acetic acid was not observed in a respiratory deficient mutant (ρ0), suggesting that mitochondria may be involved in this process.
vi
Index
Resumo ... iv Abstract ... v Index ... vi Abbreviations ... viii 1. Introduction ... 91.1 Yeast: a model for fundamental and applied research ... 9
1.2 Stress in yeast ... 10
1.2.1 Ethanol stress ... 11
1.2.2 Weak carboxylic acids stress ... 13
1.3 Protection mechanisms in response to cell stress ... 14
1.3.1 Cell stress responses- protection mechanisms- trehalose accumulation ... 15
1.3.2 The cell stress response to ethanol ... 16
1.3.3 The cell stress response to weak carboxylic acids ... 20
1.4. Aim ... 22
2. Materials and Methods ... 23
2.1. Yeast Strains ... 23
2.2. Media and Growth Conditions ... 23
2.3. Cell viability assays ... 23
2.4. Flow cytometric assays ... 24
2.5. Assays with different acids at different concentrations ... 24
2.6. Assays at different pH values ... 24
2.7. Transformation of the BY4741 Rho + strain in to BY4741 Rho 0 ... 25
2.8. Identification of a Rho 0 strain of Saccharomyces cerevisiae: ... 25
3. Results and Discussion ... 26
3.1. Acetic acid protects cells from ethanol-induced cell death in Saccharomyces cerevisiae ... 26
3.1.1. The protective effect of acetic acid depends on its concentration ... 27
3.1.2. The protective effect depends on the undissociated form of acetic acid ... 28 3.1.3. Specificity of the protective effect: the role of other weak carboxylic acids 31
vii
Formic Acid ... 31
Lactic Acid ... 32
Propionic Acid ... 33
3.2. The protective effect of acetic acid against ethanol stress in the slt2 mutant ... 34
3.3. Protective effect of acetic acid against ethanol stress in the sfl1 mutant ... 37
3.4. The role of trehalose in protective effect of acetic acid against ethanol stress ... 40
3.4.1. Experiments with the Wt strain ... 41
3.4.2. Experiments with the tps1 mutant ... 43
3.4.4. Experiments with the agt1 mutant ... 47
3.4.5. Experiments with the hsp12 mutant ... 48
3.5. Protective effect of acetic acid against ethanol stress: the role of mitochondria . 50 3.5.1 Experiments with Rho 0 mutant ... 50
4. Conclusions and future perspectives ... 54
viii
Abbreviations
CDI Cyclin-Dependent kinase Inhibitors
C.F.U. Colony Forming Units
DNA Deoxyribonucleic acid
ESR Environmental Stress Response
Fis1 Mitochondrial fission protein
GSSG Glutathione disulfide
GFP Green Fluorescence Protein
HSEs Heat Shock Elements
HSP Heat Shock Protein
LEA Late Embryogenic Abundant
MAPK Mitogen-activated protein kinase
MnSOD Mitochondrial Manganese-Superoxide Dismutase
mRNA Messenger Ribonucleic Acid
PBS Phosphate Buffered Saline
PCD Programmed Cell Death
pH Potential of Hydrogen
PHD Plant Homeo Domain
PKC Protein kinase C
ROS Reactive oxygen species
RNA Ribonucleic acid
RNS Reactive nitrogen species
TPS1 Trehalose-6-Phosphate Synthase
YPD Yeast Peptone Dextrose
Wt Wild-type
9
1. Introduction
1.1 Yeast: a model for fundamental and applied research
Yeasts are eukaryotic unicellular fungi that have ultrastructural features similar to those of higher eukaryotic cells. Moreover, they are easy to manipulate genetically and their growth/divison can be efficiently controlled, making yeast an advantageous eukaryote model for molecular and cellular biology studies.
The most commercially exploited yeast species, Saccharomyces cerevisiae, has been traditionally used in the brewing, baking and wine-making industries. With advances in yeast biotechnology, this organism became very important in different industries including pharmaceutical, food and beverages, chemical and in the agriculture and environment fields.
Current pressure to find renewable fuel alternatives increased the interest in biotechnological applications of yeast to produce a gasoline substitute such as bioethanol. Bioethanol is the biofuel with the highest production worldwide and several strategies are being developed to enhance its production on a large scale (Muthaiyan and Ricke, 2009). The first biological process used for producing ethanol at an industrial scale was the fermentation of sugars by yeasts. S. cerevisiae is an example of an organism used in biofuel bioprocessing, but other species are also used such as other
Saccharomyces spp, Kluyveromyces marxianus, Pachysolen tannophilus and Sheffersomyces stipitis (Muthaiyan and Ricke, 2009).
In agriculture, several yeast species have proven beneficial to plants, preventing fungal disease. More benefits of yeasts were found in certain aspects of pollution control; for instance, yeast can absorb heavy metals and detoxify chemical pollutants from industrial effluents (Madeo, et al., 2002).
Although yeasts have a lot of applications in several sectors, one of the most important is their use as a model for medical research, such as in the understanding of eukaryotic cell division, cell death and human pathologies (Madeo, et al., 2002). The presence of an apoptosis regulatory network in yeast that encompasses many of the crucial events that occur in mammalian cells stimulated several studies in disease-related proteins that have no homologues in this organism and created a new research
10 field with the so-called humanized yeast systems, providing cell-based assays to discover novel medicinal compounds (Mager and Winderickx, 2005). Yeast recombinant DNA technology also provides a valuable tool to uncover potential novel human therapeutic agents. Yeasts have thus been an extremely valuable experimental model in biomedical research such as in oncology, pharmacology, toxicology, virology, and human genetics (see Table 1).
Tabel 1- Value of yeasts in biomedical research (Adapted from Walker, 2009)
Biomedical field Examples
Oncology Basis of cell cycle control, human oncogene (e.g., Ras) regulation; telomere function, tumor suppressor function, and design of (cyclin-dependent kinase inhibitors) CDIs/anti-cancer drugs
Aging and Apoptosis
Mechanisms of cell aging, longevity genes, and apoptosis
Pharmacology Multidrug resistance, drug action/metabolism, and drug screening assays
Virology Viral gene expression, antiviral vaccines, and prion structure/function
Human genetics Basis of human hereditary disorders and genome/proteome projects
1.2 Stress in yeast
In their natural habitat, yeasts might be exposed to changes in environmental conditions, and extreme changes represent a stress to the cells. Stress-inducing conditions can be physical or chemical, such as changes in temperature, osmotic pressure, pH, concentration of water, ions and solutes, exposure to extremes of radiation, pressure, toxic chemicals or oxidative conditions and nutrient starvation. Stress can also be imposed by the host defense mechanism on pathogenic yeasts. An important host defense mechanism is the oxidative burst (production of high levels of reactive oxygen species - ROS) promoted by neutrophil cells used to eliminate pathogenic yeasts (Moye-Rowley, 2003).
11 Yeasts might be exposed to several stresses simultaneously or sequentially. When Saccharomyces cerevisiae cells are grown under fermentative conditions, they are initially exposed to a high sugar concentration that promotes osmotic stress. The sugar is then fermented to ethanol and the osmotic pressure is reduced, but simultaneously the concentration of ethanol increases and adds extra water and ethanol stress to yeast. Upon exposure to different stresses, yeast sequentially expresses different stress response genes (Zuzuarregui and del Olmo, 2004).
1.2.1 Ethanol stress
Ethanol is well known as the main stress factor during the process of alcoholic fermentation. At low concentrations, it is responsible for the inhibition of growth and cell division, and promotes a decrease in cell volume and specific growth rate. High concentrations of ethanol reduce the cell viability and increase cell death (Birch and Walker, 2000; Stanley, et al., 2010). Moreover, there are changes in metabolism such as decreased mRNA and protein levels, a decrease of different transport systems like the general amino acid permease system and glucose uptake, enhanced frequency of petite mutations, and inhibition of the activity of some glycolytic enzymes (Alexandre, et al., 2001). Exposing the cell to toxic levels of ethanol also promotes damage of mitochondrial DNA (You, et al., 2003), induction of heat shock proteins and other stress response proteins, as well as intracellular accumulation of trehalose.
Additional targets of ethanol are the cell membrane, hydrophobic and hydrophilic proteins, and the endoplasmatic reticulum (Walker and Maynard, 1997), although the structure and function of the cell membrane seems to be the predominant target. The effect of ethanol on cell structure and membrane function is accompanied by changes in vacuole morphology, inhibition of endocytosis, increased unsaturated ⁄saturated fatty acid ratio and ergosterol content in membranes, loss of electrochemical gradients and proton-motive force and an increase in membrane fluidity. These alterations in the fluidity of the plasma membrane promote changes in the permeability to ionic species, especially protons (Baker and Lynen, 1971). The increased proton influx across the plasma membrane causes intracellular acidification, which can be surpassed by the incorporation of oleic acid into lipid membranes that counteracts the fluidizing effects
12 of ethanol (Araki, et al., 2009; Casal, et al., 1998). In S. cerevisiae, ethanol stress can stimulate the Ca2+-mediated calcineurin/Crz1 pathway (Das and Vasudevan, 2007). Ethanol is also known to promote oxidative stress by the production of ROS and RNS (Viegas and Sa-Correia, 1997). The main effects of ethanol on the yeast cell are summarized in Table 2. However, yeast has developed several stress response pathways that allow it to survive under stress conditions, such as changes in cell cycle progression, metabolic activity, and gene expression (Hohmann and Mager, 2003).
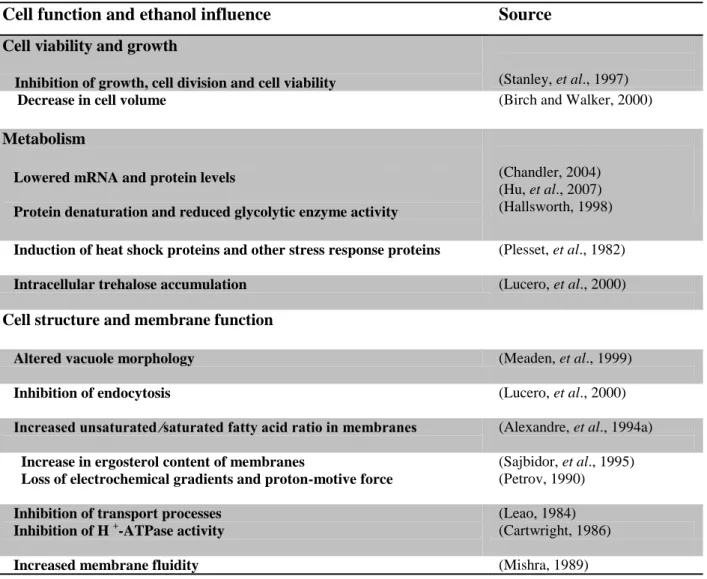
Table 2- Cell functions affected by ethanol (adapted from Stanley, et al., 2010)
Cell function and ethanol influence Source
Cell viability and growth
Inhibition of growth, cell division and cell viability (Stanley, et al., 1997) Decrease in cell volume (Birch and Walker, 2000)
Metabolism
Lowered mRNA and protein levels
Protein denaturation and reduced glycolytic enzyme activity
(Chandler, 2004) (Hu, et al., 2007) (Hallsworth, 1998)
Induction of heat shock proteins and other stress response proteins (Plesset, et al., 1982)
Intracellular trehalose accumulation (Lucero, et al., 2000)
Cell structure and membrane function
Altered vacuole morphology (Meaden, et al., 1999)
Inhibition of endocytosis (Lucero, et al., 2000)
Increased unsaturated ⁄saturated fatty acid ratio in membranes (Alexandre, et al., 1994a)
Increase in ergosterol content of membranes
Loss of electrochemical gradients and proton-motive force
(Sajbidor, et al., 1995) (Petrov, 1990)
Inhibition of transport processes Inhibition of H +-ATPase activity
(Leao, 1984) (Cartwright, 1986)
13
1.2.2 Weak carboxylic acids stress
It is well known that weak carboxylic acids control microbial growth, and they are used as preservatives in several industries such as the food, agriculture and pharmaceutical industries. Due to their reduced negative impact on the environment, they are also used as raw materials for several products, ranging from new plastics to pharmaceuticals and cosmetic products (Abbott, et al., 2009). S. cerevisiae has also proven to be an invaluable eukaryote model to study the cytotoxic effects and the cellular responses to weak carboxylic acids used as pharmaceuticals or pesticides (Mira,
et al., 2010).
During fermentation, some weak carboxylic acids such as acetic, butyric and pyruvic acids, produced by yeast metabolism, accumulate in the growth medium. In conjunction with ethanol toxicity, this can result in growth arrest of fermenting cells and decrease the productivity of grape must fermentation (Gibson, et al., 2007).
The cytotoxic effect of acetic acid on the fermentative yeast S. cerevisiae and its role as a physiological inducer of apoptosis was recently reviewed (Vilela-Moura, et al., 2011). At low pH, the undissociated form of the weak acid predominates and may permeate the plasma membrane by simple diffusion (Casal, et al., 1996), Recently, it has been suggested that the aquaglyceroporin Fps1p can also be involved in acetic acid transport into the cell (Mollapour and Piper, 2007). Once inside the cell, where the pH is usually close to neutrality, the undissociated form of the acid can release its proton, promoting intracellular acidification, anion accumulation, and inhibition of cellular metabolic activity, namely fermentation (Pampulha and Loureiro-Dias, 1989) and alterations in glycolysis (Pampulha and Loureiro-Dias, 1990). Under certain conditions, acetic acid is also responsible for two types of cell death, high- and low-enthalpy (Pinto, et al., 1989). Assessment of cellular structural and functional changes pointed to an intracellular localization of the acetic acid cellular target(s) (Ludovico, 1999 ; Prudêncio, et al., 1998). The use of cellular death markers allowed the characterization of the cell death process. Exponential-phase cultures of S. cerevisiae treated with high concentrations of acetic acid (120-200 mM), exhibited a necrotic phenotype, while cultures treated with low doses ( 20-80 mM) evidenced a programmed cell death (PCD) process (Ludovico,
et al., 2001). Cells exposed to low concentrations of acid displayed
cycloheximide-inhibitable alterations in chromatin condensation along the nuclear envelope, exposure of phosphatidylserine on the surface of the cytoplasmic membrane and the occurrence
14 of DNA strand breaks. High levels of acid promote DNA breakdown into fragments of several hundred kilobases (Ribeiro, et al., 2006). There is also evidence that the acetic acid-induced PCD process in S. cerevisiae cells is accompanied by reactive oxygen species (ROS) accumulation, decrease in cytochrome oxidase activity affecting mitochondrial respiration, and other events that show the involvement of mithocondria in the yeast PCD process (Giannattasio, et al., 2005; Ludovico, et al., 2002).
Although weak acids inhibit cell growth, yeasts have developed adaptation mechanisms that allow them to grow in their presence, at low pH. When cells are exposed to inhibitory concentrations of acid in the growth medium, there is a growth arrest and cells initiate a latency period. However, when these cells are reinoculated into fresh-growth-medium under the same conditions of pH and acid content, no cell arrest is observed because cells had developed several adaptation molecular responses, which allow them to survive (Cabral, et al., 2001; Viegas and Sa-Correia, 1997).
1.3 Protection mechanisms in response to cell stress
Yeasts have developed mechanisms that enable them to survive under stress conditions and render the yeast used for baking, brewing and winemaking more tolerant to extreme conditions. These mechanisms are highly complex and tolerance is acquired through rapid molecular responses that protect against damage caused by ongoing exposure to the same or other agents of stress.
The cellular damage caused by one type of stress can be specific for this stress or common to other types of stress, and the mechanisms of protection and repair can thus partially overlap (Beck, et al., 2000; Davidson, et al., 1996; Mager, et al., 2000; Pahlman, et al., 2001; Rep, et al., 2000; Tanghe, et al., 2002). These responses include changes in gene transcription and translational and post-translational modifications of stress-associated proteins, and are triggered, at least in part, by stress-induced denaturation of proteins, disordering of membranes, DNA damage and metabolic disturbances (Mager and Ferreira, 1993; Piper, 1993; Siderius, et al., 1997). The major yeast stress-response mechanisms that protect yeast cells against various types of stress are: accumulation of trehalose, synthesis of molecular chaperones, antioxidant proteins and hydrophylins, accumulation of compatible solutes, and changes in the composition
15 of the plasma membrane. A specific mechanism to protect cells from freeze stress through the expression of aquaporins has also been described (Tanghe, et al., 2002).
1.3.1 Cell stress responses- protection mechanisms- trehalose accumulation
Trehalose (α-D-glucopyranosyl (1–1)-α-D-glucopyranoside) is a disaccharide produced by a wide variety of organisms. It is synthesized by a multimeric protein complex composed of Tps1p, Tls1p, Tps3p and Tps2p (Bell, et al., 1998; Reinders, et
al., 1997). Tps1p is the only component that catalyzes the formation of trehalose from
UDP-Glc and glucose-6-phosphate, and it is essential for growth in fermentable carbon sources like glucose and fructose. Accordingly, deletion of TPS1 results in loss of trehalose accumulation. Synthesis of trehalose does not occur in ∆tps1 mutants, and any intracellular trehalose detected in these cells is likely a result of its uptake from the YPD medium. Uptake is largely dependent on the expression of AGT1, which encodes an α-glucoside transporter (Plourde-Owobi, et al., 1999).
Trehalose has been described as a reserve carbohydrate with a crucial role in stress tolerance and protection. Depending on the environmental conditions, it can constitute up to 25% of the dry mass of S. cerevisiae. Accumulation of trehalose increases stress resistance of yeast growing on non-fermentable carbon sources (Van Dijck, et al., 1995), and resistance to freezing (Soto, et al., 1999) . In S. cerevisiae, endocytosis is inhibited in the presence of 2 to 6% (v/v) ethanol. This inhibition is accompanied by an accumulation of the stress protectors trehalose and Hsp104p, both important for ethanol stress resistance (Lucero, et al., 2000). Trehalose may also protect membranes from desiccation, maintaining membrane integrity by substituting water molecules and binding to the polar head-groups of phospholipids (Crowe, et al., 1992). Intracellular trehalose accumulates in response to menadione stress, but when cells are exposed to H2O2 it is only required outside the plasma membrane. When both stresses
are present simultaneously, trehalose protection is required on both sides of the lipid bilayer, preventing lipid oxidation of both the outer and inner layers of the plasma membrane, as well as oxidation of proteins (da Costa Morato Nery, et al., 2008).
When studying resistance to freezing, Pacheco and co-workers (Pacheco, et al., 2009) observed that the intracellular concentration of trehalose was 50% higher in
16 as a Late Embryogenic Abundant LEA-like protein in S. cerevisiae (Mtwisha L., et al., 1998) and is induced in cells exposed to heat shock, osmotic, oxidative, and ethanol stresses. Nevertheless, hsp12∆ mutants were more resistant to freezing in prolonged storage at – 20º C than Wt cells. This was explained by the higher intracellular trehalose concentration observed in these mutants. Synthesis and accumulation of trehalose, along with glutathione, has also been reported as a protection mechanism used by cells under stress caused by high pressure (Yongsheng Dong 2007).
In summary, the accumulation of trehalose has been implicated in the tolerance to several stresses. However, if high levels persist during recovery from stress, it can lead to inactivation of important yeast enzymes such as glutathione reductase, that reduces glutathione disulfide (GSSG) to the sulfhydryl form GSH, an important cellular antioxidant. (Sebollela, et al., 2004). A fine-tuned balance is therefore needed between trehalose synthesis and degradation.
1.3.2 The cell stress response to ethanol
Ethanol constitutes the main source of stress during fermentation. After exposure to sub-lethal concentrations of ethanol, yeast develops molecular mechanisms that increase tolerance to ethanol stress. Thus, the response of yeasts to environmental stress is complex, and various aspects of cell sensing, signal transduction, transcriptional and posttranscriptional control, protein-targeting, accumulation of protectants, and increased activity of repair functions are involved (Mager and Ferreira, 1993). Similarly to heat shock, ethanol promotes the expression of HSPs (Heat Shock Proteins), although their role in this type of stress is not well understood (Mahmud, et al., 2010).
Some studies have suggested that the lipid composition and fluidity of the plasma membrane is the basis for ethanol resistance (Alexandre, et al., 1994b; You, et
al., 2003). In addition, five genes related to the integrity of the cell wall (BEM2, PAT1, ROM2, VPS34 and ADA2) are required for ethanol tolerance (Takahashi, et al., 2001).
Mutants lacking mitochondrial manganese-superoxide dismutase (MnSOD) are also sensitive to ethanol, indicating that SOD2 is essential for ethanol tolerance (Costa, et al., 1997 ).
The toxicity of alcohols is directly related to their lipophilicity. Lipophilicity is represented by log Pow (logarithm of the octanol and water partition coefficient of a
17 solvent) and is used to estimate the toxicity of alcohols. Fujita and co-workers showed that this correlation is applicable to the yeast Saccharomyces cerevisiae, and also showed that lipophilic alcohols with high log Pow values were more toxic to yeast
(Fujita, et al., 2004). Based on this correlation, these authors decided to study the genes required for tolerance to ethanol and other alcohols. The screen identified 137, 122 and 48 mutants clearly more sensitive to ethanol, 1-propanol, and 1-pentanol, respectively, and 33 of the mutants were more sensitive to all three alcohols. All genes classified as having a vacuolar function (13) conferred co-sensitivity to ethanol,propanol and 1-pentanol. It is known that the vacuolar H+ - ATPase (V-ATPase) pump acidifies intracellular vacuolar compartments (Stevens and Forgac, 1997). Interestingly, of the 13 deletion mutants, seven genes were involved in hydrogen-transporting ATPase activity and 10 genes were involved in vacuolar acidification. This suggests that V-ATPase function is fundamentally required for alcohol tolerance. Interestingly, more genes are needed for tolerance to alcohols with lower toxicity, such as ethanol. In fact, the number of genes required for tolerance to alcohols seems to be closely related to their lipophilicity (or toxicity). It was observed that the mutants sensitive to 1-propanol and 1-pentanol were also ethanol- sensitive. These results imply that a certain core set of genes is required for tolerance to various alcohols, regardless of their lipophilicity (or toxicity).
Alexandre and co-workers analyzed global gene expression during a short-term ethanol stress in S. cerevisiae and clustered the genes with altered expression into functional classes according to Gene Ontology (Fig.1) (Alexandre, et al., 2001). This distribution clarified the molecular mechanisms that promote ethanol tolerance. Down-regulated genes were mostly involved in cell growth, cellular biogenesis, protein biosynthesis and RNA metabolism. Down-regulation of these genes could be a reflex of the growth arrest that occurs in the presence of stress, which allows the cell to save energy and develop adaptation mechanisms. However, the genes that were up-regulated are mainly involved in energetic metabolism, ionic homeostasis, protein trafficking and stress response. Another study reported another set of genes that are up-regulated during ethanol stress, the ESR family (environmental stress response) (Gasch, et al., 2000). Other genes reported in this study were the SSA1, SSA2, SSA3, SSA4, SSE1 genes. They encode HSP70 family members, supporting the prediction that one of the main effects of ethanol is protein unfolding.
18 Fig. 1 - Distribution of ethanol-induced genes in the most representative classes. A: Induced genes, B: down-regulated genes (Adapted from Alexandre, et al., 2001)
Yet another study reported that genes encoding proteins involved in vacuolar function, cell integrity pathway, mitochondrial function, subunits of the co-chaperone complex GimC and components of the SAGA transcription factor complex were required for growth under ethanol stress (van Voorst, et al., 2006). A more directed study sough to determine whether the MSN2/MSN4 pathway is activated in response to ethanol stress. The authors assessed the localization of a C-terminal Msn2-GFP fusion protein and found that, under ethanol stress, most of the fluorescence was accumulated in the nucleus, indicating there is activation of the general stress response. Similar results were observed with Ars1p (a yeast Ring ⁄ PHD finger protein that constitutively shuttles between the cytoplasm and nucleus), but curiously this translocation to the nucleus was observed under ethanol stress but not under heat, osmotic and oxidative stresses (Betz, et al., 2004).
TPS1 and other genes associated to trehalose synthesis including TLS1, TPS2, UGP1 and PGM2 were induced under ethanol stress (Alexandre, et al., 2001).These
results were expected, as trehalose had previously been reported to accumulate in response to ethanol stress and its protective role against ethanol had been established (Mansure, et al., 1994) HSP genes were also induced under ethanol stress conditions (Alexandre, et al., 2001). Similarly to heat treatment, co-induction of trehalose and the HSP genes during ethanol stress supports the existence of a tight link between these two protective agents (Alexandre, et al., 2001; Winkler, et al., 1991). A model describing this interplay has been put forward (Singer and Lindquist, 1998) suggesting that in a
17% 8% 10% 4% 17% 44%
A
Energy Stress Protein destination Ionic homeostasis Unknown functions Others 34% 4% 3% 23% 23% 13%B
Protein synthesis Cell growth Cellular Biogenesis Unknown functions Others RNA metabolism19 first step trehalose biosynthesis prevents proteins denaturation, subsequently HSP prevent protein aggregation, and finally the dissacharide is degraded because it impedes protein stabilization by HSPs.
Phosphorylation of the MAPK Slt2p has also been observed in response to ethanol (van Voorst, et al., 2006) This is in accordance with another study that concluded that ethanol is responsible for the activation of the PKC/Slt2 cell wall integrity pathway, and that deletion of genes encoding various components of this pathway result in ethanol sensitivity (Hirasawa, et al., 2007; Zu, et al., 2001). In addition, Takagi and co-workers reported that intracellular accumulation of proline might confer tolerance to ethanol stress in yeast, and defend that tryptophan can also contribute to ethanol tolerance (Takagi, et al., 2005).
1.3.2.1 – Does Saccharomyces cerevisiae have a specific ethanol stress response?
Although the involvement of general stress response mechanisms in ethanol stress has been described, some authors defend that there is an ethanol-specific response (Betz, et al., 2004; Takemura, et al., 2004). In Saccharomyces cerevisiae, ethanol stress causes selective mRNA export, similarly to heat shock. While analyzing the effect of stress on mRNA export factors, it was found that the DEAD box protein Rat8p showed a rapid and reversible change in its localization in cells treated with high concentrations of ethanol, accumulating in the nucleus. However, the localization of Rat8p did not change in heat-shocked cells, suggesting that changes in the localization of Rat8p contribute to the selective export of mRNA in ethanol stressed yeast cells, and indicating there are differences in mRNA export triggered by the heat shock response and the ethanol stress response (Takemura, et al., 2004).
Another ethanol-specific transcription regulator has been identified, Asr1. Asr1 is a yeast Ring ⁄ PHD finger protein that constitutively shuttles between the cytoplasm and nucleus. It accumulates in the nucleus rapidly and reversibly in response to alcohol stress (Betz, et al., 2004), but not to other stresses such as oxidative, osmotic, nutrient limitation, and heat. However, a specific role for Asr1p in response to ethanol stress was not supported by a different study, which confirmed this nuclear accumulation but did not find a phenotype associated with absence of Asr1p in ethanol tolerance (Izawa, et al., 2006). Further work is needed to determine if Asr1p is involved
20 in a specific alcohol stress response, as well as to identify a possible specific ethanol stress response in S. cerevisiae.
1.3.3 The cell stress response to weak carboxylic acids
Mollapour and Piper, (2006) studied the mechanisms involved in acetic acid resistance in S. cerevisiae by screening protein kinase deletion strains of S. cerevisiae. They found that the high-osmolarity glycerol (HOG) mitogen-activated protein (MAP) kinase cascade is important for acetic acid resistance. In addition to the hog1∆ strain, there were three other acetic acid-sensitive deletion strains, pbs2∆, ssk1∆ and ctk2∆. From the kinases tested, only the loss of Hog1p generated acetate sensitivity, while the loss of the cell integrity MAP kinase Slt2/Mpk1 protein slightly increased acetate resistance. Based on these results, the authors concluded that the Hog1p mitogen-activated protein kinase determines acetic acid resistance in S. cerevisiae.
Recent studies have shown that when Hog1p is active it exerts important functions, for instance, at the plasma membrane, where it directly phosphorylates certain membrane ion transporters in osmostressed cells for rapid readjustment of the transmembrane fluxes of Na+ and K+ (Proft and Struhl, 2004). Mollapour and Piper (2006) also observed that Fps1p was a major factor in acetic acid resistance at low pH (4.5). Fps1 is an aquaglyceroporin, a membrane channel that mediates the flux of water and small solute molecules into and out of cells. Cells without Fps1p (fps1∆) were more resistant to acetic acid on solid media than the wild type strain. Deleting FPS1 rendered the activity of Hog1 MAPK, which is normally essential for resistance to acetic acid, dispensable. At low pH, accumulation of acetic acid was eliminated in acid-challenged cells without FPS1, which suggests that the entry of acetic acid in wild-type cells may occur by passive diffusion thought the Fps1p channel. In cultures at pH 6.8, the cellular accumulation of acetate was reduced in comparison to cultures at pH 4.5, which suggests that Fps1p facilitates the transmembrane flux of the undissociated form of acetic acid. In order to determine how Fps1p might be downregulated by Hog1p, the authors investigated if Fps1p levels were affected by acetic acid stress. Results showed that Hog1 MAPK activation by acetic acid directs endocytosis and degradation of Fps1p. It was concluded that Hog1p is responsible for the phosphorylation of Fps1p and
21 that this phosphorylation is the signal for the channel to be ubiquitinated and endocytosed to the vacuole.
Mollapour and Piper, (2006) also showed that both Hog1p and Slt2p MAP kinases are active in cell cultures exposed to 100 mM acetate. However, only active Hog1p is needed for acetate resistance. While pH affects the kinetics of Hog1p phosphorylation in response to acetic acid stress, a much smaller effect was observed on the commensurate phosphorylation of Slt2p. It is known that the Slt2 MAP kinase is involved in cell wall remodeling and in the maintenance of cellular integrity (Levin, 2005) and that the membrane sensors Wsc1–4p, Mid2p and Mtl1p are upstream components of this pathway. Of the different mutants lacking the membrane sensors, deletion of Wsc1p had the greatest effect on acetic acid resistance. The cell wall integrity signaling activated by acetate was strongly dependent on Wsc1p and enhanced the loss of negative regulation of Rho1p GTPase activity. In the presence of acetic acid stress, the Fps1p channel is essential for Hog1p activation but the activation of Slt2(MPK)p is suppressed.
A genome-wide identification of S. cerevisiae genes required for tolerance to acetic acid was performed by Mira and co-workers (Mira, et al., 2010). Several genes implicated in the homeostasis and uptake of glucose, iron, potassium and amino acids were identified, revealing the importance of the capacity of the cell to efficiently promote uptake and biosynthesis of these molecules. In addition, expression of genes involved in the biosynthesis of plasma membrane lipids, including phospholipids (SUR4, CHO2, ARV1), sphingolipids (SUR1, SCS7) and ergosterol (ERG28, ERG4,
ERG3, ERG2), are essential to modulate the plasma membrane structure under acetic
acid stress (Dickson, 2008; Hillenmeyer, et al., 2008; van der Rest, et al., 1995). Other genes required for tolerance to acetic acid are those encoding proteins involved in protein mannosylation (MNN2 and MNN9) and in the activity and regulation of glucan synthase (FKS1, ROM2, ROT2, BEM4). Indeed, it has recently been proposed that glucan synthase is a biological target of acetic acid in yeast cells (Mollapour, et al., 2009).
28 transcription factors, including Haa1p, Rim101p, and Msn2p have also been described as required for the resistance to acetic acid (Mira, et al., 2010).
22
1.4. Aim
Previous works have shown there is an increase in cell viability when cells treated with high concentrations of ethanol are simultaneously exposed to sub-lethal concentrations of acetic acid, suggesting that low concentrations of acetic acid promote some type of response to ethanol stress (Vieira, 2001) (unpublished results from the lab).
Evidence of the involvement of the aquaglyceroporin Fps1p and of the MAP kinase Hog1p in acetic acid stress (Mollapour and Piper, 2006) triggered new studies to address the possible involvement of these proteins in the protector effect of acetic acid against ethanol stress. Several experiments on cell viability and analysis of membrane integrity were done, but deletion of these genes did not abrogate the protector effect. These observations suggested the protective effect of acetic acid against ethanol is independent of HOG1 and FPS1 (Trindade, 2009).
As referred above, both Hog1p and Slt2p are activated in the presence of acetic acid. Although deletion of SLT2 renders cells more resistant to acetic acid this does not exclude the possible involvement of the cell wall integrity pathway in the protective effect of acetic acid from ethanol stress (Mollapour, et al., 2009).
The present work proposed to study which are the signaling pathways that are induced by sub-lethal concentration of acetic acid, other than HOG pathway, that play a role in the tolerance to ethanol, and to further characterize this protective effect. With this aim, cell viability and cytometric assays were performed on Wt cells exposed to 13% (v/v) ethanol and different concentrations of acetic acid. The influence of medium pH and the specificity of acetic acid in this process were also tested. The involvement of several stress response mechanisms in the acetic acid induced protective effect was addressed by the use of mutants, namely, sfl1∆, slt2∆, tps1∆, agt1∆, hsp12∆ and a respiratory deficient mutant (ρ0), and by manipulating treatment conditions.
23
2. Materials and Methods
2.1. Yeast Strains
Strains used in this work were the Wt strain BY4741 and the mutants BY4741slt2∆, BY4741 sfl1∆, BY4741 tps1∆, BY4741 hsp12∆, BY4741 agt1∆ and BY4741 Rho0 .
All strains have the same auxotrophic markers (MATa his3Δ1 leu2Δ0 met15Δ0 ura3Δ0-) and were obtained from EUROSCARF collection except BY4741 Rho0
that was constructed(see 2.7.Transformation of BY4741 Rh0 + strain in BY4741 Rho 0).
2.2. Media and Growth Conditions
YPDA plates (1% yeast extract, 2% Bacto-peptone, 2% glucose and 2% agar) were prepared as previously described (Sambrook and Russell, 2001). Yeast cells were grown on YPDA plates at 30 °C for 2-3 days. After growth on YPDA, cells were then inoculated in Erlenmeyers with 10 ml of YPD medium, pH 3.5, at 26 ºC over-night (during 17-19 hours) with shaking (120 rpm).
2.3. Cell viability assays
For cell viability assays, 1.3 ml of 1*107 cels/ml were collected in a microcentrifuge tube with a small hole in the lid. The cells were centrifuged and resuspended in 1.3 ml of YPD medium at pH 3.5.. Different cell viability assays were done using 13% (v/v) ethanol and several concentrations of acetic acid (0.0%, 0.025%, 0.05%, 0.1%, 0.2% and 0.4%). Ethanol and acetic acid used were obtained from stock solutions of absolute ethanol (> 99%, v/v) and of 1M acetic acid at pH 3.5. Cells were incubated at 26 ºC with shaking (120 rpm) for 3 hours. 50 µl samples were collected at different times (30, 60, 120, 180 min). After 3 dilutions (one dilution at 1:10 and two dilutions at 1:20), 7 drops of 40 µl of the last dilution were plated on YPDA. Cell viability was analyzed by counting colony forming units (c.f.u) after 2-3 days of growth
24 at 30 ºC. The percentage of survival for the different times was calculated by the formula: number of colonies in time X min (TX)/ number of colonies in time 0 (T0) x 100.
2.4. Flow cytometric assays
Integrity of the cell plasma membrane was analyzed by flow cytometry using the impermeable dye propidium iodide (PI) (Molecular Probes, SIGMA). Flow cytometry assays were performed with cells treated under the same conditions as described for cell viability assays. 50 µl samples were collected at specific intervals (120 and 180 min). Cells were resuspended in 475 µL PBS (1x) to which 2.5 µl of a PI stock solution (0.1 mg/mL) were added, followed by a 10 min incubation at room temperature in the dark. A cellular suspension treated with 70% (v/v) of ethanol was used as a positive control. Samples were analyzed in a Beckman-Coulter Epics XL cytometer and data analyzed with version 2.9 of the WinMDI software.
2.5. Assays with different acids at different concentrations
Different concentrations of acetic acid were tested to understand if the protective effect of acetic acid against ethanol stress was dependent on the concentration. To test the specificity of acetic acid, other weak monocarboxylic acids were tested in different concentrations. The acids and the concentrations used were:
- Formic acid (0.0125%; 0.025%; 0.05%; 0.1% v/v) - Lactic acid (0.025%; 0.05%; 0.1%; 0.2% v/v) - Propionic acid (0.025%; 0.05%; 0.1% v/v)
Viability and flow cytometry assays were performed as described above.
2.6. Assays at different pH values
To understand the influence of pH in the protective effect of acetic acid against ethanol stress, experiments in media at different pH values were performed. Experiments were done in YPD at pH 3.5, 5.0 and 6.0 with 13% ethanol (v/v) and 0.1%
25 (v/v) acetic acid from a stock solution of 1 M acetic acid at pH 3.5, 5.0 and 6.0, respectively. Viability and flow cytometry assays were performed as described above.
2.7. Transformation of the BY4741 Rho
+strain in to BY4741 Rho
02x108 cells/ml were grown in 10 ml YPD supplemented with 25 µl/ml ethidium bromide (SIGMA) for 10 days at 30 ºC with shaking. Cells were plated on YPDA in different dilutions (10-3 , 10-4 , 10-5 , 10-6), grown at 30 ºC for 2-3 days and replicated onto YPGA (1% yeast extract, 2% Bacto-peptone, 2% glycerol and 2% agar). Colonies that did not grow on YPGA plates were selected and the Rho0 phenotype tested by fluorescence microscopy using DAPI staining as described below.
2.8. Identification of a Rho
0strain of Saccharomyces cerevisiae:
The presence of mitochondrial DNA was determined by staining with DAPI, 4’,6-diamidino-2-phenylindole (Molecular Probes, SIGMA). A mid-log phase culture was harvested and washed with water and 50% (v/v) EtOH. DAPI was added at a final concentration of 0.1 mg/ml and cells were incubated at room temperature in the dark for 5 min and examined by fluorescence microscopy. Cells with blue fluorescence only in the nucleus have lost mitochondrial DNA and are considered Rho0.
26
3. Results and Discussion
3.1. Acetic acid protects cells from ethanol-induced cell death in
Saccharomyces cerevisiae
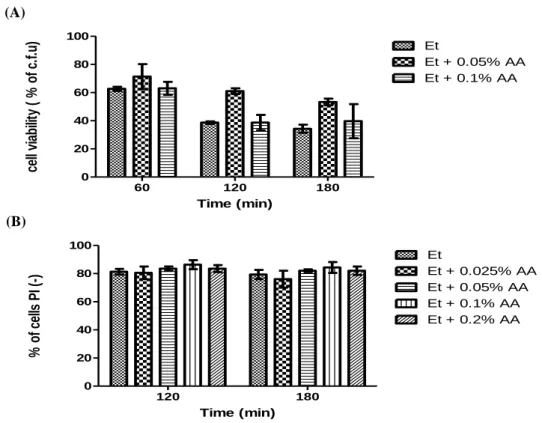
Ethanol is produced by Saccharomyces cerevisiae during alcoholic fermentation. Above a given concentration, it is responsible for a reduction of cell viability and inhibition of fermentation. During fermentation, some weak acids, such as acetic, butyric and pyruvic acids, present in the grape must or produced by yeast metabolism enhance ethanol toxicity and further inhibit growth and fermentation. However, previous data obtained in our lab showed that S. cerevisiae cells treated simultaneously with toxic concentrations of ethanol and low concentrations of acetic acid (0.1%, v/v) displayed higher survival (measured either by CFU or by propidium iodide staining) when compared to cells treated only with ethanol (Trindade, 2009). In this thesis, we aimed to understand how acetic acid protects cells from ethanol-induced death. We confirmed these results by assessing both cell viability by CFU counting and plasma membrane integrity of S. cerevisiae BY4741 cells exposed to 13% (v/v) ethanol and 0.1% (v/v) acetic acid, pH 3.5, for 3 hours (Fig.2). In Figure 2A we observe there was a higher percentage of cell viability in cultures treated with 13% (v/v) ethanol and 0.1% (v/v) acetic acid than in cultures treated only with ethanol. Similar results were obtained by assessing plasma membrane integrity, although this loss was delayed in comparison to the loss of CFUs (Fig. 2B).
27 Time (min) % of c e ll s P I(-) 120 180 0 20 40 60 80 100 Et Et + AA Time(min) c e ll v ia b il it y ( % o f c .f .u ) 60 120 180 0 20 40 60 80 100 Et Et + AA
Fig.2 - Acetic acid protects BY4741 Wt cells from ethanol cytotoxicity. (A) - Graphic representation of cell viability. The values represent the average of 6 independent experiments and the respective standard deviations. The differences between different cultures are statistically significant for time 60 min (P< 0.01) and 120 min (P<0.05). (B) - Graphic representation of the percentage of cells that maintain plasma membrane integrity. The values represent the average of 13 independent experiments and the respective standard deviations. The differences between different cultures are statistically significant for time 120 min (P< 0.05) and 180 min (P<0.01). All experiments were performed in YPD medium at pH 3.5. Cells were incubated with 13% ethanol (Et ) or co-incubated with 13% ethanol and 0.1% acetic acid (Et + AA), for 3 hours.
3.1.1. The protective effect of acetic acid depends on its concentration
The next step was to ascertain whether this protective effect was concentration-dependent and to find which concentration of acetic acid resulted in the highest protection. Experiments with 13% (v/v) ethanol and different concentrations of acetic acid (0.025%, 0.05%, 0.1%, 0.2% and 0.4% (v/v), pH 3.5) were performed by assessing plasma membrane integrity (Fig. 3). Co-incubation of ethanol-treated cells with 0.05% or 0.2% (v/v) of acetic acid for 120 min and 180 min increased the percentage of cells with uncompromised plasma membrane integrity (propidium iodide negative stained cells, PI-). However, these results were not statistically significant. The lower acetic acid concentration tested (0.025%, v/v) had no significant protective effect against loss
(A)
(B)
* **
**
28 of plasma membrane integrity induced by ethanol. After 180 min, the higher acid concentration (0.4%, v/v) enhanced the toxic effect of ethanol, thought after 120 min there was no effect. The results obtained with different concentration of acetic acid suggest the observed protective effect is dose dependent and highest at 0.1% (v/v), and above this concentration the acid enhances ethanol-induced death.
Fig.3 - The protective effect of acetic acid against ethanol stress. Graphic representation of the percentage of BY4741 Wt cells with preserved plasma membrane integrity after exposure to 13% (v/v) ethanol and different concentrations of acetic acid (0.025%, 0.05%, 0.1%, 0.2% and 0.4%) for 3 hours. Experiments were performed in YPD medium at pH 3.5. The values represent the average of 13 independent experiments and respective standard deviations. The differences between cells treated only with ethanol and treated with ethanol and acetic acid are statistically significant only for the concentration 0.1% acetic acid at time 120 min (P< 0.05) and 180 min (P<0.01). Legend: Et – Ethanol ; Et + AA – Ethanol and acetic acid.
3.1.2. The protective effect depends on the undissociated form of acetic acid
All experiments in the previous sections were performed in YPD medium adjusted to pH 3.5. At low pH values, and in glucose repressed cells the undissociated form of the acid predominates and may permeate the plasma membrane by simple diffusion (Casal, et al., 1996; Russell and Gould, 2003). Recently, it has been described that acetic acid may also enter yeast cells by a process of facilitated diffusion, mediated by the aquaglyceroporin Fps1p (Mollapour and Piper, 2007). Once inside the cell the acid may dissociate and disturb the internal pH homeostasis, which has consequences on lipid organization and in the function of cellular membranes. To understand the influence of pH in the protective effect of acetic acid against ethanol stress and its possible dependence on the undissociated form of acetic acid, several experiments were
Time (min) % o f c e ll s P I( -) 120 180 0 20 40 60 80 100 Et Et + 0.025% AA Et + 0.05% AA Et + 0.1% AA Et + 0.2% AA Et + 0.4% AA * **
29 performed by assessing cell viability and plasma membrane integrity at two higher pH values.
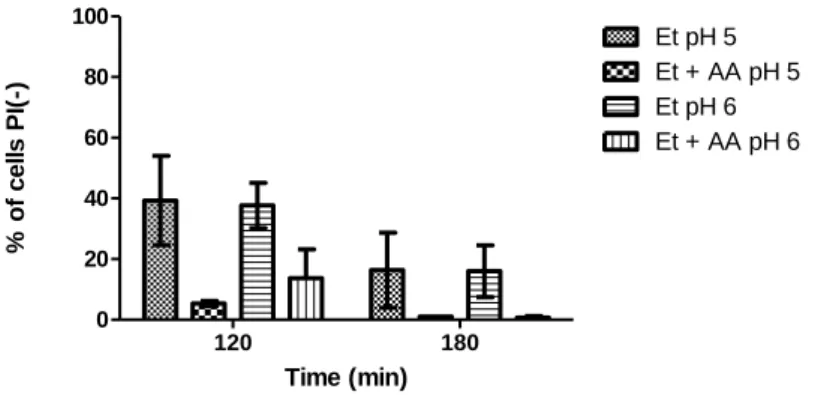
Cell viability of cultures exposed to 13% (v/v) ethanol and 0.1% (v/v) acetic acid in YPD medium, at pH 5.0 and pH 6.0, was higher than that of cultures treated only with ethanol. These differences were particularly evident after 180 min of treatment, although they are not statistically significant (Fig. 4A). Assessment of plasma membrane integrity under the same conditions showed that acetic acid did not protect cells from ethanol toxicity at pH 5.0 and 6.0 (Fig. 4B).
At pH 3.5 acetic acid is mostly in the undissociated form (94.68 %) whereas at pH 5.0 and 6.0 the dissociated form predominates (64.01% and 94.68 %, respectively). The absence of the protective effect at the higher pH values in comparison to pH 3.5 may be due to the much lower concentration of undissociated form of acetic acid. To discard a possible effect of the extracellular pH per se, the total acid concentration should be adjusted so that the cells are exposed to the same concentration of the undissociated form at the three pH values tested.
Overall, for the different incubation medium at both pH 5.0 and 6.0, the percentage of cells with loss of plasma membrane integrity was lower, than that obtained at pH 3.5 (Fig. 2B). As referred above, when the pH is low, proton release upon dissociation of the acid at the higher intracellular pH can promote acidification of the cytosol. If this is the case, metabolic functions (Krebs, et al., 1983) membrane lipid organization and function of cellular membranes are affected. This could explain the higher resistance observed in cells treated with ethanol and acetic acid at pH 5.0 and pH 6.0 than at pH 3.5.
30
Fig. 4 - The protective effect of acetic acid against ethanol in BY4741 Wt cultures. (A) - Graphic representation of cell viability. The values represent the average of 3 independent experiments. (B) - Graphic representation of the percentage of cells that maintain plasma membrane integrity. The values represent the average of 3 independent experiments and the respective standard deviations. All experiments were performed in YPD medium at pH 5.0 and pH 6.0. Cells were incubated with 13% ethanol and co-incubated with 13% ethanol and 0.1% acetic acid, for 3 hours. The acetic acid used was obtained from stock solutions of 1M acetic acid at pH 5.0 and pH 6.0 respectively Legend : Et – Ethanol ; Et + AA – Ethanol and acetic acid
Since loss of plasma membrane integrity after exposure to 13% ethanol at pH 5.0 and pH 6.0 were low, the concentration of ethanol was increased in order to determine if for higher percentages of cell death there were differences between cells treated only with ethanol or with both ethanol and acetic acid at pH 5.0 and pH 6.0.
Cells were exposed to ethanol concentrations of 15%, 16%, 17%, 19% (results not shown) and 21% (v/v), alone or simultaneously with 0.1% (v/v) acetic acid at pH 5.0 and 6.0 (Fig. 5). Significant differences in loss of plasma membrane integrity between cultures treated with ethanol and ethanol and acetic acid were only visible when 21% (v/v) ethanol was used. As expected, loss of plasma membrane integrity was higher in cells exposed to 21% (v/v) ethanol than in cells exposed to 13% (v/v) ethanol. However, cultures treated with 21% (v/v) ethanol and 0.1% (v/v) acetic acid had an even higher loss of membrane integrity, in contrast with the results obtained with co-incubation of acetic acid at pH 3.5. These results are in agreement with the results
Time (min) c e ll v ia b il it y ( % o f c .f .u ) 60 120 180 0 20 40 60 80 100 Et pH5 Et + 0.1 % AA pH5 Et pH6 Et + 0.1% AA pH6 Time(min) % o f c e ll s P I( -) 120 180 0 20 40 60 80 100 Et pH 5 Et + 0.1% AA pH5 Et pH6 Et + 0.1% AA pH6 (A) (B)
31 Time (min) % o f c e ll s P I( -) 120 180 0 20 40 60 80 100 Et pH 5 Et + AA pH 5 Et pH 6 Et + AA pH 6
obtained with 13% (v/v) ethanol at pH 5.0 and 6.0, suggesting that the protective effect of acetic acid against ethanol stress observed at the plasma membrane level depends on the concentration of undissociated form of the acid and may be influenced by the pH.
Fig. 5 - The protective effect of acetic acid against ethanol in BY4741 Wt cultures. Graphic representation of the percentage of cells that maintain plasma membrane integrity. The values represent the average of 3 independent experiments and respective standard deviations. All experiments were performed in YPD medium at pH 5.0 and 6.0. Cells were incubated with 21% (v/v) ethanol or co-incubated with 21% (v/v) ethanol and 0.1% (v/v) acetic acid, for 3 hours. The acetic acid used was obtained from stock solutions of 1M acetic acid at pH 5.0 and pH 6.0, respectively. Legend: Et – Ethanol ; Et + AA – Ethanol and acetic acid
3.1.3. Specificity of the protective effect: the role of other weak carboxylic acids
Another question raised in this work was whether acetic acid specifically protects cells from ethanol stress or if other weak acids had the same effect. Therefore, we tested the effect of different concentrations of other weak carboxylic acids, namely formic, lactic and propionic acids.
Formic Acid
Formic acid is mainly used as a preservative and antibacterial agent in livestock feed and is a major ingredient of antiseptics. In S. cerevisiae, formic acid induces apoptosis and ROS production (Du, et al., 2008).
Wt BY4741 cells were exposed to 13% (v/v) ethanol and different
concentrations of formic acid (0.0125%, 0.025%, 0.05% and 0.1%, v/v), pH 3.5(Fig. 6).
****
32 All concentrations of formic acid used in the experiments promoted a higher loss of plasma membrane integrity in comparison with cultures treated only with ethanol. The higher toxicity was observed even for very low concentrations of formic acid. This indicates that formic acid show this acid does not protect cells from ethanol stress.
Fig. 6 - The protective effect of formic acid against ethanol stress. Graphic representation of the percentage of BY4741 Wt cells with preserved plasma membrane integrity after exposure to 13% (v/v) ethanol and different concentrations of formic acid (0.0125%, 0.025%, 0.05% and 0.1%) for 3 hours. Experiments were performed in YPD medium at pH 3.5. The values represent the average of 3 independent experiments and respective standard deviations. The differences between cells treated only with ethanol and treated with ethanol and formic acid are statistically significant for all concentrations of formic acid at time 120 min and 180 min (P<0.0001). Legend : Et – Ethanol ; Et + FA – Ethanol and formic acid
Lactic Acid
Lactic acid can be produced by microbial fermentation (bacteria’s and yeasts), and has a large number of applications. It is currently considered the most useful chemical in food industry, acting as a preservative, flavouring and acidulant, and in the pharmaceutical, textile and chemical industries (C. Åkerberg, et al., 2000 ; Varadarajan and Miller, 1999).
The possible protective effect of lactic acid against ethanol stress was analyzed by exposing cells to 13% (v/v) ethanol and different concentrations of lactic acid (0.025%, 0.05%, 0.1% and 0.2%, v/v), pH 3.5 (Fig. 7). There was a higher percentage of cells with loss membrane integrity in cultures treated with both lactic acid and ethanol, in comparison with cultures treated only with ethanol. This indicates that lactic acid does not protect cells from ethanol stress.
**** *** Time(min) % o f c e ll s P I( -) 120 180 0 20 40 60 80 100 Et Et + 0.0125% FA Et + 0.025% FA Et + 0.05% FA Et + 0.1% FA **** *** **** **** **** **** *** **** *** **** *** **** ***
33 Time (min) % o f c e ll s P I( -) 120 180 0 20 40 60 80 100 Et Et + 0.025% LA Et + 0.05% LA Et + 0.1% LA Et + 0.2% LA
Fig. 7 - The protective effect of lactic acid against ethanol stress. Graphic representation of the percentage of BY4741 Wt cells with preserved plasma membrane integrity after exposure to 13% (v/v) ethanol and different concentrations of lactic acid (0.025%, 0.05%, 0.1% and 0.2%, v/v) for 3 hours. Experiments were performed in YPD medium at pH 3.5. The values represent the average of 12 independent experiments and respective standard deviations. Legend: Et – Ethanol; Et + LA – Ethanol and latic acid
Propionic Acid
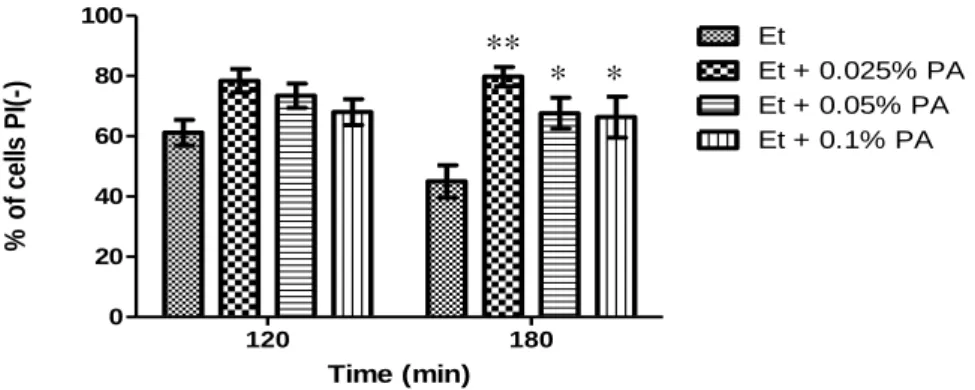
Propionic acid is used as a preservative in bakery and fresh dairy products (Suhr and Nielsen, 2004). Several studies with the yeast S. cerevisiae have been performed in order to understand the mechanisms of tolerance developed in yeast cells exposed to propionic acid. It has been reported that cells exposed to propionic acid alter their cellular content of glutamate, trehalose and glycerol (Lourenço, et al., 2010).
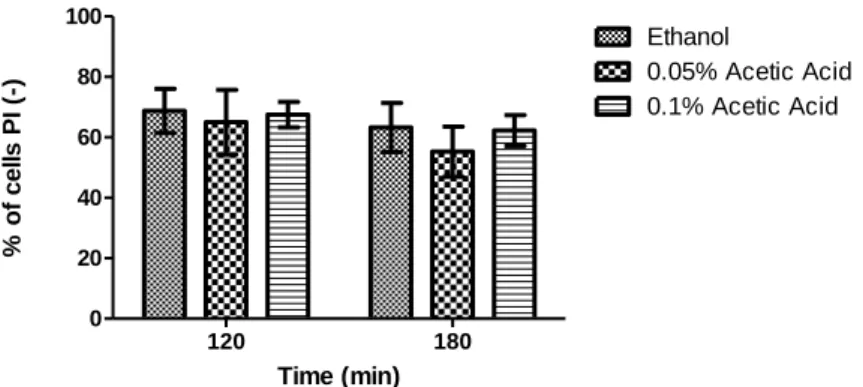
Loss of plasma membrane integrity induced by 13% (v/v) ethanol and different concentrations of propionic acid (0.025%, 0.05% and 0.1%, v/v), pH 3,5, was assessed (Fig. 8). After 120 min, the percentage of cells with loss of membrane integrity was lower in cultures treated with both propionic acid and ethanol than that cultures treated only with ethanol, though the differences were not statistically significant. However, after 180 min, 80% of cells exposed to ethanol and 0.025% (v/v) propionic acid maintained plasma membrane integrity, while only 40% did so in cultures treated only with ethanol (P<0.01). 0.05% and 0.1% (v/v) propionic acid also reduced the percentage of cells with loss of plasma membrane integrity, in comparison with the cultures treated only ethanol, though to a lesser extent (P< 0.05).
The results showed propionic acid protects cells from ethanol stress. However, in contrast with acetic acid, the most significant differences were observed in cultures