M
ASTER IN
FINANCE
M
ASTER
’
S
F
INAL
W
ORK
PROJECT
E
QUITY
R
ESEARCH
:
D
IAGEO
P
LC
A
NDRÉ
M
IGUEL
B
RITO
D
UARTE
M
ASTER IN
FINANCE
M
ASTER
’
S
F
INAL
W
ORK
PROJECT
E
QUITY
R
ESEARCH
:
D
IAGEO
P
LC
A
NDRÉ
M
IGUEL
B
RITO
D
UARTE
SUPERVISOR:
P
ROFESSORA
D
OUTORA
A
NA
I
SABEL
O
RTEGA
V
ENÂNCIO
3
Acknowledgements
Since this project represents the end of one of the most important stages of my life, I would like to express my sincere gratitude, to all the persons that had a relevant role along this journey.
First, to Professor Ana Venâncio for the guidance, time and patience that had for me during the realization of this project.
Second, to my parents and girlfriend, for making all this possible.
And last but not least, to all my friends and colleagues for all the support and guidance given during this journey.
6
Index
Abstract ... 8 Resumo ... 9 Index of Figures ... 10 Index of Tables ... 121. Diageo Plc: The road to premiumisation ... 13
2. Business Description ... 14
Business units ... 14
Key Brands ... 15
Company strategies ... 16
3. Management and Corporate Governance ... 17
Ownership structure ... 17
Corporate Governance ... 17
Company’s key members ... 18
Social Responsibility ... 19
Historical Financial Analysis ... 20
4. Core Countries Outlook ... 23
Global Economic Outlook ... 23
Europe’s Economic Outlook ... 23
North America’s Economic Outlook ... 23
Africa’s Economic Outlook ... 24
Latin America and Caribbean Economic Outlook ... 25
United Kingdom Economic Outlook ... 25
Brexit ... 25
5. Industry Outlook ... 27
Beverage Industry Outlook ... 27
Alcoholic Beverages Industry Outlook ... 28
Peer Group ... 30
Competitive Position ... 31
Porter’s Five Forces ... 31
6. Investment Summary ... 33
7. Valuation ... 34
Valuation Methodology ... 34
Key Valuation Drivers ... 34
Discounted Cash Flow Valuation ... 36
7
Market Multiples Approach ... 37
Financial Statements Forecast Analysis ... 38
8. Investment Risks ... 40
Economic and Market Risks ... 40
Political and Regulatory Risks ... 41
Operational Risks ... 42
Risks to Price Target ... 42
Appendix 1 – Income Statement ... 45
Appendix 2 – Balance Sheet ... 46
Appendix 3 – Common Size Income Statement ... 47
Appendix 4 – Common Size Balance Sheet ... 48
Appendix 5 – Assumptions for Income Statement... 49
Appendix 6 – Assumptions for Balance Sheet ... 50
Appendix 7 – Sales Forecast Assumptions ... 51
Appendix 8 – Net Working Capital ... 52
Appendix 9 – CapEx ... 53
Appendix 10 – Key Financial Ratios ... 54
Appendix 11 – Risk Free Rate ... 55
Appendix 12 – Cost of Debt ... 56
Appendix 13 – Discounted Cash Flow Valuation Method ... 57
Appendix 14 – Peers Selection ... 58
Appendix 15 – Risks to Price Target ... 59
Appendix 16 – Business Units Constitution ... 61
Appendix 17 – Countries by Geographical Area ... 62
Appendix 18 – Key Brands Portfolio Description ... 63
Appendix 19 – Expressions ... 65
9. Abbreviations ... 66
8
Abstract
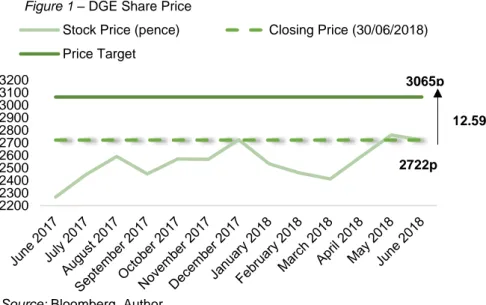
This report contains a detailed estimation and the respective valuation of Diageo’s intrinsic share value for June 2018, according to ISEG’s Master in Finance final work project. This project follows the recommended format by the CFA Institute. Diageo Plc was chosen due to the interest in the alcoholic beverages industry and due to the firm’s good reputation. The price target was computed through an absolute valuation method, more specifically the Flow to Equity (FTE) method. Additionally, a relative valuation method was used, the Comparable Multiples method. A Monte Carlo simulation and sensitivity analysis were also performed in order to complement the analysis. With a price target of £30.65 for June 2018, representing an upside potential of 12.59% from June 30th, 2018, current price of £27.22, our final recommendation for
Diageo Plc is to HOLD, considering the risks that may affect the firm’s performance. Our risk assessment estimates a medium risk for the firm.
Keywords: Diageo; Equity Research; Flow to Equity; Valuation; Discounted Cash Flow method; Relative
9
Resumo
Este relatório contém uma estimação detalhada e respetiva avaliação do valor intrínseco das acções da Diageo, relativamente a junho de 2018, de acordo com o projeto final do Mestrado de Finanças do ISEG. Este projeto segue o formato recomendado pelo Instituto CFA. Diageo foi escolhida devido ao interesse pela indústria das bebidas alcoólicas assim como pela boa reputação da empresa. O preço-alvo foi calculado através de um método de avaliação absoluto, mais especificamente o método do Flow to Equity (FTE). Adicionalmente, foi utilizado um método de avaliação relativo, o método dos Múltiplos Comparáveis. Uma simulação de Monte Carlo e uma análise de sensibilidade foram também realizadas de modo a complementar a análise. Com um preço-alvo de £30.65 para junho de 2018, representando um potencial de valorização de 12.59%, face ao preço atual de £27.22, do dia 30 de junho de 2018, a nossa
recomendação final para a Diageo é MANTER, tendo em conta os riscos que poderão afetar o desempenho da empresa. A nossa avaliação do risco estima um risco médio para a empresa.
Palavras-chave: Diageo; Equity Research; Flow to Equity; Valuation; Discounted Cash Flow method;
10
Index of Figures
Figure 1 – DGE Share Price ... 13
Figure 2 – Diageo’s Logo ... 14
Figure 3 – Grand Metropolitan's Logo ... 14
Figure 4 – Guinness's Logo ... 14
Figure 5 – Proportion of sales by region ... 14
Figure 6 – Johnnie Walker’s Logo ... 15
Figure 7 – Weight of each BU in Total Sales ... 15
Figure 8 – Smirnoff’s Logo ... 15
Figure 9 – Baileys’ Logo ... 15
Figure 10 – Tanqueray’s Logo ... 15
Figure 11 – Captain Morgan’s Logo ... 15
Figure 12 – Guinness Draught’s Logo ... 15
Figure 13 – Dividends per Share ... 17
Figure 14 – Sales Growth by BU ... 20
Figure 15 – Sales per Region ... 20
Figure 16 – EBITDA Bridge FY2017 ... 20
Figure 17 – Historical Total sales, Excise duties, Cost of sales and Gross Profit margin ... 20
Figure 18 – EBITDA Bridge FY2018 ... 21
Figure 19 – Historical Net Working Capital's Growth (£M) ... 21
Figure 20 – Gross Tangible and Intangible Assets and CAPEX (£M) ... 21
Figure 21 – Long-Term Debt and Cash and cash equivalents (£M) ... 22
Figure 22 – DGE’s Capital structure ... 22
Figure 23 – World’s GDP Growth and Inflation Rate ... 23
Figure 24 – Europe’s GDP Growth and Inflation Rate ... 23
Figure 25 – North America’s GDP Growth and Inflation Rate... 23
Figure 26 – Africa’s GDP Growth and Inflation Rate ... 24
Figure 27 – Africa’s Population (M) ... 24
Figure 28 – Asia Pacific’s GDP Growth and Inflation Rate ... 24
Figure 29 – Asia Pacific’s Population (M)... 24
Figure 30 – Latin America and Caribbean’s GDP Growth and Inflation ... 25
Figure 31 – United Kingdom’s GDP Growth and Inflation Rate ... 25
Figure 32 – Negative impact of Brexit voting on Stock Exchanges ... 25
Figure 33 – Number of companies reallocated after Brexit, by country of allocation ... 26
Figure 34 – Monthly Exchange Rate EUR/GBP ... 26
Figure 35 – Global beverage market volume growth from 2010 to 2018 (%) ... 27
Figure 36 – Leading beverage companies worldwide in 2018, based on net sales (in million U.S. dollars) . 27 Figure 37 – Share of consumption of packed beverages worldwide in 2018, by beverage type (%) ... 27
Figure 38 – Share of Alcoholic Beverages by Type in 2018 (%) ... 28
Figure 39 – Leading Alcohol Consumption by Country in 2018 (billion liters) ... 28
Figure 40 – Worldwide share of Spirits from 2006 to 2014 (%) ... 28
Figure 41 – Beer production worldwide from 1998 to 2016 (in billion hectoliters) ... 29
Figure 42 – Wine production worldwide from 2010 to 2018 (in million hectoliters) ... 29
Figure 43 – Wine consumption worldwide from 2010 to 2018 (in million hectoliters) ... 29
Figure 44 – Share of Alcoholic Beverages by Type in the UK in 2018 (%) ... 29
11
Figure 46 – Porter’s Five Forces ... 31
Figure 47 – Proportion of Sales by region, in 2018 (%) ... 33
Figure 48 – Monte Carlo Price Distribution ... 33
Figure 49 – Forecasted Total Sales (£M) ... 34
Figure 50 – Historical average sales proportion per region ... 34
Figure 51 – Net Working Capital, 2014-2018 ... 35
Figure 52 – CapEx, 2014-2018 (% of Sales) ... 35
Figure 53 – Operating expense proportion over sales ... 35
Figure 54 – Effective Tax Rate ... 37
Figure 55 – EBITDA, EBIT and Net Income Margins (%) ... 38
Figure 56 – ROA and ROE (%) ... 39
Figure 57 – Interest Coverage Ratio ... 39
Figure 58 – Net Debt to EBITDA Ratio (years) ... 39
Figure 59 – Risk Matrix ... 41
12
Index of Tables
Table 1 – Risk Assessment ... 13
Table 2 – Investment Grade and Risk Classification Matrix ... 13
Table 3 – Market Profile ... 13
Table 4 – Valuation Output ... 13
Table 5 – Financial Highlights (£M) ... 13
Table 6 – Shareholder Structure ... 17
Table 7 – Dividend Distributions ... 17
Table 8 – Key Management Compensation ... 18
Table 9 – Gender diversity ... 19
Table 10 – Environmental Indicators ... 19
Table 11 – Sales per Region ... 20
Table 12 – Debt Structure (£M) ... 21
Table 13 – Historical Net Debt (£M) ... 22
Table 14 – SWOT Analysis ... 31
Table 15 – Valuation Summary ... 33
Table 16 – Total Sales Growth per growth variable (all regions) ... 35
Table 17 – Net Working Capital, 2014-2018 (% of Sales) ... 35
Table 18 – CAPEX (£M) ... 35
Table 19 – DCF Output... 36
Table 20 – UK Bond details ... 36
Table 21 – Free Cash Flow Calculation (£M) ... 36
Table 22 – Risk Free Rate ... 36
Table 23 – Historical Beta ... 36
Table 24 – Bottom-up Beta ... 36
Table 25 – Cost of Debt ... 37
Table 26 – Equity Risk Premium ... 37
Table 27 – Cost of Equity ... 37
Table 28 – PER Multiple ... 37
Table 29 – Peers Multiples 2018F ... 37
Table 30 – Forecasted sales per region (£M) ... 38
Table 31 – Effects of changes in Terminal Growth (g) and Cost of Equity (Re) ... 43
Table 32 – Effects of changes in Effective Tax Rate and Cost of Sales/Sales proportion ... 43
Table 33 – Monte Carlo Statistics ... 44
13 12.59% 2200 2300 2400 2500 2600 2700 2800 2900 3000 3100 3200
Stock Price (pence) Closing Price (30/06/2018) Price Target
1. Diageo Plc: The road to premiumisation
(YE2018 Price Target of £30.65; 12.59% Upside Potential; Medium Risk;
Final Recommendation: HOLD).
Diageo Plc (DGE) is a British company, listed in the London Stock Exchange, whose core business is the production, distribution and commercialization of alcoholic beverages. The company is organized into four business units (BU’s): spirits, beer, wine and ready to drink beverages.
Our recommendation for DGE, based on our risk assessment (Table 1), and using the Discounted Cash Flow method, stands for HOLD, with a price target of £30.65 at mid-2018, and an upside potential of
12.59%, in comparison with the closing price of £27.22 on June 30th,
2018 (Figure 1).
According to our relative valuation through market multiples (Table 4), our HOLD recommendation is not supported, since we reached a price target of £27.54, representing an upside potential of 1.19%. However, we do not consider this to be an appropriate method to compute the company’s price target.
In terms of risk assessment, we concluded that DGE has a medium
risk of investment (Table 2), since the company faces large competition
within the alcoholic beverages industry.
We expect that DGE’s total sales grow in the upcoming years (Table 5), from £19,781 million in 2018 to £24,389 million in 2022F. Moreover, we do not forecast any decrease in the firm’s profitability, expecting the EBITDA to increase from £5,318 million in 2018 to £7,669 million in 2022F (Table 5). Low Risk Medium Risk High Risk Buy >15% >20% >30% Hold >5% and <15% >10% and <20% >15% and <30% Reduce >-10% and <5% >-10% and <10% >-10% and <15% Sell <-10% <-10% <-10% Years 2016 2017 2018 2019 2020 2021 2022 Sales 15641 18114 18432 19781 21244 22764 24389 Gross profit 6234 7370 7529 9293 10354 11457 12636 EBITDA 3322 3920 4184 5318 6064 6839 7669 Net Income 2362 2772 3144 4261 4915 5593 6320 Market Profile
Ticker Bloomberg DGE:LN Shares outstanding (M) 2,695 Previous close price (p) 2,736 Open price (p) 2,747 Close price (p) 2,722 52-wk High (p) 2,817.5 52-wk Low (p) 2,234 Market capitalization (£M) 73,375.9 Valuation Method Price Target Upside/Downside Potential DCF £ 30.65 12.59% Multiples £ 27.54 1.19%
Diageo Plc
Hold
Medium Risk
October 2019
United Kingdom
Source: AuthorSource: BPI Rating Scheme
Source: Bloomberg, Author
Source: Company data, Author
3065p
2722p
Source: Company data, Author Source: Bloomberg, Author
Table 1 – Risk Assessment
Table 2 – Investment Grade and Risk
Classification Matrix
Table 4 – Valuation Output
Table 5 – Financial Highlights (£M)
Table 3 – Market Profile
14 0% 10% 20% 30% 40% North America Europe and Turkey Africa
Latin America and Caribbean Asia Pacific
2. Business Description
Diageo plc (DGE) is a British alcoholic beverages enterprise, listed on
the London Stock Exchange (LSE). Its main business is the production, distribution and commercialization of spirits, beer, wine and ready to drink beverages. DGE was born on 1997, as the product of a merger between Grand Metropolitan plc and Guinness plc, two of the largest distillers in the world. This merger was the fifth largest merger ever at that time. DGE comprises about 30.000 employees in over than 180 countries. It operates in several regions across the world such as North America, Latin America and the Caribbean, Africa, Asia Pacific and Europe and Turkey, where its more than fifty brands are available.
Grand Metropolitan plc (GM) was an international conglomerate
specialised in leisure, manufacturing and property. It was founded in 1934 and operated on the hotel business under the name of MRMA Ltd (Mount Royal Metropolitan Association). The company diversified its portfolio throughout the years by acquiring several catering businesses in the 1960s, as well as some food chains and bingo halls. In the 1970s, the company entered in the brewing industry by merging with Truman, Hanbury & Buxton and Watney Mann.
Guinness plc (GUI) was founded in 1759 in Dublin, Ireland. It is still one
of the largest stout brewers in the world. Its main product is the Guinness Draught, a dark Irish dry stout. GUI is well known for their innovative method of using nitrogen on their pouring process. Due to some controversy during the 1997 merger, GUI was set to be a separate entity within DGE.
Business units
DGE operates in the alcoholic beverage industry, counting with a diversified spectrum of products sold across several regions: Europe and Turkey, North America, Latin America and Caribbean, Africa and Asia Pacific.
Historically, the proportion of sales per region has been higher in North America, accounting for more than 30% of the company’s total sales. There have been some changes within the years, more specifically on Africa and Asia Pacific’s sales. These registered an 8% decrease and 8% increase, respectively. Europe and Turkey are the second largest region, representing 24% of DGE’s total sales (Figure 5). The sales proportion of Latin America and Caribbean region has historically been the smallest, registering around 10% of the company’s sales.
The company’s portfolio can be divided into four business units (BU’s):
spirits, beer, wine and ready to drink. Historically, the largest
business unit in terms of sales has been the spirits, accounting for an average 67% of DGE’s sales (Figure 6). The proportion of sales across BU’s has remained stable on the past 5 years. Beer is the second largest BU accounting for 17% of the sales. Wine and ready to drink only account for around 16% of the company’s sales.
Source: Company data, Author
Source: Company data, Author
Source: Company data, Author
Source: Company data, Author
Figure 3 – Grand Metropolitan's Logo
Figure 2 – Diageo’s Logo
Figure 4 – Guinness's Logo
15 66% 66% 66% 68% 69% 18% 18% 18% 16% 16% 11%5% 11%5% 10%6% 10%6% 9%6% 0% 20% 40% 60% 80% 100% 2014 2015 2016 2017 2018
Spirits Beer Wine Ready to drink
Source: Company data, Author
Figure 7 – Weight of each BU in Total Sales
Key Brands
Johnnie Walker (JW): established in 1867 with its current name, JW
was born in the small town of Kilmarnock, Scotland. It quickly became popular due to its innovative way of production, where John Walker blended several whiskies to ensure continuous quality and flavour. At the time only single malts were commercialized but their quality was volatile to weather and crops conditions, giving JW a competitive
advantage that turned out to be critical. With the help of the recently built British railways, and the engagement of ships’ captains as its agents, before long JW unique blend was made available around the world.
Smirnoff (SMI): founded in 1864 by Pyotr Smirnov, was one of the first
vodka distilleries in Moscow pioneering charcoal filtration. Due to the October Revolution, the brand had to re-established in other locations such as Istanbul, Lviv and Paris. SMI was a very popular vodka within the Soviet Forces.
Baileys Irish Cream (BIC): it was introduced in the market in 1974, as
the first Irish cream ever sold. Created by a small division of a larger distiller, BIC is known for its singularity and innovation of flavours, by blending two Irish ingredients: dairy cream and whisky.
Tanqueray (TAQ): was first distilled by Charles Tanqueray in 1830, in
the region of Bloomsbury, London. Labelled as a London Dry gin due to its distillation process, composed by a double distillation of grain and the addition of 4 key botanicals: angelica root, liquorice, coriander and juniper. TAQ became in 2016 the world’s highest selling gin.
Captain Morgan (CM): created by the Seagram Company in 1944
under the name of Captain Morgan Rum Company, the rum brand started to grow on the Commonwealth territory established between the US and Puerto Rico in the 1950s, where tax benefits were given to local producers. CM distinguishes itself due to the Caribbean flavours and spices added in the final stage of the distillation process.
Guinness (GNS): created by Arthur Guinness (AG) in 1759, its origin
can be traced back to the signing of a 9000 years lease on St. James’ Brewery, in Dublin. In a time where black (stout) beers were non existing, AG took a leap of faith into brewing and distributing its beer all around the world. GNS is also known for being the first brewer ever employing scientists to help on the production process.
Source: Company data, Author
Source: Company data, Author
Source: Company data, Author
Source: Company data, Author
Source: Company data, Author Source: Company data, Author
Figure 6 – Johnnie Walker’s Logo
Figure 8 – Smirnoff’s Logo
Figure 9 – Baileys’ Logo
Figure 10 – Tanqueray’s Logo
Figure 11 – Captain Morgan’s Logo
16
Company strategies
Geographical diversification: DGE is currently making a large effort
into exploring new markets, more specifically emergent markets. The firm has already made quite reasonable investments in order to establish itself, being now present in 16 African countries. Moreover, DGE own 21 facilities across the continent, aiming to satisfy the customers’ needs. Focus is to participate in mainstream spirits so customers can access the firm’s products at affordable prices. Long term strategy will be to unify the develop and emerging markets strategy, by focus on growing its participation in premium spirits.
Premiumisation support: DGE is aiming to bet on premium/reserve
products, mainly on developed markets. This is where consumers are willing and able to trade up into these luxury categories. The firm’s strategy is to build these brand’s reputation with the bartenders and consumers who set trends.
Build an advantaged route to consumer: As consumers are the key
player on the DGE’s success, the company will invest as many
resources as possible, so their brands are constantly present within the market.
Vertical integration: DGE intends to take considerable control of its
supply chain, directly participating in seeding, brewing, distilling, bottling, packaging, distributing and marketing. The firm already owns facilities to develop the above activities. Additionally, DGE plans to be able to also participate in activities such as malting, maturation and bottle
manufacturing. This is possible in emerging markets whereas in some developed countries like the US, supply chain is regulated and subject to bounding laws.
Innovation on specific markets: In order to retain its clients, mainly the
younger ones, DGE bets on innovation in what regards its brands portfolio. For example, the launching of Gordon’s Pink in Iberia, denotes that the company is pushing to constantly have entirely new products capable of appealing their consumers. Another example would be the launch of Johnnie Walker My Edition, designed to offer its clients a brand new online whisky personalization experience.
17 51,21 56,08 58,05 61,10 58,66 46 48 50 52 54 56 58 60 62 2014 2015 2016 2017 2018
3. Management and Corporate Governance
Ownership structure
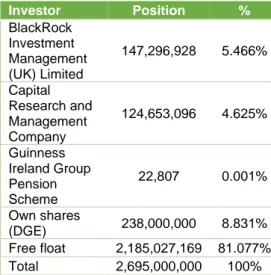
At 30/06/2018, DGE had a share capital of £780 million represented on 2,695 million outstanding shares (Table 6). Own shares were composed by 4 million ordinary shares held by employee post-employment share trusts, 222 million of repurchased ordinary shares held as treasury shares and 12 million ordinary shares held for hedging share scheme grants. In total, DGE held 238 million of its own shares, representing around 9% of the total outstanding. At June 2018, the company purchased 58 million ordinary shares through a share buyback programme. These shares were automatically eliminated.
The company has only two holders with an interest of 3% or more. These are BlackRock Investment Management (UK) Limited with nearly 6% of the ordinary shares, and Capital Research and
Management Company with 5%. These are however indirect holdings.
Apart from these holders, it is known that the Guinness Ireland Group
Pension Scheme holds 22,807 ordinary shares of the company. Free
float represents then 81% of the firm’s total shares.
It is possible that at the end of the fiscal year ending in June 2019 DGE will launch another share buyback programme although it hasn’t been approved by the relevant committee within the firm.
Dividend distribution amounts have historically been increasing until 2018, where a £101 million decrease was registered (Table 7). This reduction was due to the purchase done under the share buyback programme, which affected the firm’s retained earnings for the year. The company spent £1,507 million on this programme.
Despite the decrease on the total shares outstanding, dividends per share also registered a reduction in 2018. These were also affected by the firm’s share programme (Figure 13).
Dividend Distribution 2014 2015 2016 2017 2018
Dividends (£million) 1413 1544 1598 1682 1581 Shares outstanding
(million) 2759 2753 2753 2753 2695
Corporate Governance
DGE corporate governance system takes form in a Latin Model (or
Unitary system), generally composed by a Board of Directors and an
Audit Committee. The firm’s corporate governance system also includes an Executive Committee, a Remuneration Committee, a Nomination Committee and an External Statutory Auditor.
Investor Position % BlackRock Investment Management (UK) Limited 147,296,928 5.466% Capital Research and Management Company 124,653,096 4.625% Guinness Ireland Group Pension Scheme 22,807 0.001% Own shares (DGE) 238,000,000 8.831% Free float 2,185,027,169 81.077% Total 2,695,000,000 100%
Source: Company data, Author
Source: Company data, Author
Source: Company data, Author
Table 6 – Shareholder Structure
Table 7 – Dividend Distributions
18
The Board of Directors is constituted by eleven members (eight non-executive). The non-executive members are Javier Ferrán (the
Chairman), Peggy B Bruzelius, Nicola S Mendelsohn, Ho KwonPing, Ala JH Stewart, Betsy D Holsen, Lord Davies of Abersoch and Susan
Kilsby. The executive members are Ivan Menezes (Chief Executive), Kathryn Mikells and David Harlock. They manage overall control of the firm’s affairs.
The Audit Committee is composed by six members. It is chaired by Alan Stewart and its remaining members are Lord Davies of Abersoch, Debra Crew, Ho KwonPing, Susan Kilsby and Nicola S Mendelsohn. Their duties are mainly to supervise the functioning of the company. The Executive Committee is composed by 13 members: David Cutter, John Kennedy, Siobhan Moriarty, Sam Fischer, Anand Kripalu, Mairéad Nayager, Victoria Frame, Deirdre Mahlan, John O’Keeffe, Brian Franz, Alberto Gavazzi, Daniel Mobley and Syl Saller. They are responsible for the current management of the company.
The Remuneration Committee is composed by six members: Lord Davies of Abersoch (Chairman of the committee), Debra Crew, Ho KwonPing, Nicola S Mendelsohn, Susan Kilsby and Alan Stewart. Its duty is to decide on the corporate members remuneration.
The Nomination Committee is constituted by seven members: Javier Ferrán, Lord Davies of Abersoch, Debra Crew, Ho KwonPing, Susan Kilsby and Nicola S Mendelsohn. This committee is responsible for deciding the composition of the board and its succession.
The External Statutory Auditor, upon the Board decision in 2015, is PwC (PricewaterhouseCoopers) which was appointed as auditor of the company. Its current audit partner is Ian Chambers.
Company’s key members
Javier Ferrán is the current Chairman of the Board of Directors. He was the former President and CEO of Bacardi Limited. He graduated from the University of Barcelona and was granted an MBA from ESADE, in Barcelona.
Ivan Menezes serves as Chief Executive Officer. He is the former COO of the company. He was educated at the Northwestern University's Kellogg School of Management.
Alan Stewart chairs the Audit Committee. He is also the Director and CFO for Tesco Plc. He received his undergraduate and master’s degree from the University of Cape Town.
Lord Davies of Abersoch is the Chairman of the Remuneration
Committee. He is the former CEO and Chairman of Standard Chartered Plc. He was educated at Rydal Penrhos in North Wales.
Compensation
'000£ 2017 2018
Base Salary 2,621 2,674
Source: Company data, Author
19
Social Responsibility
Nowadays, sustainability takes a very important role on a company’s strategy. Whether due to reputational matters or to self-awareness, social responsibility is one the major concerns of large firms operating on the alcoholic beverages industry. DGE is of course inserted in these group of concerned firms aiming for a sustainable growth. Thus, DGE has defined three pillars: creating a positive role for alcohol in society, building thriving communities and reducing its environmental impact.
Creating a positive role for alcohol in society:
Introducing the concept of “drink better, not more”, DGE has taken several actions in order to reduce harmful drinking, promote moderation and improve laws and industry standards. Through their “#JoinThePact” programme, the company has raised awareness to millions of people, developing partnerships with police and local authorities. Additionally, a theatre-based programme called “Smashed” was launched in order to address underage drinking, by reaching millions of school children in the UK. DGE also cooperates with governments and regulators aiming to improve standards and combat illicit alcohol.
Building thriving communities:
DGE keeps on promoting diversity and inclusion, by hiring capable people, irrespective of their gender, race, religion, disability, age or sexual orientation (Table 9). This policy has blossomed already, with DGE being first in the FTSE 100 for female executive directors in the Female FTSE Board Report for 2018. More than that, health and safety has been a major concern, leading the company to create their “Zero Harm” programme, to ensure all people go home safe every day.
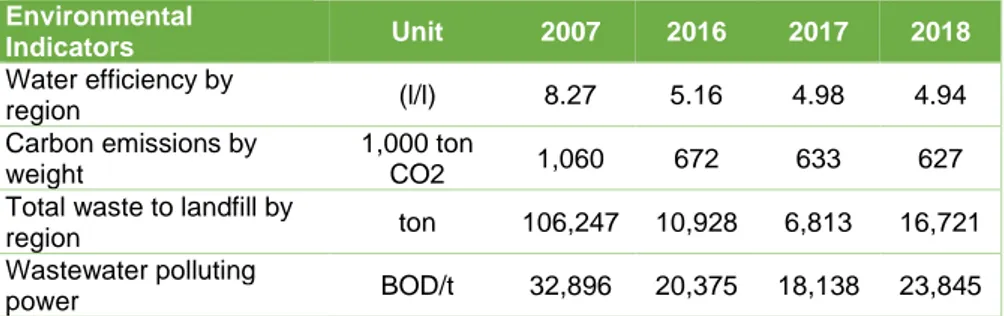
Reducing its environmental impact:
Being faced with the risks of climate change, water scarcity, soil degradation and the loss of biodiversity, DGE has taken steps in order to avoid these environmental impacts such as commit to procuring 100% of their electricity from renewable sources by 2030. Another commitment was to address the impact of the usage of plastic, aiming for a target of only using recyclable plastic by 2025. Water consumption has also been identified as a critical point, leading the company to establish partnerships with local authorities and a German development agency (GIZ). Their goal is to provide safe water and support
responsible management of the water catchment (Table 10).
Nº of employees by
gender Men Women
Senior manager 66.33% 33.67% Line manager 69.23% 30.77% Supervised employee 67.81% 32.19% Environmental Indicators Unit 2007 2016 2017 2018 Water efficiency by region (l/l) 8.27 5.16 4.98 4.94 Carbon emissions by weight 1,000 ton CO2 1,060 672 633 627 Total waste to landfill by
region ton 106,247 10,928 6,813 16,721 Wastewater polluting
power BOD/t 32,896 20,375 18,138 23,845
Source: Company data, Author
Source: Company data, Author
Table 9 – Gender diversity
20 -15% -10% -5% 0% 5% 10% 15% 20% 2015 2016 2017 2018 Spirits Beer
Wine Ready to drink
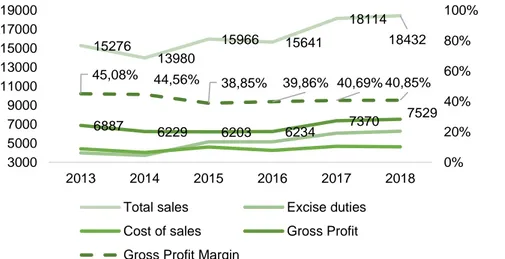
3920 361 2013 1798 4680 6064 18114 EBITDA Dep. & Amort. Other operating expenses Marketing Cost of sales Excise duties Sales 15276 13980 15966 15641 18114 18432 6887 6229 6203 6234 7370 7529 45,08% 44,56% 38,85% 39,86% 40,69% 40,85% 0% 20% 40% 60% 80% 100% 3000 5000 7000 9000 11000 13000 15000 17000 19000 2013 2014 2015 2016 2017 2018 Total sales Excise duties Cost of sales Gross Profit Gross Profit Margin
0 5000 10000 15000 20000 2014 2015 2016 2017 2018 Asia Pacific
Latin America and Caribbean Africa
Europe and Turkey North America
Historical Financial Analysis
DGE’s historical data was analysed for the period between 2014 and 2018.
Beginning with total sales (Appendix 7), there has been some historical volatility in sales growth. 2014 and 2016 registered a decrease in total sales (8.48% and 2.04%, respectively) however the average increase for the relevant period was 4.25%. This reduction can be explained by the decline in RTDs sales in South Africa and the weaker performance of J&B and Bell’s. DGE’s sales went from £13,980 million in 2014 to £18,432 million in 2018, representing a total growth of 31.85%. There have been some changes on the sales per BU throughout the years (Figure 14), having as major changes the 19.32% increase in Spirits in 2017 and the 10.94% decrease in Wine in 2016.
In terms of geographical area, 2015 registered a major decrease in Africa’s sales (28.21%) but this was partially offset at the same period with an impressive 80.97% increase on Asia’s sales (Table 11).
Whilst Sales had a positive movement during this period, the gross
profit margin suffered an 8.32% decrease during these four years,
mainly explained by a major increase on excise duties to be paid (from £3,722 to £5,153 million in 2015). These excise duties arise from a production tax incurred at manufacturing, applied worldwide to all producers of alcoholic beverages (Figure 16).
Sales per Region 2014 2015 2016 2017 2018
North America 4,753.20 5,141.05 5,333.58 6,285.56 6,266.88 Europe and Turkey 2,935.80 3,895.70 3,800.76 4,238.68 4,460.54 Africa 2,935.80 2,107.51 2,095.89 2,354.82 2,267.14 Latin America and
Caribbean 1,537.80 1,532.74 1,298.20 1,575.92 1,622.02 Asia Pacific 1,817.40 3,289.00 3,112.56 3,659.03 3,815.42
Source: Company data, Author
Source: Company data, Author
Source: Company data, Author
Source: Company data, Author Source: Company data, Author
Table 11 – Sales per Region
Figure 14 – Sales Growth by BU
Figure 15 – Sales per Region
Figure 17 – Historical Total sales, Excise duties, Cost of sales and Gross Profit margin
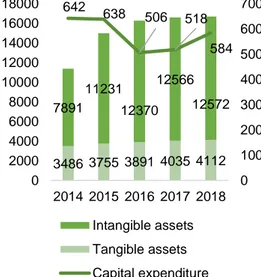
21 4184 493 1956 1882 4634 6269 18432 EBITDA Dep. & Amort. Other operating expenses Marketing Cost of sales Excise duties Sales 3486 3755 3891 4035 4112 7891 11231 12370 12566 12572 642 638 506 518 584 0 100 200 300 400 500 600 700 0 2000 4000 6000 8000 10000 12000 14000 16000 18000 2014 2015 2016 2017 2018 Intangible assets Tangible assets Capital expenditure
Source: Company data, Author
Operating expenses have grown along the years due to the increase in
volume of the company (around 9%). Marketing expenses represent a large part of this increase, as expected in this industry (Figure 16). Regarding the firm’s EBITDA, after some small decreases in 2014 and 2015, it has been increasing fast reaching a very strong growth rate in 2017 (18%). This sudden increase was due to the low amounts of depreciation and amortisation recognized by the firm on that year. Historically, it has shown an overall increase of 25.42% through the last four fiscal years.
DGE’s net working capital has been decreasing, having as the most significant reduction in 2015 (13.62%). This decrease can mainly be explained by the decrease of the firm’s investments in associates and joint ventures, moving from £3,201 million in 2014 to £2,076 million in 2015 (Figure 19). However, this decrease was partially offset by an increase on the company’s inventories.
The firm’s tangible assets, composed by the firm’s buildings, hardware, machinery and other equipment, have presented a slight increase throughout the years (17.96% from 2014 to 2018). This movement was in line with the sales growth. No strong investment was done during the last four years.
The firm’s intangible assets, composed by the fair value of the DGE’s several brands, have been showing a fast increase, going from £7,891 million in 2014 to £12,572 million in 2018, representing a 59.32% increase. No significant amount of CapEx was invested here, being this increase the product of the brand’s growing intrinsic value.
Capital Expenditure has been reducing throughout these years,
reinforcing the company’s goal of maintenance and substitution of the company’s fixed assets (9% decrease on the four-year period). Of course, CapEx is still higher than the asset’s depreciations and amortizations, in line with the firm’s sales increase (Figure 20). In what regards Net Debt, there has been some volatility during this period, without showing a clear trend. Nevertheless, there was a large decrease in 2017 (from £12,119 million in 2016 to £10,864 million in 2017). This is mainly explained by the significant drop on the firm’s long-term debt, showing a reduction of £1,860 million between these two years (Table 13).
Regarding DGE’s capital structure, it is mainly financed by Equity rather than Debt (Figure 22). Debt only represents around 13% of the
company’s structure, where Equity accounts for the remaining 87%.
Debt Structure 2014 2015 2016 2017 2018
Short Term Debt 1793 2053 2180 2887 2177 Long Term Debt 9429 10034 11028 9168 9906
Source: Company data, Author
Source: Company data, Author
Source: Company data, Author
Table 12 – Debt Structure (£M)
Figure 18 – EBITDA Bridge FY2018
Figure 19 – Historical Net Working
Capital's Growth (£M)
Figure 20 – Gross Tangible and Intangible
Assets and CAPEX (£M) 3549 3700 3479 3436 3183 2900 3000 3100 3200 3300 3400 3500 3600 3700 3800 2014 2015 2016 2017 2018
22 8085 8360 8571 6966 8286 622 472 10891191 874 0 2000 4000 6000 8000 10000 2014 2015 2016 2017 2018 Long-Term Debt
Cash and cash equivalents
Source: Company data, Author
13,25%
86,75%
Debt Equity Concerning dividends, DGE’s distribution has been quite constant
throughout the last 4 years. The lowest amount paid within this period were the £1,413 million distributed in 2014, whereas the largest distribution was done on 2017, with the payment of £1,682 million (Figure 22). Although, we cannot affirm that DGE has a strict dividend payment policy. The amounts made available to shareholders are highly dependent on the company’s performance.
Net Debt 2014 2015 2016 2017 2018
Borrowings and bank overdrafts 1576 1921 2058 2459 1828 Long-term borrowings 7638 7917 8071 6583 8074 Other net financial liabilities 225 261 -135 250 225 Net corporate tax payable 197 162 340 294 178 Net liabilities held for sale -8 -140 -3 0 -24 Net deferred liabilities 1119 1707 1684 1978 1865 Net post-employment benefit
liabilities 475 259 1193 491 -63 Cash and cash equivalents 622 472 1089 1191 874
Total Net Debt 10600 11615 12119 10864 11209
Source: Company data, Author
Source: Company data, Author
Table 13 – Historical Net Debt (£M) Figure 21 – Long-Term Debt and Cash and
cash equivalents (£M)
23 0,00% 0,50% 1,00% 1,50% 2,00% 2,50% 3,00% 3,50% 4,00%
GDP growth Inflation growth
0,00% 0,50% 1,00% 1,50% 2,00% 2,50% 3,00% 3,50% 2 0 1 4 2 0 1 5 2 0 1 6 2 0 1 7 2 0 1 8 2 0 1 9 F 2 0 2 0 F 2 0 2 1 F 2 0 2 2 F GDP Growth Inflation growth 0,00% 0,50% 1,00% 1,50% 2,00% 2,50% 3,00% 20 14 2 0 1 5 2 0 1 6 2 0 1 7 2 0 1 8 2 0 1 9 F 2 0 2 0 F 2 0 2 1 F 2 0 2 2 F GDP Growth Inflation growth
4. Core Countries Outlook
Global Economic Outlook
DGE intends to keep its international business, which is now present all around the world. The focus is the African region, where the company has recently established itself.
In the last years (2014-2018), the World GDP growth has maintained a stable level, remaining at 3.6%, after a 0.2% drop in 2015 and 2016. According to the International Monetary Fund (IMF), the GDP growth is expected to remain at the same levels until 2022, after a drop of 0.3% in 2019 (Figure 23).
In what regards the World Inflation rate, it appears to follow the GDP’s trend. After a significant decrease in 2015 and 2016 of 0.4%, and an increase in 2017 of 0.4%, the inflation rate went back to its 2014 level of 3.6%. IMF forecasts this indicator to remain stable in the next 2 years, showing 0.1% decrease upon 2021.
These macroeconomic indicators can be a key factor for the company. Assuming the unemployment rate will move in an opposite direction, there will be an increase in the consumer’s purchasing power around the world.
Europe’s Economic Outlook
European economic growth is expected to continue, yet at a slower pace. Following a drop in the Inflation rate, from 3% to 1.5% in 2015 and 2016 respectively, this indicator as stabilized and is expected to remain stable (2.2%), a close value to what the ECB planned for the upcoming years (2%) (Figure 24). This sudden drop can be mainly explained by the deflation in oil and gas prices.
According to the IMF, Europe’s GDP Growth will slow down in the next years, stabilizing at around 1.7% YoY. Despite the recovery in
employment and the increasing consumer spending, the GDP Growth will decrease after reaching 2.5% in 2017.
North America’s Economic Outlook
North America’s economy has historically been one of the strongest economies in the world. However, the financial crisis in 2008 damaged numerous sectors, leading to higher unemployment rates and a slight decrease in private consumption. Nonetheless, the economy has been slowly recovering.
According to the IMF, GDP growth reached 2.7% and is expected to maintain levels between 1% and 2%. IMF forecasts it to be at 1.7% in 2022 (Figure 25). Regarding the inflation rate growth, it has been increasing following a drop in 2015, reaching 2.7% in 2018. It is expected to maintain levels above 2% in the following years.
Source: IMF, World Economic
Database, Author
Source: IMF, World Economic
Database, Author
Source: IMF, World Economic
Database, Author
Figure 23 – World’s GDP Growth and
Inflation Rate
Figure 24 – Europe’s GDP Growth and
Inflation Rate
Figure 25 – North America’s GDP Growth
24 0% 2% 4% 6% 8% 10% 12% 14% GDP Growth Inflation growth 1120 1150 1180 1210 1240 1270 1300 1330 1360 0 200 400 600 800 1000 1200 1400 1600 2014 2015 2016 2017 2018 2019F 2020F 2021F 2022F 0% 1% 2% 3% 4% 5% 6% 7% GDP Growth Inflation growth 4090 4130 4180 4220 4260 4300 4330 4370 4410 3900 4000 4100 4200 4300 4400 4500 2014 2015 2016 2017 2018 2019F 2020F 2021F 2022F
Africa’s Economic Outlook
Africa is a region where the economy has historically not been as developed as in rest of the world, mainly due to political instability. It is important to denote that the economies of African countries are very different amongst them. There are already a few developed economies (South Africa) whereas the majority are still maturing (Angola, Congo, Ethiopia, etc). There is a long path for Africa to turn itself into a developed region. Economic indicators expect Africa to perform very well, reaching GDP growths YoY of around 4%, the highest across all regions in the world (Figure 26). Moreover, Inflation rate growth is forecasted to slowly decrease in the upcoming years and bring some stability to these emerging markets.
Another key factor of the African region is the large increase on the population. It represents the second highest growth in the world, reaching a 30 million people growth YoY (Figure 27).
Asia Pacific’s Economic Outlook
Asia Pacific’s has also been showing an instable political outlook, specifically in countries like North Korea and China. Nevertheless, its economies are growing at a fast pace, with Asia’s GDP growth reaching 5.8% in 2017. These are expected to remain between 5% and 6% in the upcoming years. According to the IMF, the Inflation rate growth is expected to slowly increase, reaching a YoY value of 3.4% in 2022. In what regards population growth, Asia Pacific is the region registering the highest increase, across all regions in the world. The IMF expects this region to reach the 4,410 million people in 2022F (Figure 29).
Source: IMF, World Economic Database, Author
Source: IMF, World Economic
Database, Author
Source: IMF, World Economic
Database, Author
Source: IMF, World Economic Database, Author
Figure 26 – Africa’s GDP Growth and
Inflation Rate
Figure 27 – Africa’s Population (M)
Figure 28 – Asia Pacific’s GDP Growth
and Inflation Rate
25 0,00% 0,50% 1,00% 1,50% 2,00% 2,50% 3,00% 3,50%
GDP growth Inflation growth
0% 2% 4% 6% 8% 10% 12% 14% 0,00% 0,50% 1,00% 1,50% 2,00% 2,50% 3,00% 3,50% 4,00% 4,50%
GDP Growth Inflation growth
Latin America and Caribbean Economic Outlook
Similarly to Africa, the Latin America and Caribbean region is still behind the other regions in what regards economic development. After a drop in 2018 of the GDP growth, it is expected to slowly grow in the upcoming years, reaching a 3.7% YoY growth in 2021. Moreover, according to what the IMF forecast, the Inflation rate will keep its increasing trend, stabilizing at 3% in 2020 (Figure 30).
United Kingdom Economic Outlook
Even though the United Kingdom (UK) is one of the largest economies in Europe, it was deeply affected by the financial crisis in 2008. As its financial sector is quite important, the increase in consumers’ debt and the stagnation of the real estate market, led the economy to an intensive recession. This period came to an end after an austerity program
launched in 2010 by the government, having as main target the reduction of public debt.
Regarding the UK’s GDP growth, a constant decrease was verified since 2014 until 2018, being expected to continue at least until 2019. According to the IMF, after the decrease from 2.9% to 1.4% in the last five years, a new lowest is expected in 2019 with a GDP growth of 1.2%. However, a significant increase is forecasted in 2022, where it’s
expected a GDP growth rate of 1.6% (Figure 31).
After a significant decrease on the inflation rate, from 1.5% to around 0% in 2014 and 2015 respectively, caused again by the deflation in oil and gas prices, this indicator has reached 2.5% in 2018. The IMF expects it to decrease in the following years, presenting a 2% constant rate from 2020 to 2022.
Despite the current favourable economic conditions, the country’s economy can suffer a negative impact if the UK decides to leave the European Union (EU). The so called Brexit can jeopardize its trade relationships with the EU and other European countries.
Balancing the above factors, the UK’s economic outlook sustain a positive growth for DGE.
Brexit
The United Kingdom’s proposal to exit the EU has set out one of the largest uncertainty periods of its economy. Without being able to reach an agreement with Brussels so far, the UK has yet to learn and quantify what will be the consequences and the returns of leaving the European Union.
Amongst those consequences are the change on trade barriers. By reducing tariffs or removing non-tariff trade barriers, the country will have the chance to access markets which were previously unreachable. This will bring a positive impact on trading since several academics studies support the premise that barriers tend to reduce trading and its economic output. Similarly, new trade barriers can be established
Source: IMF, World Economic
Database, Author
Source: Financial Times, Author Source: IMF, World Economic
Database, Author
Figure 30 – Latin America and Caribbean’s
GDP Growth and Inflation
Figure 31 – United Kingdom’s GDP Growth
and Inflation Rate
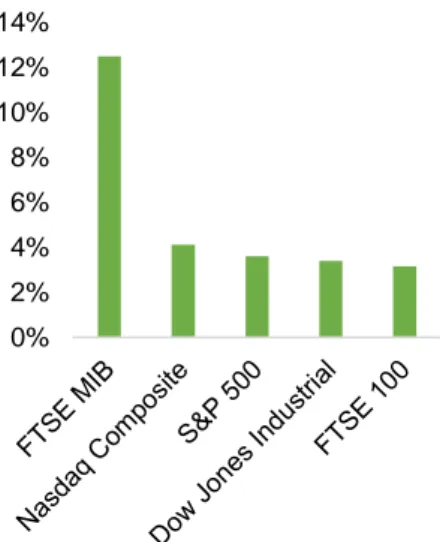
Figure 32 – Negative impact of Brexit
26 0,0 0,1 0,2 0,3 0,4 0,5 0,6 0,7 0,8 0,9 1,0 J a n '14 Ap r '14 J u l '14 O c t '1 4 J a n '15 Ap r '15 J u l '15 O c t '1 5 J a n '16 Ap r '16 J u l '16 O c t '1 6 J a n '17 Ap r '17 J u l ' 17 O c t '1 7 J a n '18 Ap r '18 J u l '18 O c t '1 8 J a n '19 Ap r '19 J u l '19 0 10 20 30 40 50 60 towards trading with European countries. This outcome would damage
several British companies. Nonetheless, it is not certain how these changes would affect growth.
Another consequence of the Brexit would likely be the decrease in foreign investment. Since the majority of this investment comes from EU members, and are highly related to trading, the UK’s attractiveness to outside investors would tend to reduce.
Migration is also a factor to be considered. The assumptions made on this topic forecast a change in the government’s migration policy. These would directly affect the number of workers currently in the UK, change the existent skills mix and perhaps affect the overall economic output of the country.
Even though regulations have a clear purpose around topics as
competitiveness, safety, climate protection, it takes a negative impact on how companies are able to use their resources to produce as many as possible. Thus, abandoning EU’s regulations could drive a positive result on the economy.
All the above are key factor to ensure productivity and a long-term growth of the economy. However, as stated before, no prediction can currently be made to assess what will be the impact of this decision, nor for the UK economy nor for the EU members. We can observe though that, due to this uncertainty, many companies and financial institutions have been preparing for the Brexit. This preparation has taken several forms such as moving its businesses to continental Europe and suspending their current investments in UK’s territory.
Source: European Central Bank, Author
Source: Statista, Author
Figure 33 – Number of companies
reallocated after Brexit, by country of allocation
27 2,0% 2,5% 3,0% 3,5% 4,0% 4,5% 5,0% 0 10.000 20.000 30.000 40.000 50.000 60.000 33.3% 21.6% 18.5% 14.1% 6.4%6.1% Water Alcoholic beverages Carbonated soft drinks Milk and dairy drinks Other drinks
Fruit and vegetable juices
5. Industry Outlook
Beverage Industry Outlook
Beverage industry can be decomposed into non-alcoholic and alcoholic markets, where only a few large players are able to operate. According to Statista, the worldwide market volume has been constantly increasing since 2010 up to 2018, reaching a growth rate of 43% over these nine years (Figure 35).
The major contributors for this growth are Anheuser-Busch InBev, Nestlé SA and The Coca-Cola Co., registering net sales above than $30,000 million (Figure 36) in 2018, making them the worldwide leaders of the beverage industry.
Regarding the share of consumption on packed beverages, water represents a third of the total consumption, being followed by the alcoholic beverages that account for 21.6% of the grand total (Figure 37).
The beverage industry has lately shown an increased focus on health and wellness, mainly o developed countries. Particularly, young
consumers are now more willing to try new healthier alternatives rather than the traditional soft drinks. Low calorie and sugar products like sparkling water are an example of the consumer behaviour, where these types of beverages substituted the old fashioned sodas. Companies try to keep up with these new trends, innovating to bring added value to its customers.
In terms of new opportunities to expand to other markets, globalization has started many years ago. Companies are expanding its business across all around the world, turning local brands into major global ones. Moreover, expansion to emerging markets is seen as a big opportunity to increase revenue, taking advantage of their fast growing and
willingness in evolving.
Source: Statista, Author
Source: Statista, Author
Source: Statista, Author
Figure 35 – Global beverage market
volume growth from 2010 to 2018 (%)
Figure 36 – Leading beverage companies worldwide in
2018, based on net sales (in million U.S. dollars)
Figure 37 – Share of consumption of packed
beverages worldwide in 2018, by beverage type (%)
28
34,30%
11,70% 44,80%
9,30%
Beer Wine Spirits Ready to Drink
0 10 20 30 40 50 60 40% 42% 44% 46% 48% 50% 52% 2006 2007 2008 2009 2010 2011 2012 2013 2014 This industry is recognized by all the merger and acquisitions events that consecutively happen. Firms see great advantages in these kinds of operations such as economies of scale, market share improvement and know-how and technologies absorption. It also allows companies to be able to simultaneously eliminate part of the competition, gain its market share and diversify its own brand portfolio. Even though it a costly event, key players are willing to make the trade-off.
The largest consumers of this industry are a key factor for the industry’s growth. Economic crisis from countries like China, the United States and Brazil can have a negative impact on the worldwide industry.
Nevertheless, the positive growing of home consumption and the increasing customers’ confidence level are positive indicators for the industry.
Alcoholic Beverages Industry Outlook
Alcoholic beverage industry can be decomposed into spirits, beers, wine and ready to drink. Historically, beers have been representing the majority of the worldwide alcoholic beverage consumption followed by wine and spirits, respectively. Although, with the increasing trend on premiumisation, spirits represent now 45% of the worldwide alcoholic beverage consumption, followed by beers (34%) (Figure 38). Main consumers are China, the United States and Brazil with an annual consumption of 54.29, 30.5 and 14.04 billion liters, respectively (Figure 39).
Nowadays, spirits are becoming the most popular alcoholic beverage, mainly due to the brand innovation and communication companies have been building in the last few years. They are composed by many
differentiated products, able to adapt to the consumer’s needs. Spirits are seen as a type of beverage which suits many occasions across cultures. In regions as Asia, spirits are very common in business events, being a sign of respect and commitment. Comparing the global spirits consumption, it has increased 7% from 2006 to 2014 (Figure 40).
Source: Statista, Author
Source: Statista, Author
Source: Statista, Author
Figure 38 – Share of Alcoholic
Beverages by Type in 2018 (%)
Figure 39 – Leading Alcohol Consumption by
Country in 2018 (billion liters)
29 0,0 0,5 1,0 1,5 2,0 2,5 1 9 9 8 1 9 9 9 2 0 0 0 2 0 0 1 2 0 0 2 2 0 0 3 2 0 0 4 2 0 0 5 2 0 0 6 2 0 0 7 2 0 0 8 2 0 0 9 2 0 1 0 2 0 1 1 2 0 1 2 2 0 1 3 2 0 1 4 2 0 1 5 2 0 1 6 2 0 1 7 2 0 1 8 220 230 240 250 260 270 280 290 300 2 0 1 0 2 0 1 1 2 0 1 2 20 13 2 0 1 4 2 0 1 5 2 0 1 6 2 0 1 7 2 0 1 8 236 238 240 242 244 246 248 20 10 2 0 1 1 2 0 1 2 2 0 1 3 2 0 1 4 2 0 1 5 2 0 1 6 2 0 1 7 2 0 1 8 -10% -5% 0% 5% 10% 2009 2010 2011 2012 2013 2014 2015 2016 2017
Beer Wine Spirits
35.3%
32.3% 23.1%
9.4%
Beer Wine
Spirits Ready to Drink Beer still remains a popular drink within the world. Focusing on the
growing of artisanal beers, they have substituted many worldwide famous brands due to their innovative flavours and unique quality. According to Statista, beer consumption has decreased 4.4% from 2006 to 2014, still presenting though a worldwide production of 1.96 billion hectolitres in the latter year (Figure 42).
In what regards to wine, its production has historically been
concentrated in Europe, mainly due to climatic reasons. Countries like Italy and France are known for producing the best wines in the world and exporting them across all regions. Wine’s production reached an historical high of 292.3 million hectolitres in 2018. Its consumption was on a positive trend until the economic crisis come into the picture, leading to a slight decrease, from 250 to 244 million hectolitres in 2008 and 2009, respectively (Figure 41). Nevertheless, from 2000 to 2018, global wine consumption has shown an increase of nearly 8% (Figure 43).
In the UK, beer is still the most popular alcoholic beverage (35.3%), immediately followed by wine (32.3%) (Figure 44). Against the world’s trend, spirits’ consumption is quite below the other main beverages’ one. In fact, beer is a part of the British culture, where consumers drink in various ways such as temperatures, sizes and types. It is not expected that this trend changes since spirits’ companies are mainly focused on growing in emerging markets.
Source: Statista, Author
Source: Statista, Author
Source: Statista, Author
Source: Statista, Author Source: Statista, Author
Figure 42 – Wine production worldwide from
2010 to 2018 (in million hectoliters)
Figure 41 – Beer production worldwide from 1998 to 2016 (in billion hectoliters)
Figure 43 – Wine consumption worldwide
from 2010 to 2018 (in million hectoliters)
30
Peer Group
This Peers selection will be used on our Relative Valuation (chapter 7). It is important to note that DGE is a multinational company which operates across the entire world. Moreover, DGE’s portfolio counts with a lot of diversity, whereas many of the companies in the alcoholic beverages industry focus only on a few segments.
By applying a selection process, a peer group was obtained: Pernord Ricard Groupe, Anheuser-Busch InBev NV, Asahi Group Holdings Ltd, Kirin Co Ltd, Thai Beverage PCL and Suntory Beverage Ltd. This selection process is available on detail on Appendix 14.
Pernord Ricard Groupe
Pernord Ricard Groupe’s portfolio counts with wine, ready to drink and spirits. They are a French enterprise founded in 1975. The company owns brands as Absolut Vodka and Chivas Regal. In 2018, they reached $8,987 million in revenue.
Anheuser-Busch InBev NV
Anheuser-Busch InBev NV is a Brazilian-Belgian multinational beverages company. It is the product of multiple mergers of brewing companies. Their portfolio counts with beer as their main product and wine. Their 2018 revenue surpassed the barrier of $50,000 million.
Asahi Group Holdings Ltd
Asahi Group Holdings Ltd is a Japanese beer and soft drink enterprise. Worldwide, it has the largest market share in beer (38%). Similarly to Anheuser-Busch InBev NV, it resulted from several mergers amongst brewers. On their portfolio, along with beer, they also count with ready to drink beverages.
Kirin Co Ltd
Kirin Co Ltd has portfolio mainly composed by beer and ready to drink products. It is based in Japan but has a strong presence on foreign markets like Europe and North America. Like other Japanese beverage companies, its strongest segment is the beer.
Thai Beverage PCL
Thai Beverage PCL is Thailand’s largest beverage company, with distilleries in China, Scotland and Thailand. Its main product focus is on beer and spirits. One of their most successful activities comes from a 50/50 joint venture with Carlsberg to launch Chang, the Carlsberg Asia.
Suntory Beverage Ltd
Suntory Beverage Ltd is a Japanese beverage company which counts with spirits and ready to drink products on their portfolio. They own brands like Jim Beam, Hibiki and Maker’s Mark, three of the most
famous whiskies in the world. Suntory is the third largest spirits maker in the world.
31 0 1 2 3 4 5 Industry rivalry Threat of Substitutes Bargaining power of buyers Bargaining power of suppliers Threat of new entrants Competitive Position Strengths Weaknesses
• Owner of some of the best-selling brands in the world (brand awareness)
• High level of dependency on big customers like retailers and wholesalers • Very diversified portfolio of
brands
• Only operates in the alcohol industry • Proactive in innovating to
follow new trends and preferences
• Exposure to emergent markets with political instability
• Counts with the loyalty of its clients
• Low levels of debt • Well established in
international markets
Opportunities Threats
• World economic recovery • Foreign exchange risk • Consumer’s increasing
concern in premiumisation
• Strong competition in the industry
• Increasing consumption of alcoholic beverages
• Instability within some African and ME countries • Increasing concern for
healthy lifestyles
Porter’s Five Forces
Threat of new entrants (Medium/Low)
Mergers and acquisitions are very common in the beverage industry. In order to gain market share and to reach economies of scale, this larger agglomeration of firms make it difficult for any competitor to entry in this industry. Additionally, high initial investments specifically on fixed costs as machinery and warehousing are expected in the beverages industry. Achieving economies of scale is a key factor for a company to be able to have competitive prices. Therefore, we consider this a medium/low threat for DGE.
Bargaining power of suppliers (Medium)
There are many suppliers in this industry, specially on what regards machinery and warehousing. A change of supplier wouldn’t be difficult to achieve. Although, raw materials are at the core of the business. DGE has many partners on their supply chain, being in many cases their largest buyer. However, raw materials are always exposed to
environmental risks as weather conditions and natural disasters. Thus, this industry always faces the threat of increasing prices of raw
materials. Therefore, we consider this a medium threat for DGE.
Source: Company data, Author
Table 14 – SWOT Analysis
32
Bargaining power of buyers (Moderate)
DGE’s main buyers are hypermarkets, supermarkets and large grocery stores. These are players with a high bargaining power, able to achieve larger payment periods and a reduced unitary price, due to the bigger quantities they acquire. These buyers stand for a significant share of DGE’s sales. Nonetheless, as DGE is well established within the industry, customer’s force these large grocers to negotiate with DGE in order to achieve a profitable arrangement for all parties. Therefore, we consider this a moderate threat for DGE.
Threat of Substitutes (Low)
DGE’s portfolio counts with all the existing segments within the alcoholic beverages industry: spirits, beer, wine and ready to drink. A possible threat for DGE would be for consumers to switch to a product within the non-alcoholic beverages range, due to increasing health concerns. Although, these are products used on different contexts and that suit different needs. Therefore, we consider this a low threat for DGE.
Industry rivalry (High)
The few companies already established in the beverages industry are in general large firms with a significant market share. Brand loyalty is very common, but competitors are constantly innovating and exploring new segments within the industry to keep their customers and attract new ones. This diversification is essential for succeeding in this industry, by avoiding segments where larger companies are already operating. Therefore, we consider this a high threat for DGE.
33 34,00% 24,20% 12,30% 8,80% 20,70% North America Europe and Turkey Africa
Latin America and Caribbean Asia Pacific
6. Investment Summary
With a price target of £30.65 for 2018, an upside potential of 12.59% from the current price of £27.22, using a medium risk assessment, and the Discounted Cash Flow method, our recommendation stands for
HOLD. Moreover, the Relative Valuation through multiples does not
support our recommendation (Table 15), since we reached a price target of £27.54, representing an upside potential of 1.19%. However, we do not consider this to be an appropriate method to compute the company’s price target, since the firm’s peers present different capital structures. Using the Market Multiples approach, our recommendation would change to REDUCE.
DGE has a strong presence in several regions across the world, being
one of the market leaders in alcoholic beverages. The most relevant region in terms of sales proportion is North America (Figure 47). However, the firm intends to expand its current business on emerging markets such as Africa and Latin America and Caribbean.
Valuation Methods
In order to reach a price target for DGE, two different valuation methods were used, a relative and an absolute valuation method. Concerning the absolute method, we used the Discounted Cash Flow (DCF), more specifically the Flow to Equity (FTE). Regarding the relative valuation method, we used the Market Multiples approach, where a peer group was selected according to its similarity degree towards DGE. However, this approach did not support the conclusions obtained through the absolute valuation method.
Financial Position
In the last years, the firm’s profitability ratios have remained quite stable. The gross profit margin presents values around 40%, whereas the EBITDA margin reached 22.7% in 2018. The EBIT margin has been slowly increasing, reaching 20% also in 2018. It is important to denote that these ratios performance is directly linked to the company’s sales performance. Similarly, the Net Profit margin has achieved a value of 20% in 2018.
Risks to Price Target
DGE operates in an industry which is dominated by only a few, large key players. Thus, entry into new markets is quite difficult. Moreover, due to the growing influence of the social media, the company has invested into growing its reputation, as costumer’s loyalty is a key factor of the industry. In order to calculate the impact of the main company’s drivers in our price target, we performed a sensitivity analysis and a Monte
Carlo simulation (Figure 48). According to the last, Cost of Equity
(64%) and Cost of Sales/Sales proportion (31.3%) are the main risks to our price target. Through this simulation, we reach a mean price of
£31.47, representing an upside potential of 15.61% and support our
final recommendation of HOLD.
DCF Valuation Method
Total Value of Equity 82596.91
Target price £30.65
Multiples Valuation Method
PER £27.54
Difference
£3.11 11.40%
Source: Company data, Author
Source: Company data, Author
Source: Oracle Crystal Ball, Author
FCFF
Table 15 – Valuation Summary
Figure 47 – Proportion of Sales by region,
in 2018 (%)
Figure 48 – Monte Carlo Price