PROPOSITION OF A MARKETING PLAN TO EXPORT
PORTUGUESE STILL WINES TO FRANCE
Robin Nathan JULLIEN
Project submitted as partial requirement for the conferral of
Master in International Management
Supervisor:
Prof. António Robalo, ISCTE Business School, Departamento de Marketing, Operações e Gestão Geral
Spine
-MA
R
KET
IN
G P
LAN
TO
EXPO
R
T
P
O
R
TUGUES
E
WI
N
ES
R
o
b
in
N
at
h
an
JU
LLIE
N
I Abstract
The purpose of this thesis is to design a marketing plan to promote Portuguese qualitative still wines in France.
Portugal is an old and traditional winemaker. The country has started a vast plan of restructuration of its vineyards and wine production toward quality over the last decades. Portuguese wines do have nowadays very interesting price/quality ratios and are grabbing more and more medals at international wine competitions. In the meanwhile, the French consumption of wine is shifting from traditional and local-oriented habits to a more opened and diversified consumption. Despite the success of many foreign wine regions in France, and the strong links existing between France and Portugal, the Portuguese still wines still have not succeeded to reach the French market. The purpose of this thesis is to outline the strengths and the advantages of the Portuguese wine production according to the characteristics of the French wine market, in order to design a marketing plan to promote qualitative still Portuguese wines to the French customers.
Keywords
II Resumo
O objetivo desta tese é, desenvolver um plano de marketing de vinhos tranquilos portugueses de qualidade, em França.
Portugal é um país de longa tradição vinícola. Desde as últimas décadas que, as instituições nacionais têm seguido um profundo plano de reestruturação do setor, para revitalizar a sua produção em direcção à qualidade. Hoje em dia, os vinhos portugueses tranquilos começam a ganhar cada vez mais importância, juntamente com o famoso vinho do Porto. Obtêm novas quotas de mercado nos mercados internacionais, e vencem sempre mais medalhas em concursos internacionais por todo o mundo.
Simultaneamente, o consumo de vinho em França está em grande mudança, porque as novas gerações estão a deixar o consumo traditional, quotidiano e local para um consumo mais ocasional, mas mais aberto a descobertas. Embora os recentes sucessos de várias regiões vinícolas estrangeiras em França, e as boas relações culturais, sociais e económicas entre França e Portugal, os vinhos portugueses ainda não têm conseguido atingir o mercado Francês.
O propósito deste estudo é, analisar o poder e as vantagens da produção de vinho português em relação às características do mercado de vinho em França, afim de desenvolver um plano de marketing para promover os vinhos tranquilos portugueses em França.
Palavras-chaves
Exportação de vinhos portugueses ; Mercado do vinho em França ; Importação de vinhos estrangeiros em França ; Marketing do vinho
III
Index
Introduction ... 1
Chapter 1. Global analysis of the Portuguese wine production in the world trades ... 3
1.1 Study of the world’s wine production, consumption and trades ... 3
1.1.1 The world wine production ... 3
1.1.2 The world wine consumption and trades ... 5
1.2 Study of the wine production in Portugal ... 11
1.2.1 Quick overview of the viticulture and winemaking history in Portugal ... 11
1.2.2 Study of the modern and current wine Production in Portugal ... 12
1.3 Study of the Portuguese wine exports ... 16
1.3.1 Analysis of the exports by type of products and destinations ... 16
1.3.2 The promotional support of ViniPortugal and Wines of Portugal ... 19
Chapter 2. General study of the French wine market ... 22
2.1 General analysis of the wine consumption in France ... 22
2.1.1 A reducing and shifting general consumption over the last decades ... 22
2.1.2 Regional analysis of the consumption ... 24
2.1.3 Analysis of the wine distribution channels in France ... 27
2.2 Analysis of the foreign wines market in France ... 32
2.2.1 The French importations of foreign wines ... 32
2.2.2 Analysis of the foreign wine distribution in France ... 35
2.3 PORTER 5 forces analysis of the wine market in France ... 36
2.4 SWOT Analysis of the wine market in France for foreign wines ... 41
2.5 The Portuguese wine market in France ... 42
Chapter 3. Modelling a marketing plan to promote Portuguese wines in France ... 45
3.1 General analysis and presentation of the business opportunity ... 45
3.2 Cross-analysis of Portuguese wine production and the French wine market ... 47
3.2.1 SWOT Analysis of the Portuguese wine production for the French market ... 47
3.2.3 Analysis and conclusions: where are the opportunities ... 53
3.3 Development of the marketing plan ... 54
3.3.1 Mission, vision and values ... 54
3.3.2 Marketing mix ... 54
Chapter 4. General conclusion ... 66
IV
Index of Graphs
Graph 1. World vine planted area vs. world wine production p.3 Graph 2. World wine consumption p.6
Graph 3. Evolution of the Portuguese wine production (1883 – 2012) p.13 Graph 4. Wine distribution in France by channels of distribution p.27
Index of Tables
Table 1. World main wine producers p.4
Table 2. Evolution of the consumption per capita in some European market p.7
Table 3. Consumption rates of big-potential southern hemisphere’s emerging markets p.7 Table 4. Consumption rates of big-potential non-European mature markets p.9
Table 5. Consumption rates of some importing European markets p.10
Table 6. Consumption rates of traditional wine maker European countries p.10 Table 7. Main destinations in volume and value of the Portuguese wine exports p.17
Table 8. Distribution of the promotional events supported by ViniPortugal in Europe (2009-2013) p.20
Table 9. Evolution of some consumer profiles in France (1980-2000) p.22 Table 10. Structure of French wine imports by type of products p.33
Table 11. Structure of French wine imports by type of products, in value p.34 Table 12. Foreign wine price distribution in restaurants in France in 2014 p.36
List of Acronyms and abbreviations
OIV – Organisation Internationale du Vin et de la Vigne IVV – Instituto da Vinha e do Vinho
The USA – The United States of America The UK – The United Kingdom
The “Old world” – Traditional wine producer countries such as mainly intended: France, Italy, Spain, Portugal, Germany, Austria, Greece, Hungary, Romania, Georgia.
The “New world” – New wine producer countries in comparison, many intended: the USA, Argentina, Chile, Brazil, South Africa, Australia, New-Zealand and China.
hl – One hectoliter (equivalent to 100 liters) ha – One hectare (equivalent to 10 000 m2)
V Executive summary
Portugal é um país de longa tradição vitivinícola: faz parte do “Old world” do vinho e está a produzir e exportar vinhos desde os últimos séculos. Nas últimas décadas, Portugal tem investido em estratégias de produção, para promover a qualidade e a consistência dos vinhos. O setor tem vindo a ser reestruturado, para atingir os objectivos de qualidade. Hoje em dia, Portugal tem inúmeras pequenas explorações vitivinícolas que produzem vinhos de qualidade, a partir de uma base fantástica de castas indígenas, aproveitando condições climáticas de produção únicas no mundo. A mudança para a qualidade já está em marcha e tem vindo a ser recompensada a cada mês, nos mais famosos concursos de vinhos do mundo, onde os vinhos portugueses vencem cada vez mais e mais medalhas.
França era o primeiro mercado de vinhos no mundo até 2013. Hoje é o segundo em volume depois dos Estados-Unidos, mas ainda tem a coroa mundial do consumo per capita. França é também um dos primeiros produtores de vinhos, e o seu consumo doméstico é maioritariamente fornecido pelos vinhos nacionais. No entanto, o mercado está em grande mudança, pois as novas gerações têm uma abordagem diferente ao vinho e estão a mudar profundamente códigos de consumo. Durante a última década, vários vinhos estrangeiros têm conseguido entrar no mercado francês e surfar sobre esta nova onda. De facto, sucessivamente, vinhos italianos, espanhóis, californianos, chilenos, argentinos, australianos, neozelandeses, da áfrica do sul, húngaros, croatos... têm conseguido criar um caminho até os consumidores franceses.
Esta situação paradoxal levou-me a investigar o assunto. Numa primeira parte, vamos estudar a estrutura da produção de vinho em Portugal, tal como as exportações, para perceber as principais características do orgão de produção vinícola, o seu perfil, e a situação atual dos vinhos portugueses nos mercados internacionais. Na segunda parte, vamos estudar o mercado francês dos vinhos, analisando a estrutura do mercado, os perfis de consumo e a organização da distribuição. Esta parte será encerrada com uma análise do mercado dos vinhos estrangeiros em França, a sua própria distribuição, e o caso particular dos vinhos portugueses.
VI
Este estudo cruzado de forças e vantagens dos vinhos portugueses, em relação às oportunidades do mercado francês, vai de encontro à terceira parte que desenvolve a elaboração de um plano de marketing destinado à exportação dos vinhos tranquilos portugueses de qualidade, no mercado francês.
1
Introduction
Portugal is an old and traditional winemaker. It is part of the so called “Old world” in terms of winemaking and it has produced and exported wines during the last centuries. In the last decades, Portugal has invested in qualitative strategies, and has restructured its national vineyards toward this direction. Today, Portugal counts countless small wineries, producing very interesting qualitative still wines, from indigenous fantastic grape varieties, benefiting from unique and profitable climatic conditions. The shift toward quality has definitely been made, and is still going on, while Portuguese wines are more and more awarded, weeks after weeks, at the most famous international wine competitions.
France has been for the last decades the first wine market in volume the world until 2013. It is today the second market, behind the United States of America (the USA) with the higher consumption rate per capita in the world. Of course, France is a very strong wine producer, and the national production mainly provides the domestic consumption. Nevertheless, the market is changing, as the new generations consume differently, and the codes of the wine consumption are strongly evolving. Alternately, foreign wines have succeeded to enter the French market: Italian, Spanish, Californian, Chilean, Argentinean, Australian, New-Zealanders, South-African, Hungarian, Croatian… have enjoyed their “round” of fame and trend at the French wine boutiques, bars, bistrots, cafés and restaurants.
France and Portugal are two countries geographically near, only separated by Spain, with traditional and structured commercial routes. Both are part of the same free-trade area, the European Union, and both maintain good political and commercial relations. France benefits from a very strong Portuguese community, spread all over the country and very well integrated, supported by an important network of cultural associations.
In 2013, France was the second customer for the Portuguese wines in volume, and the first in value. In the meanwhile, it is very difficult to find a bottle of still Portuguese wine on the shelves of the French wine distributors, while Portuguese wines are completely unknown in France and they still have not benefited from any particular interest from the professional of the sector.
2
This paradoxical situation has led me to investigate the topic. In a first part, we will study the structure of the Portuguese wine production and exports, in order to understand its main characteristics and how Portugal is situated on the international markets. Then is developed an analysis of the French wine market: the idea is to understand the recent changes in consumption while analyzing the structure of the market and its distribution. This second part will close with an analysis of the foreign wines market in France, as well as the Portuguese case. This cross-analysis of the Portuguese production’s features and strengths, combined to the analysis of the opportunities of the French market has led to the third part which is the elaboration of an adapted marketing plan to export Portuguese qualitative still wines to France.
3
Chapter 1. Global analysis of the Portuguese wine production in the
world trades
1.1 Study of the world’s wine production, consumption and trades
1.1.1 The world wine production
Before starting the analysis, we will note here, as they will be repeatedly used in the following texts, that the “old world” concept by opposition to the “new world”, in the wine language, encompasses the European traditional wine making countries such as mainly Italy, France, Spain, Germany, Portugal, Austria, Greece, Hungary, Romania and Georgia. The new world corresponds to more recent producers, coming from the USA and the Southern Hemisphere as mainly Argentina, Chile, Brazil, South Africa, Australia, New-Zealand and China.
As we can see on the graphic below, the world wine production has generally showed a diminishing trend over the last decade until 2013, with yearly ups and downs, mostly explicated by the annual changing climatic conditions. Despite a reduced planted area (-5% from 2000 to 2013), the wine production has recovered its level of 2000 in 2013 thanks to a very good harvest in many parts of the world.
Graph 1. World vine planted area vs. world wine production
240 250 260 270 280 290 300 7400 7500 7600 7700 7800 7900 8000 2000 2002 2004 2006 2008 2010 2012
World planted area vs. World wine
production
World planted area (in 1000 hA)
World production (in Mhl)
4
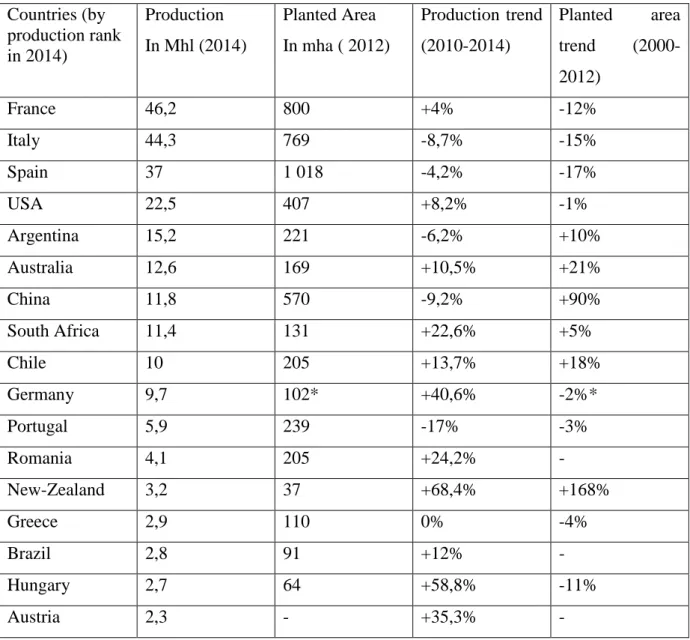
Comes below the list of the main world producers in 2014:
Countries (by production rank in 2014) Production In Mhl (2014) Planted Area In mha ( 2012) Production trend (2010-2014) Planted area trend (2000-2012) France 46,2 800 +4% -12% Italy 44,3 769 -8,7% -15% Spain 37 1 018 -4,2% -17% USA 22,5 407 +8,2% -1% Argentina 15,2 221 -6,2% +10% Australia 12,6 169 +10,5% +21% China 11,8 570 -9,2% +90% South Africa 11,4 131 +22,6% +5% Chile 10 205 +13,7% +18% Germany 9,7 102* +40,6% -2%* Portugal 5,9 239 -17% -3% Romania 4,1 205 +24,2% - New-Zealand 3,2 37 +68,4% +168% Greece 2,9 110 0% -4% Brazil 2,8 91 +12% - Hungary 2,7 64 +58,8% -11% Austria 2,3 - +35,3% -
*Germany: Planted area in 2014, Trend from 2000 to 2014. All sources: OIV reports 2013 and 2014.
Table 1. World main wine producers
The world wine production is still led by the traditional European winemaker countries, and mainly the trio France, Italy and Spain. The production appears as concentrated as these three countries together represent 47% of the world production in 2014. Adding the USA, the 4th world producer, they produce together 56% of the world production. Looking now at an old/new world comparison, the old world produced 57% of the world wine in 2014 (France, Italy, Spain, Germany, Portugal, Romania, Greece, Hungary and Austria), against 33% for the
5
new world (the USA, Argentina, Australia, China, South Africa, Chile, New-Zealand and Brazil).
If the old world still has a strong advantage in terms of production, notably due to its historical culture of winemaking, strong domestic demands and technological advantages, the world’s vineyard is consequently shifting to the southern hemisphere. Indeed, from 2000 to 2012, France, Italy, Spain, Germany, Portugal, Greece and Hungary have respectively lost 12%, 15%, 17%, 2%, 3%, 4% and 11% of their vine planted areas, while Argentina, Australia, China, South Africa, Chile and New-Zealand have respectively registered increases of plus 10%, 21%, 90%, 5%, 18% and 168% ! The new world is definitely gaining more and more space in the world wide’s planted area, and the recent transfers of technology from the northern to the southern Hemisphere in terms of viticulture and oenology processes will definitely convert these progresses into stronger wine productions from the new world’s countries in the coming decade.
1.1.2 The world wine consumption and trades
The world’s wine consumption has shown a slightly upward trend in the last decade as we can see on the graphic under. The trend had been mostly rising from 2000 to 2007, from the beginning of the financial and economic crisis starting in the USA. A substantial decrease had followed the crisis until 2010. From 2010, the market appears to be restarting slowly, pulled up by new consuming regions. The sector is now facing a slow redistribution of the market places, and expects a timid but positive recovery of the global demand as Federico Castellucci, General Director of the OIV, stated in 2013: "With these data in hand, it seems that the worst is behind us. The global vitivinicultural sector is once again able to deliver profitable growth, although significantly positive results will not be immediate."
6
Graph 2. World wine consumption
The redistribution of the global wine consumption has indeed started: the world’s wine suppliers are now counting on new consuming markets with large population pools and enormous opportunities of growth, in comparison with the tight and saturated traditional European markets. The pioneer of this new Eldorado’s rush had been the USA. In 2013, for the first time in the modern history, the USA overtook France as the first world wine consumer, with 29 million hectoliters consumed in 2013, against 28 million in France. The US market has been constantly growing during the last twenty years, and a +11% growth rate is expected to continue until 2018. This redistribution of the roles had been quickly followed by a new record, unexpected until the last years, as China became the first world red wine consumer in 2014, in front of France again.
During the 2007-2014 period, the red wine consumption has boomed by 175% in China to reach 155 million of cases (a case contains six bottles), while it has been decreasing by 18% in France over the same period.
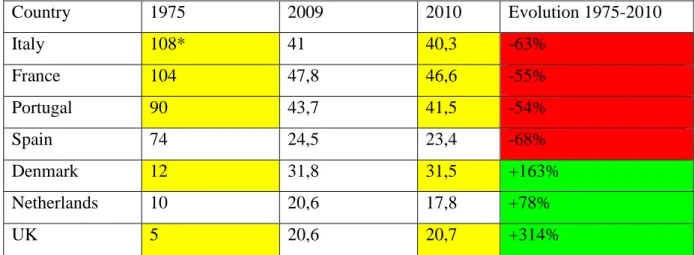
In terms of trends and expectations of growth, traditional European markets present really high levels of consumption per capita compared to the southern hemisphere and the USA, but they are limited by their size. Regarding the consumption rates, they are considerably lowering in traditional wine maker western/south European countries, mainly due to an important generational shift in cultural habits about wine drinking. Other markets, mainly from the north of Europe show increasing consumption rate and represent interesting market for the near future in Europe. As we can see on the table below, there have been occurring major shifts in consumption over the last decade, intra-Europe.
7 Country 1975 2009 2010 Evolution 1975-2010 Italy 108* 41 40,3 -63% France 104 47,8 46,6 -55% Portugal 90 43,7 41,5 -54% Spain 74 24,5 23,4 -68% Denmark 12 31,8 31,5 +163% Netherlands 10 20,6 17,8 +78% UK 5 20,6 20,7 +314%
*Consumption per capita, in liters per year per person. Source: FranceAgriMer (French Ministry of Agriculture).
Table 2. Evolution of the consumption per capita in some European market
At the world-scale, all the eyes are now turned toward young and massive markets, which still present really low consumption per capita rates but tremendous opportunities for growth. The USA are definitely the most mature of these markets, with a 10 liters per capita consumption in 2014, followed by market such a Russia (7,15 liters in 2013), Japan (2,7 liters in 2012), Brazil (1,9 liters in 2013), and China (1,2 liters in 2013).
We can distinguish three types of market which will lead the world wine consumption in the coming decades. The first cluster gathers countries combining tremendous population pool and still low consumption per capita:
Country Population (in million) Consumption (in million liters) Consumption per capita Importation (in million liters) Importation (in million $ ) Japan 127 263 2,1 L 279 1 641 China 1 400 1 680 1,2 L 374 1 555 Brazil 200 384 1,9 L 75,2 290 Nigeria 174 14,2 0,1L 59 47 India 1 252 13,5 0,01 L 11 24,6
All sources from “suddefrance-developpement.com, market analysis”
Table 3. Consumption rates of big-potential southern hemisphere’s emerging markets
These countries are expected to take the lead of the wine consumption, and the world trades in the coming decades. Indeed, even if four of the six markets are producers (India, China and
8
Brazil), their production are not expected to be structured and strong enough to supply a fast-growing consumption. If the consumption level per capita would reach only the half of the European traditional wine markets’, the world trades would be rapidly tremendously multiplied. Japan, with a low but ever-growing consumption does not produce any wine, and is therefore constraint to import all of its strong domestic consumption. Nigeria has a major Muslim population (50%), but the recent important societal changes and the apparition of a strong high-middle class have been turning the country into a new growth driver for wine traders. The consumption and the importations have been growing by more than 25% in the last three years.
9
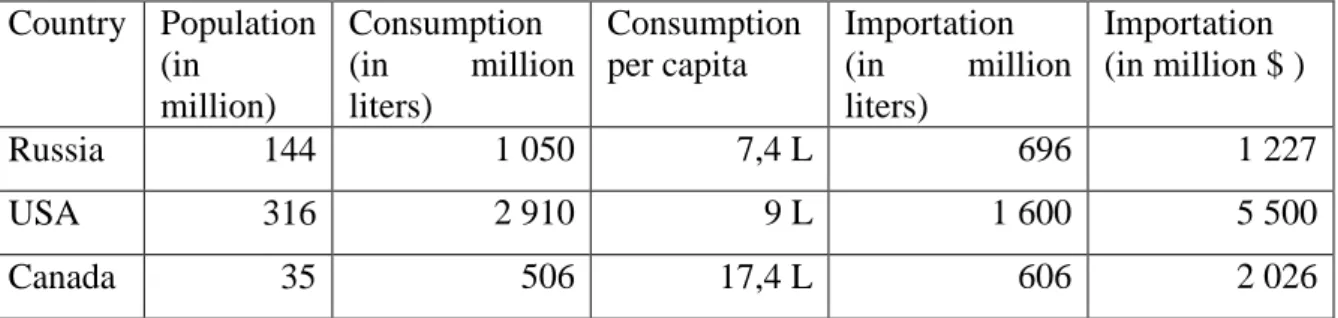
The second-cluster could be composed by more mature markets, presenting, outside of Europe, very strong domestic demand for wine, led by a consequent population pool combined to a stronger consumption per capita. These countries, despite good levels of consumption, are still considered as “young” wine drinkers and expected to keep on growing in the current decades. Canada has a smaller population pool, but a strong consumption per capita, and overall, has a very strong culture of importing at good prices. For less importations in volume than Russia (606 million liters in 2013 against 696 million in Russia), it imports wine for almost twice the value of Russia (2 billion instead of 1,2 billion USD in 2013). The USA are the first world wine consumer since 2013. Its consumption has been constantly growing during the last twenty years and is still expected to be growing faster than the world’s average, by +11% until 2018.
Country Population (in million) Consumption (in million liters) Consumption per capita Importation (in million liters) Importation (in million $ ) Russia 144 1 050 7,4 L 696 1 227 USA 316 2 910 9 L 1 600 5 500 Canada 35 506 17,4 L 606 2 026
All sources from “suddefrance-developpement.com, market analysis”
Table 4. Consumption rates of big-potential non-European mature markets
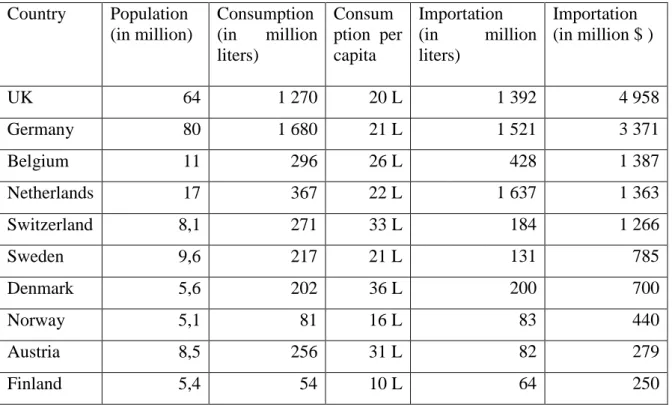
The third cluster, gathering the European markets, can be divided in two groups: the non-producer countries (except Germany, Switzerland and Austria which are non-producers but large importers at the same time for their own national consumptions), and the traditional producers, grouped as France, Italy, Spain and Portugal. The first table gathers the most important European importers, such as the UK, Germany and Netherlands in volume. In value, we find again the UK and Germany at the top of the ranking, following notably by Belgium and Switzerland which import less, but at higher prices. The Nordic markets, namely Sweden, Denmark, Norway and Finland present low populations but very interesting consumption rates per capita at positive growth, and therefore they represent important markets for wine suppliers.
10 Country Population (in million) Consumption (in million liters) Consum ption per capita Importation (in million liters) Importation (in million $ ) UK 64 1 270 20 L 1 392 4 958 Germany 80 1 680 21 L 1 521 3 371 Belgium 11 296 26 L 428 1 387 Netherlands 17 367 22 L 1 637 1 363 Switzerland 8,1 271 33 L 184 1 266 Sweden 9,6 217 21 L 131 785 Denmark 5,6 202 36 L 200 700 Norway 5,1 81 16 L 83 440 Austria 8,5 256 31 L 82 279 Finland 5,4 54 10 L 64 250
All sources from “suddefrance-developpement.com, market analysis”
Table 5. Consumption rates of some importing European markets
The second group gathers the traditional winemaker European countries, with strong consumption rates per capita. Nevertheless, as very strong wine producers they do not account that strongly in terms of wine imports as their domestic consumption is mostly supplied by the national production.
Country Population (in million) Consumption (in million liters) Consumption per capita Importation (in million liters) Importation (in million $ ) France 60 2 800 47 L 520 856 Italy 60 2 302 37,7 L 268 426 Spain 47 937 20 L 161 242 Portugal 10,5 470 42,5 L 155 162
All sources from “suddefrance-developpement.com, market analysis”
11
1.2 Study of the wine production in Portugal
1.2.1 Quick overview of the viticulture and winemaking history in Portugal
Portugal can be considered as an ancient and traditional wine maker country, as the first vine plants had probably been brought by the Tartessians around 2000 BC. The introduction of wine making is attributed to the Phoenicians, who probably established the first commercialized vineyards, around the Sado and Tejo rivers, near by the current Lisbon area.
The stronger and supported development of viticulture and wine making had been carried on by the Romans, who settled down in the Southern Alentejo region, around the administrative center of Evora, before to bring their culture up to the extreme north of the country. The wine-making culture had been stopped during the Muslim regime, basically from 711 to 1137.
The great relation with England emphasized the Portuguese wine production and exports, during centuries, starting through the commerce of the famous Bacalhau, traded by British merchants to Portugal in return for olives, fruits, and wine.
During the English-French wars, the commerce of wine between Great-Britain and Portugal had been strongly strengthened, pushing the British merchants, established in Viana do Castelo, to go further down to Porto and the Douro Valley, where they enabled the creation of the worldwide famous fortified wine “Vinho do Porto”, Port wine. The exportations literally boomed: from 120 tons exported in the 1670s, 6 880 tons were exported a decade later (+5633%). Famous traders, such as Croft, Taylor and Kopke established at this period.
Few decades later, Sebastião José de Carvalho, the so called “Marquês de Pombal”, decided to protect the wine potential of the region, creating the “Real Companhia das Vinhas do Alto
Douro”, and laid down the foundations of the current Institute of wines of Douro and Porto,
regulating the wine production in the Douro valley. He physically delimited the area to maintain certain standards of quality and genuineness, making the Douro Valley, the third world demarcated wine region in 1756 (after Chianti in Italy in 1710 and the Hungarian Tokaj in 1730).
12
1.2.2 Study of the modern and current wine Production in Portugal
The last decades: a work toward quality
The still wine production in Portugal can be divided in four different types of product, according to their denomination: “DOP”, “IGP”, “Wine with grape variety and year
indication” and “Table wine”, by decreasing order of quality and exigence. These protected
denominations of origin are framed by the European Union since 1992, with the objective of standardizing and harmonizing the European wine production, in terms of certification of the production.
The denomination of origin’s system is aimed to protect a specific product by certifying its geographical origin and local know-how. As notably the soil and climatic characteristics are essential to the product composition, it is based on a partitioning of the geographical areas. The product is then considered intrinsically linked to its geographical position, characterizing its features, with concepts of expressing typicality, authenticity, uniqueness and genuineness. Thought, the designation encompasses more criterias than the sole geographical one. Indeed, to ensure the respect of the local know-how during the vine-growing and wine-making processes, regional wine commissions can set up strict rules in order to ensure keeping the traditional features of the concerned regions and sub-regions.
The denomination of origin represents then a strong competitive, and even comparative marketing advantage, as it states that a product from a certain DOP cannot be produced, copied, or reached in another geographical area. This marketing advantage is mainly relevant in traditional winemaking countries, such as France, Italy, Spain and Portugal, where the geographical origin of the wine is crucial for the customer purchasing process. On the other side, the new world’s countries have broken away from this system, as customers are looking for grape varieties instead of geographical origins. As an example, an American or an Australian customer would look for a “Cabernet Sauvignon”, or a “Chardonnay’, while a French customer would look for a “Bordeaux – Saint Émilion” or a “Bourgogne – Chablis” which are denominations of origin.
The implementation of the protected denomination of origin system has crowned the large plan of reconversion and restructuration of the Portuguese vineyards started in the 1970s and lately enhanced by the entry of Portugal in the European Economic Community (EEC) and
13
the European Union (EU) in 1986. The main objective has been is to increase the overall potential of the planted area by grubbing-up the vines situated in low-potential areas, to replant them in surfaces more adapted to qualitative wines. An important work has been carried out by national institutions, such as the Instituto da Vinha e do Vinho (IVV, Institute of Vine and Wine), and ViniPortugal, which have worked closely together in order to frame and to improve the production standards. Good practices have been settled and pushed among producers to guide and to orientate the national production toward quality. Combined with the implementation of clearer and more efficient rules, this qualitative approach has led to a diminution of the total wine production since the 1970s, working at improving the overall quality of the production.
Graph 3. Evolution of the Portuguese wine production (1883 – 2012)
This driving policy had also been aiming at adjusting the production to a reducing and changing consumption. Indeed, the consumption per capita had been diminishing from 72,5 liters per person and per year in 1970 to 65 liters in 1990 and 42 liters in 2013.1 The consumption appears today as more diversified (white, rosés, sparkling) and qualitative, pushing the producers to innovate and to work strongly on qualitative standards. Indeed, the
1 Source: CVR Lisboa and Alexandre Barata : Percursos e Representações sobre o Consumo Excessivo de
Álcool: Um Estudo Exploratório na Grande Área de Lisboa
14
shift of the production toward quality is confirmed by the nature of the production: from 2004 to 2014, the Table wine production, the lowest quality of wine, has plunged by -42% while the DOP and IGP productions have remained stable (respectively -1% and +1%).
The total production has remained controlled during the last decade, to present a planted area of about 218 677 hectares in 2014, for a total production of 5,9 million hectoliters, at -5,7% against the 2013’s production (6,2 million).2
Geographically the planted area is mainly stretched on the northern half of the country, as 83% of the national vineyard is situated above the Lisboa’s latitude. The vineyard appears as quite concentrated, as six regions concentrate 93% of it.
Regional strategies and new challenges
The production is also concentrated as four regions (by order the Douro Valley, Alentejo, Lisboa and Minho) account for nearly 70% of the national production. The production is mostly regionally controlled, by the implementation of regional commissions, the CVRs (Comissão Vitivinícola Regional), which set up the rules and which structure the production of their respective regions through the system of the denomination of origin.
According to their strategies and objectives, we can notice that there are mainly two streams. On one hand, the region of Lisbon considers 9 DOP regions (Encostas de Aire, Óbidos,
Alenquer, Arruda, Torres Vedras, Lourinhã, Bucelas, Carcavelos and Colares) for a DOP
surface representing only 4,70% of the regional vineyard’s surface. It outlines the region’s commitment to recognize and to market the different sub-areas, or “terroirs” existing in the region, and its willingness to value these different characteristics (of soil, landscape, winds orientation, climatic conditions, viticultural methods…). On the other hand, the Minho region recognizes only one DOP area, the famously named Vinho Verde, in much larger proportion, about 76% of its total surface.
We could state that the first strategy is product oriented, as being focused on the differentiation of the products based on their intrinsic features and characteristics, while the second is more market orientated, as it creates a stronger and a more understandable brand mark for the product. Indeed, by labelling and marketing all the region’s DOP products under
15
the same designation, this practice does not highlight the differences of soils, climates and different know-hows that exist in the region. On the other hand, it can definitely create a marketing advantage by the establishment of a strong and renowned “collective brand” that is simpler to market and that consumer can more easily identify, perceive, and recall of. This is especially important and efficient when looking at the export, as foreigners mostly do not know the intra-regional geographical particularities and therefore might not be able to value it.
Therefore, among these strategies and marketing streams, some regions represent a higher contribution to the national DOP surface (Douro, Minho, Alentejo) while others do have a smaller participation (mainly Beiras, Lisboa, Tejo and Setúbal).
After having been developing and implementing the restructuration plan of the vineyard toward the control of the quality, the new challenge for Portugal is now to tackle the issue of low viticultural yield. Indeed, Portugal presents very low yields per hectare, considered as one of the lowest among the European and world wine-making countries. The average returns per hectare are structurally below the Spanish ones, and usually represent half of the French and Italian ones, the third of the German ones and up to a quarter or a fifth of some southern countries such as South Africa or Brazil.3
Thus, it is important to increase the viticultural returns per hectare to raise the producer’s profitability and returns on investment. In the meanwhile, it is also very important to structure the production’s growth in order to avoid a case of wine glut, or oversupply, as it happened in 2007 in Australia. Indeed, the development of the production should be tightly accompanied by promotional and marketing efforts to ensure equilibrated and parallel sales. Indeed, a situation of structural oversupply can bring in tremendous negative commercial consequences. New-Zealand which has been particularly aware of it, has already decreased the authorized yields per hectare to avoid such a situation of oversupply and has firmly warned producers: “If you do not have a contract for each single berry of each single bunch of grapes, do not cultivate it”. Therefore, a coming challenge for the Portuguese production will definitely lie in being technologically able to increase its vitivinicultural yields while maintaining its qualitative strategy and working fiercely on the international markets to avoid any oversupply
16
scenario. This is especially important as Portugal already has a very mature and almost saturated domestic market which would not be able to absorb any important increases in production.
1.3 Study of the Portuguese wine exports
Over the last decade, from 2003 to 2012, the Portuguese wine exportations have known ups and downs, to finally remain stable in volume, at the same level in 2012 than it was in 2003, with almost 3,4 million hectoliters exported (for a production of 5,6 million hectoliters). While the volume exported was remaining stable, the value of the exports has strongly increased by 27%, outlining the better valorization of Portuguese wines on international markets. From 2012 to 2013, the exportations have decreased by 9,6% in volume, while they have increased by 2,4% in value. It confirms the general trend of exporting higher quality products, at better prices, concerning both bulk and bottled wine.
Nevertheless, this increase in value (+27%) has not been following the world trend (+66% on the same period) and therefore the part of Portuguese wine export in the global wine export has been diminishing (from 3,4% in 2033 to 2,8% in 2012).4
1.3.1 Analysis of the exports by type of products and destinations
However, it is also important to put into perspectives the volume exported according to the volume produced to judge the variations. Indeed, the volume exported has been slightly decreasing during the last decade, at a smaller rate than the production did. In reality, the part of the volume exported has been strongly increasing, from 48% of the national production in 2003 to 60% in 2012. This represents a very good figure, as the top three world exporters, Spain, Italy and France, do have smaller rates at the export (40% for Spain, 45% for Italy and 30% for France). It traduces all the efforts putting in by the Portuguese institutions and actors to maintain market shares on international markets while the production has been lowering.
The Portuguese exports are significantly pulled by the fortified wines (46% in value for 24% in volume in 2013). In terms of volume, table wine has the lead with 47% of the volume
17
exported for only 20% in value. Qualitative wine with a denomination of origin (DOP and IGP) accounts for 28% of the exports in volume, for 32,3% in value.5
From 2010 to 2013, the export trend is positive as table wines increased by 21% in volume, and wine with a denomination of origin by 15%. In value, the export of wine with a denomination of origin grew by 28% while the table wine observed a rise of 15%.6
The main destination for Portuguese wines remains the European Union, which accounts for 54,1% of the exports in volume and 56,7% in value, in 2013. The non-European exports have been increasing in volume over the last decade, to reach 45,9% of the total exports (volume) in 2013. It definitely represents a crucial growth leverage for the Portuguese wine exportation and will play a key role in the coming decades. Indeed, from 2010 to 2013, while the part of the European Union has decreased in the value of the exports, from 63% to 56,7%, the part of the non-EU countries has significantly increased from 37% to 43,3%. It traduces the general trend that Portugal is constrained to sell at cheaper prices in the fierce and almost saturated European markets, while it finds opportunities to raise the value of its exports in young and fast-growing markets such as the USA, Canada, Angola or Brazil.
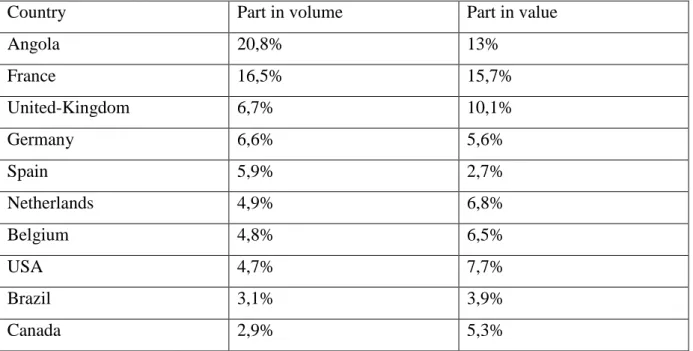
In 2013, in volume and in value, the main destinations at the export were as follows:
Country Part in volume Part in value
Angola 20,8% 13% France 16,5% 15,7% United-Kingdom 6,7% 10,1% Germany 6,6% 5,6% Spain 5,9% 2,7% Netherlands 4,9% 6,8% Belgium 4,8% 6,5% USA 4,7% 7,7% Brazil 3,1% 3,9% Canada 2,9% 5,3%
Source: IVV report 2013, exports, p.52
Table 7. Main destinations in volume and value of the Portuguese wine exports
5
Source : IVV Anuário 2013, exports p.48
18
This first table shows the main destination for Portuguese wines, and outlines the markets in which Portugal works on volume (Angola, France), and markets where the Portuguese actors manage to value their wines at better prices (United-Kingdom, Benelux, USA, Canada).
Looking now at the nature of the exportations by country, we can understand that Portugal is dealing with different types of markets, and the challenges for still wines are very different from market to market.
France for instance is the first billing client, with 15,7% part in value, for 113,731,000 euros in 2013. Paradoxically the rooms for still wines appear quite closed at the light of the nature of the exports. Indeed in 2013, the fortified wines (Porto and Madeira) represented 44,5% of the French imports in volume, for 71,2% in value. Table wine, the lowest quality, accounted for 41% of the imports in volume for only 15,1% in value. Finally, the wine with a denomination of origin accounted for only 12,7% in volume and 11,8% in value.
Most of the table wine is imported in bulks (90%) and will be partly bottled in France before to be re-exported as EU origin wine. The French imports are therefore mostly pulled in by fortified wine and table wine, which account together for 85,5% of the volume.
The second market, Angola, is already very different as the import of fortified wines is negligible (0,5% in volume for 2% in value), and primarily pulled in by table wines (76% in volume) at very cheap prices (43,8% in value). The wine with a denomination of origin occupies still a smaller market share but is much more valuated, as it represents 22,7% of the imports in volume, for 48% in value.
The United Kingdom presents a profile similar to the French wine, as the imports are led in volume and value by the fortified wines (50,3% in volume for 71% in value). Table wines occupied a smaller market share (28,8% in volume for 12,8% in value), and wine with a denomination of origin is slightly more valuated (18,4% in volume for 12,8% in value).
Brazil shows a profile more orientated to quality wine, as wine with a denomination of origin strongly accounts for 73,8% in volume and 76,1% in value. Fortified wines do have a small market share (8,7% in volume for 13,5% in value), and the import of table wine is limited at 16,5% in volume for 9,1% in value.
19
In the USA as well, quality wine is more looked for, as it represents 61,8% of the imports in volume, even if they are still less valuated (for 40,2% of the value). Table wine occupies a very small part with 11,9% in volume for only 4,5% in value. Fortified wines take the lead in value (50,6%) for 24,2% in volume.
These differences in nature of the imports show the importance of understanding the countries’ profile while developing, targeting and customizing strategic marketing plans. The drinking habits, codes and rules of each country and regions should be well mastered to design customized and value-added promotional strategies.
1.3.2 The promotional support of ViniPortugal and Wines of Portugal
The export of Portuguese wines has been supported and promoted by the IVV and ViniPortugal, notably through the creation of the national brand “Wines of Portugal”. The idea behind is to increase the overall awareness and knowledge of Portuguese wines abroad, using the “Wines of Portugal” trademark as a collective brand. The objective is therefore to fill in the gap that Portugal may suffer from, in international recognition, in comparison to its wine producer’s neighbors such as France, Italy and Spain.
For this, three strategic plans had been settled up over the last twenty years: the first covered the period 1997-2008, the second followed from 2009 to 2013, while the new one will run from 2015 to 2017. In this chapter, we will study the results of the efforts deployed through the last programs before to look at the starting new strategic plan and future’s opportunities of growth.
From 1997 to 2008, the support and the budgets were attributed to a sole beneficiary, the national authority, the IVV, which was deploying a strategy of generic promotion with three scopes: the national Portuguese market, the European Union, and third-countries. From 2009, major changes have occurred since the support and the funding are now delivered to twelve different organs, and new axes have been developed. These twelve different organs are mostly represented by the regional wine interprofessional commissions (CVRs). They receive
20
budgets from the national institution and uphold their regional producers in marketing and promotion abroad.
They work in a close collaboration with producers and exporters on the field. They know better their regions, the characteristics, problematics and the challenges of the actors that they represent, hence they are more likely to be able to orientate the promotion.
The second major shift is the division of the actions in two categories: the generic promotion and the information and educational activities. This second category is intended to complete commercial and trade fairs by educational events in order to increase the awareness of Portuguese wines, which should contribute to strengthen the demand in a long run.
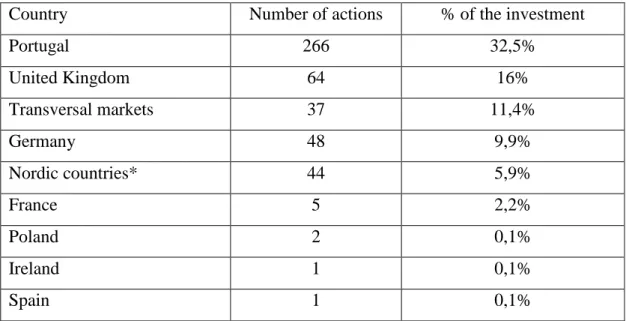
In the European Union, the distribution of the budget and the actions carried out had been as the following during the 2009-2013 period:
Country Number of actions % of the investment
Portugal 266 32,5% United Kingdom 64 16% Transversal markets 37 11,4% Germany 48 9,9% Nordic countries* 44 5,9% France 5 2,2% Poland 2 0,1% Ireland 1 0,1% Spain 1 0,1%
**including Denmark, Sweden and Finland. Source: IVV, 2013
Table 8. Distribution of the promotional events supported by ViniPortugal in Europe (2009-2013)
We can remark that the three main centers of focus in the European Union (and outside of Portugal) are the United Kingdom, Germany and the Nordic markets. The three together represent 156 actions, for 31,8% of the investment. This group of markets represented 16,5% of the Portuguese exportations in volume, and 19,7% in value in 2013.
France, the second destination in volume (16,5%), and the first in value (15,7%) accounts for only 2,2% of the promotional investments, through 5 actions a year. It shows that it is not
21
considered as a key future market by the national institutions, which prefer to invest in other emerging markets.
Other markets such as Poland and Spain present good return on investment: 0,1% of the investment for both, while Spain drains 5,9% of the Portuguese exports in volume and Poland 2,3%.
Concerning the coming plan, from 2015 to 2017, ViniPortugal, through Wines of Portugal, has outlined four different types of markets, by order of priority:
-The Strategic markets: the USA, Brazil and Angola, accounting for 43% of the budget. The priority is to support the brands already present in order to enlarge their portfolio of products and strengthen their presence on shelves, by working closely with local opinion leaders and distributors in order to gain market shares in new states.
-The Handling markets: Germany, Canada, Norway, the UK and Sweden account for 22% of the budget. The idea here is to strengthen the relations with the monopolies regulating the importation of alcoholic beverages (Canada, Norway and Sweden). The objective is also to develop the Wines of Portugal brand image to the specialized press and customers.
-The Diversification markets: China, Hong-Kong, Macau, Japan and Singapore for 15% of the budget. The priority is to implement larger channels of importation and distribution to both on-trade and off-trade channels. Is it also intended to work on the awareness of Portuguese wines among customers by improving the general knowledge of Portuguese products.
-the Observation markets: South Korea, Poland, Russia and Switzerland will not benefit from special marketing investments but they will remain, during this period, under a special program of observation by the information center.
22
Chapter 2. General study of the French wine market
2.1 General analysis of the wine consumption in France
2.1.1 A reducing and shifting general consumption over the last decades
France has always had a very strong consumption per capita. It was, until 2013, the biggest national market in the world, before the USA overcame it. According to the Wine Institute, France remained the first world wine consumer per capita in 2012, with 44,2 liters per year (excluding Vatican). Nevertheless, the wine consumption has been plunging over the last decade: from 130 liters per inhabitant per year in 1960, it decreased to 108 liters in 1975, 55 liters in 2000, and finally 44 liters in 2012, according to studies from France Agrimer and The
Wine Institute.
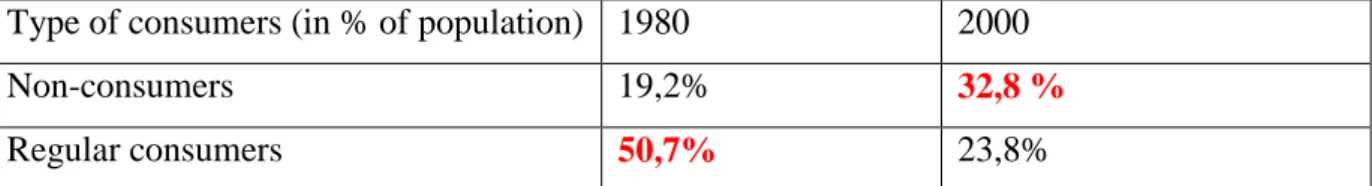
The drastic decrease of the wine consumption per capita can be explained by several factors. Through a report, the French Ministry of Agriculture (France Agrimer) has provided few hints to help in understanding this fall. First of all, there are fewer consumers than before: the part of the non-consumers has significantly increased while the part of regular consumers has been divided by more than two. The table below shows the difference in France, from 1980 to 2000.
Type of consumers (in % of population) 1980 2000
Non-consumers 19,2% 32,8 %
Regular consumers 50,7% 23,8%
Source: France Agrimer
Table 9. Evolution of some consumer profiles in France (1980-2000)
The development of modern and urban behaviors has led to an important social change in the wine consumption. Nowadays, the wine is less and less considered as a “meal beverage” but is more and more consumed as a “festive” beverage by the new generations. This reflects a big change in mentalities and a significant loss in the daily consumption as wine has been losing part of its gastronomical image and representations.
23
The evolution of working conditions has also led to concentrate the workforce in city centers and to shorten the lunch breaks. This relative new scheme has not been favorable to wine consumption. Indeed the combination of shorten breaks, having lunch outside, in “working conditions”, at higher prices practiced by restaurants, has definitely reduced the wine consumption at lunch. According to many observers from the sector, France is losing its typical and traditional lunch meal, when friends and colleagues were taking the time to enjoy their meal and their wine. Oxford French writer Theodore Zeldin said “Companionship has been replaced by networking” and wine is more and more excluded from the tables of quick and efficient business lunches.
This social shift has been accompanied by a cultural change: the weakening of the wine culture transmission. Indeed, it appears that young populations are less and less introduced to wine education as it was a few decades ago. Michel Rolland, a French consultant-oenologist, considered as one of the most important character of the world wine sector, said: “In France,
in spite of being the cradle of the world wine production and the reference in quality, we voted the stupid Évin laws. While the USA still consider wine as a cultural product, we do not”.
Indeed, to complete the loss of cultural image, the wine had fallen in France under the umbrella of the so called Évin laws in 1991. They strongly regulate and frame the promotion of alcoholic beverages to fight against alcoholism. For the opponents to the law, wine should be considered as a cultural product of first interest, and should benefit from another treatment than strong alcohols.
The wine consumption has also strongly suffered from stricter regulations on the allowed alcohol level when driving. In France the limit is now 0,5g/l in blood or 0,25mg/l of exhaled air. It is considered that each glass of wine can raise the blood alcohol level from 0,25g/l. The limit had been pulled down to 0,2 g/l for the young drivers, which does not even allow a glass of wine. This new frame of regulations has definitely changed the wine consumption with respect to the 1960s.
The generational change has brought in a new status for wine with the apparition of a new type of consumers, younger, with an urban lifestyle, for which drinking wine appears as “trendy”. The way of consuming wine differs totally from the old, home traditional consumption where wine was considered as a meal element or a food accompaniment, often drank alone or in couple, on a daily basis.
24
Indeed, the consumption is now more likely to happen outside, in a restaurant, a wine bar, or home for a special dinner with friends or guests. The interest is more in learning, sharing and showing off knowledge, as the wine “connoisseur” would then access to a special status. Those consumers are therefore more opened to information, they are more sensible to marketing campaigns and to labels. They are more likely to try, taste and discover wines from different regions and horizons, while the traditional consumption was mainly local-based and limited in terms of discovery and research of quality.
This new way of consuming has definitely reduced the volume of consumption: in 1980 more than half of adults were consuming wine on a daily basis while today it is only 17% of them. In the meanwhile, the part of the population which never drinks wine had doubled to 38%. Wine is slightly shifting from a very popular to an elitist product. That said, this change has opened new possibilities for new wine regions to enter the markets and to offer new types of products.
In general, the quality of the wine is expected to be higher: in other words we could say that French people drink less but better, and according to the world’s most influent specialists, the wine quality on the market has never been that consistent. This shift in consumption lets a consequent place for innovation in terms of information, communication and marketing.
2.1.2 Regional analysis of the consumption
Until 2012, France was the first world national market for wines (30 million hectoliters consumed in 2012). In 2013 (last data available), it went down to the second world rank, with 28 million hectoliters consumed, behind the USA (29 million hectoliters).
Traditionally the regions where wine is the most consumed are strong producing regions: -The South West, notably the Gironde, around the Bordeaux area
-The South: the Languedoc-Roussillon region, around the area of Toulouse -Montpellier -The South East: Marseille and the Provence-Alpes-Côte d’Azur (PACA) region including the very touristic Cannes, Nice and Monaco area
25
-The Rhône-Valley mostly around the Lyon-Avignon axis
-The North-North/East area, composed by the regions of Champagne (Reims), Bourgogne (Dijon) and Alsace (Strasbourg)
-The Loire Valley, from Saint-Etienne to Nantes
Finally the Centre-Auvergne region and the Île-de-France, Paris big area, are two strong consumer regions among the non-producer regions.
In terms of wine drinking habits, based on the part of the population drinking at least once a week7, the two leading regions are the Loire-Valley, and the axis Toulouse-Montpellier (Midi-Pyrénées and Languedoc-Roussillon), with both rates above the 40%. From 38 % to 40 % follow the regions of Bordeaux-Aquitaine, PACA, Bretagne, Alsace, Poitou-Charentes and Bourgogne. From 36% to 38% are the big pools of population such as the Paris region (Île-de-France), the Rhône-Alpes Valley and the Centre-Auvergne. The Northern low-consuming regions, where beer and cider are trendier, occupy the end of the ranking with rates below the 35%.
Therefore we can outline three different types of consuming regions in France: traditional producer regions (Aquitaine, Midi-Pyrenees-Languedoc Roussillon, Rhône and Loire Valleys, Bourgogne Champagne and Alsace), big pools of population (Paris, Marseille, Lyon Toulouse, Nice) and touristic areas (Paris, Côte d’Azur, Rhône-Alpes Valley).
The consuming habits can vary according to the clusters. Indeed, among the producer regions, the drinking habits are traditional and almost institutional. The consumption rates per capita are the highest. The consumption appears as “rural”, the general knowledge of the own region is high and consumers show a strong preference for the local wines. Consumers are more likely to be loyal to few favorite wineries to which they use to buy wines. The direct sales at the wineries are more important, as people tend to get to know the producers to whom they purchase wine.
This regional-focused consumption is definitely less important in the big pool of populations such as Paris, Lyon or Marseille. First of all, except Lyon, which stands at the northern border of the Rhône-Valley, all these pools are not producing wines.
26
They are therefore definitely more open-minded to wine differentiation, as they have to “import” wines from the different French producing regions. This creates a different mindset which starts automatically a process of prospection, acknowledgment and study of the different wine regions.
Besides this fact, the population is usually younger, coming from all over the country and probably more open-minded to trying different wines. The urban character of the consumption and the city’s dynamism emphasize and support the openness of the wine culture. These big pools of population definitely host the major wine importer and distributer networks.
The “touristic” areas (Paris 29% of the national tourism in value, PACA and Rhône-Alpes 13% for each) are used to receive tourist from all over the world, and must project this openness and wideness through their offers, products and services. The tourism affluence definitely brings a shift in the attitudes, compared to the traditional and rural consuming regions. The customer is more aware, usually more exigent as widely open-minded and looking for nation-wide range of products and offer. Nevertheless and concerning international wines, if the tourist will be happy to see a home-wine in the shelves, he will most likely orientate its purchase toward a national French wine as it is the purpose if its presence. According to wine boutique owners, tourists coming from far away, from countries such as Canada, the USA, Brazil, Russia, China or Japan use to buy only one or two really expensive bottle, looking for the fame and prestige of the brand. Tourists come to buy French wines, and this is why we will not here study the impact of oenotourism, as it mostly concerns the sole offer of national French wines.
27
2.1.3 Analysis of the wine distribution channels in France
According to a study led by MarketLine in 2012, the wine distribution in France was divided as follows among the on-premise and off-premise channels:
Source: MarketLine, French market analysis (2012)
Graph 4. Wine distribution in France by channels of distribution
Off-premise
The large distribution
The large distribution massively owns the off-premise wine distribution in France, accounting for 82% of the national sales in volume.8 Among the national off-premise turnover, 63% of market shares come from hyper and supermarkets, while the hard discount shops account for 19% of the sales (82% in total). The specialized shops, wine boutiques, only account for 5%, while direct sales, at the cellar of the winery represent 4% of the national sales. The sales occurring through the Internet are developing but remain low, with around 1,5% of the market shares.
8
All sources relayed from lenouveleconomiste.fr, article published the 15 may 2014 by Fabien Humbert
http://www.lenouveleconomiste.fr/dossier-art-de-vivre/vin-tranquille-sa-distribution-et-ses-reseaux-22718/
35%
61% 4%
Distribution du vin en France (2012)
On-premise Off-premise Others28
The sales in the large distribution registered a rise of 1,4% in volume in 2013 (in comparison to the precedent year) and of 10,3% in value (in comparison to the last five year’s average). This strong increase has brought the market to 9,7 million hectoliters in 2013, for nearly 4 billion euros. This distribution is quite linear in terms of seasonality, but it uses to encounter special pikes, mostly for the end-of-year celebrations (Christmas and New Year’s Eve) and the traditional spring and autumn wine fairs, very popular in France. These wine-fair periods can account from 10% to 20% of the annual wine turnover.
The average price in 2012 was of 4,05€ per liter, or slightly more than 3€ a bottle, a very interesting average price for such quantities. According to Lionel Manteau, director of the customer department at the wine boutique chain Nicolas, “the French consumption has been divided by three in the last forty years, while the budget allocated to wine has remained the same”.
Therefore, and even in the large distribution, it appears that French people consumes less but value more and more what they drink. Some of the supermarket chains has understood this point, and make particular efforts to enhance their wine areas and shelves. They have notably worked on their on-line presentation and offer, developing a described wine menu and marketing monthly or weekly special offers. They also contracted sommeliers as area manager to value the purchasing accompaniment and the wine experience of their customers.
In terms of offer, the large distribution business model lies in working on high-marketed products, usually coming from large producers and large association of producers (cooperatives) in order to ensure consequent quantities and to enable large-scale margins. So they use to work with nation-wide groups, gathering many different wineries and brand. Their purchasing policies do not really match the local independent winemakers.
The wines boutiques
In wine boutiques, the objectives differ a lot from the large distribution’s ones. Indeed, the customer base appears as less heterogeneous than in supermarkets, where all different layers of the social classes mix up. In general the population that goes to wine boutiques is mostly composed by men, from a certain age and experience, benefiting from a higher purchasing power and with a stronger wine culture and knowledge.
29
Nevertheless, the customer base of wine boutiques is also consequently influenced by its location and will mostly drain the local population around.
Wine boutiques’ business model definitely differs from the large distribution’s one, instead of working on low margins at tremendous scales, through nation-wide products, they usually invest on their prospection and knowledge of the wine culture to deliver precise and customized products to its client. Wine boutiques are usually led and managed by wine lovers, or wine connoisseurs, who are able to seek for their customer’s needs, understand them and to find the products that would fit in. Their therefore value the purchasing experience and accompaniment, working on a more selected offer at lower volumes but higher margins. More and more, wine boutiques go toward specialization in the trendy biological and biodynamic segments, in order to diversify and differentiate their offer from the classic competition. It also exist chains or franchises of wine boutiques, such as notably Nicolas, leading the sector with a network of 480 shops, accounting for 10% of all wine boutique’s turnover in France.
Direct sales
A common practice in France is to purchase wine directly at the cellar of wineries. This distribution channel is the third most important among the off-premise distribution. This business is mainly addressed to wine lovers, who prefer to personally know the producers to whom they buy wine, and to get to know the place, the vineyards, the cellar etc… They are looking for a much more global experience than just buying a bottle. They are usually very loyal customers, and they tend to like building relationships with producers, as the old traditional way in France. The customer base is mostly regional or local population, but there are also more and more people travelling to meet a producer and to purchase wine directly at the cellar: it is called oenotourism. This branch of the sector is always more appealing and wineries are now investing a lot in this area in order to improve at the maximum the customer experience at the winery. Many wineries, especially in the most famous regions, propose now fully-integrated experiences such as hotel resort, gastronomic and wine experiences, tours, visits, spa etc… to attract foreign tourists.
30 The Internet and the auction sales
Two other small distribution channels are the Internet and the auction sales. The auction sales represent a very small part of the market, but it is exploring a niche market: the one of the “Grands crus” and the rarest bottles. A lot of wine lovers, the best specialist of wines are dealing ancient and rare bottles on this market. Good prices for value are usual but a concern remains in the good state of the wine, as the bottles are used to pass from hands to hands.
The Internet remains a very small market share as well (1,5%), but it is still starting, in a traditional sector that requires time to evolve. It will probably develop quickly. The main bottlenecks to this business remain the delays, the shipping costs, the lack of physical presence and explanations, even if websites are now developing on-line live chats with wine experts to deliver advices and guidance to customers.
On-premise
The on-premise distribution channel in France is divided in two sections: the RAT (for
Restauration avec service à Table) including restaurants, hotels-restaurants, cafés-restaurants
and brasseries, and the Hors-RAT, including fast food and cafeterias, hotels without restaurant and bars. They both represent 180 600 establishments in 20149, 108 700 for the RAT cluster and 71 900 for the Hors-RAT’s one.
The restaurants’ turnover in 2014 was of 43,6 billion euros, the hotel’s without restauration of 18 billion euros and the cafés, bars and night clubs of 5,7 billion euros.
According to the same study, the wine supply represented 18% of the restaurant’s budget in 2013, composed at 11,5% by still wines, and 6,3% for the effervescent and Champagne wines. It represents the second expenditures source after the fresh products (26,5%). On the other side, it accounts (still in 2013) for 21% of the restaurant’s turnover, representing interesting added-values. This turnover is mainly supported by still wines (84%), Champagne wines (10%) and effervescent wines (6%).