CLIMATE CHANGE AND IMPACTS IN THE URBAN
SYSTEMS
Marek Smid
A thesis submitted in partial fulfillment of the requirements
for the degree of Doctor in Information Management
August 2018
NOVA Information Management School
Universidade Nova de Lisboa
Information Management
Specialization in Geographic Information
Systems
Joint Doctorate in Geoinformatics: Enabling Open Cities
NOVA Information Management School
Professor Doutor Ana Cristina Costa, Supervisor
Professor Doutor Edzer Pebesma, Co-Supervisor Professor Doutor Carlos Granell, Co-Supervisor
vii
ABSTRACT
Urban systems are not only major drivers of climate change, but also impact hotspots. The processes of global warming and urban population growth make our urban agglomerations vulnerable to chain reactions triggered by climate related hazards. Hence, the reliable and cost-effective assessment of future climate impact is of high importance. Two major approaches emerge from the literature: i) detailed spatially explicit assessments, and ii) more holistic approaches consistently assessing multiple cities. In this multidisciplinary thesis both approaches were addressed. Firstly, we discuss the underlying reasons and main challenges of the applicability of downscaling procedures of climate projections in the process of urban planning. While the climate community has invested significant effort to provide downscaling techniques yielding localised information on future climate extreme events, these methods are not widely exploited in the process of urban planning. The first part of this research attempts to help bridge the gap between the communities of urban planners and climatologists. First, we summarize the rationale for such cooperation, supporting the argument that the spatial scale represents an important linkage between urban and climate science in the process of designing an urban space. Secondly, we introduce the main families of downscaling techniques and their application on climate projections, also providing the references to profound studies in the field. Thirdly, special attention is given to previous works focused on the utilization of downscaled ensembles of climate simulations in urban agglomerations. Finally, we identify three major challenges of the wider utilization of climate projections and downscaling techniques, namely: (i) the scale mismatch between data needs and data availability, (ii) the terminology, and (iii) the IT bottleneck. The practical implications of these issues are discussed in the context of urban studies.
The second part of this work is devoted to the assessment of impacts of extreme temperatures across the European capital cities. In warming Europe, we are witnessing a growth in urban population with aging trend, which will make the society more vulnerable to extreme heat waves. In the period 1950-2015 the occurrence of extreme heat waves increased across European capitals. As an example, Moscow was hit by the strongest heat wave of the present era, killing more than ten thousand people. Here we focus on larger metropolitan areas of European capitals. By using an ensemble of eight EURO-CORDEX models under the RCP8.5 scenario, we calculate a suite of temperature based climate indices. We introduce a ranking
procedure based on ensemble predictions using the mean of metropolitan grid cells for each capital, and socio-economic variables as a proxy to quantify the future impact. Results show that all the investigated European metropolitan areas will be more vulnerable to extreme heat in the coming decades. Based on the impact ranking, the results reveal that in near, but mainly in distant future, the extreme heat events in European capitals will be not exclusive to traditionally exposed areas such as the Mediterranean and the Iberian Peninsula. Cold waves will represent some threat in mid of the century, but they are projected to completely vanish by the end of this century. The ranking of European capitals based on their vulnerability to the extreme heat could be of paramount importance to the decision makers in order to mitigate the heat related mortality. Such a simplistic but descriptive multi-risk urban indicator has two major uses. Firstly, it communicates the risk associated with climate change locally and in a simple way. By allowing to illustratively relate to situations of other capitals, it may help to engage not only scientists, but also the decision makers and general public, in efforts to combat climate change. Secondly, such an indicator can serve as a basis to decision making on European level, assisting with prioritizing the investments and other efforts in the adaptation strategy. Finally, this study transparently communicates the magnitude of future heat, and as such contributes to raise awareness about heat waves, since they are still often not perceived as a serious risk.
Another contribution of this work to communication of consequences of changing climate is represented by the MetroHeat web tool, which provides an open data climate service for visualising and interacting with extreme temperature indices and heat wave indicators for European capitals. The target audience comprises climate impact researchers, intermediate organisations, societal-end users, and the general public.
Keywords: urban climate; downscaling; climate change; impact assessment; adaptation
ix
ACKNOWLEDGEMENTS
Completion of this doctoral dissertation was only possible with the support of several people. I would like to express my sincere gratitude to all of them. First of all, I would like to thank my research supervisors, in particular, I am very grateful to Dr. Ana Cristina Costa who always made herself available to clarify my doubts despite her busy schedule. I also hereby acknowledge Dr. Carlos Granell and Dr. Edzer Pebesma. I would like to thank the faculty members of the Institute who very kindly extended their help during various phases of this research, whenever I approached them. I thank Fernando Santa and Dr. Sara Ribeiro. A special thank you goes to Dr. Simone Russo for his scholarly inputs, valuable guidance, and his selfless and unconditional support. I am extremely grateful - Big Thanks! I also very much appreciate the support, care, and patience of Iva and Martin Kulhanek. And last but not least, I am very much indebted to my family who supported me in every possible way.
INSTITUTIONAL ACKNOWLEDGEMENTS
The author gratefully acknowledges supported by the European Commission within the Marie Skłodowska-Curie Actions, International Training Networks (ITN), European Joint Doctorates (EJD) under Grant [number 642332 — GEO-C — H2020-MSCA-ITN-2014].
CONTENTS xi
TABLE OF CONTENTS
1 Introduction ... 1 1.1 Scientific Background ... 1 1.1.1 Climate Change ... 11.1.2 Climate Change and Heat Waves ... 2
1.1.3 Urbanization and Population Boom ... 3
1.1.4 Climate Change and Cities ... 3
1.1.5 Natural Hazard Assessment... 5
1.1.6 Modelling of the Impacts of Future Climate ... 5
1.1.7 Multi-Model Ensemble Problem ... 6
1.1.8 Adaptation and Mitigation ... 7
1.2 Problem Statement ... 9
1.3 Research questions ... 10
1.4 Objectives ... 10
1.5 Thesis outline ... 11
2 Literature Review ... 13
2.1 Downscaling of climate projections ... 15
2.1.1 Dynamical downscaling ... 15
2.1.2 Statistical downscaling ... 16
2.1.3 Discussion of downscaling approaches ... 17
2.2 Climate projections and urban studies... 22
2.3 Discussion ... 26
2.3.1 Linking climate data and urban planning ... 26
2.3.2 Mismatch between data needs and data availability... 29
2.3.3 Climate change adaptation practices and scale interdependency ... 31
2.3.4 Practical bottlenecks for geographers, urban planners or statistics practitioners 31 2.4 Summary ... 35
3 Ranking European Capitals by Exposure to Heat Waves and Cold Waves ... 36
3.1 Data and Methods... 40
3.1.1 Climate Simulations ... 40
3.1.2 Climate Indices ... 42
3.1.3 Spatial Determination of Large Metropolitan Areas ... 44
3.1.4 Ranking Procedure ... 45
3.2 Results ... 47
3.3 Conclusions and Discussion ... 54
4 MetroHeat ... 59
4.1 Purpose ... 60
4.2 Target audience ... 61
4.3 Materials and methods ... 62
4.3.1 Suite of extreme temperature indices ... 62
4.3.2 Success factors and pitfalls... 65
4.4 MetroHeat web tool ... 67
4.4.1 Architecture ... 67 4.4.2 Implemented features ... 68 4.4.3 Data products... 70 4.5 Discussion ... 71 4.6 Conclusion ... 74 5 Conclusion ... 75 5.1 Limitations ... 77 5.2 Future research ... 78 References ... 79 Appendix A ... 109
A-1 Regional and local climate modelling ... 109
A-2 Downscaling procedures ... 110
CONTENTS
xiii A-2.2 Statistical downscaling ... 113 A-2.3 Comparison of statistical downscaling methods ... 119 Appendix B (CWs and relative decrease/increase of HWs/CWs)... 122
LIST OF FIGURES
xv
LIST OF FIGURES
Figure 1 - Scheme of natural hazard assessment (IPCC, SREX, 2001). ... 5
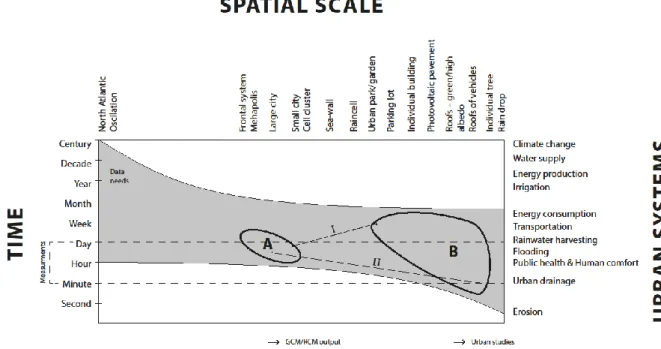
Figure 2 - Mismatch between data needs and data availability in urban systems. ... 30
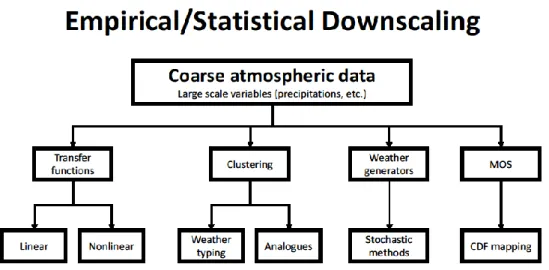
Figure 3 - Main families of empirical/statistical downscaling (adapted from Bi et al., 2017). ... 32
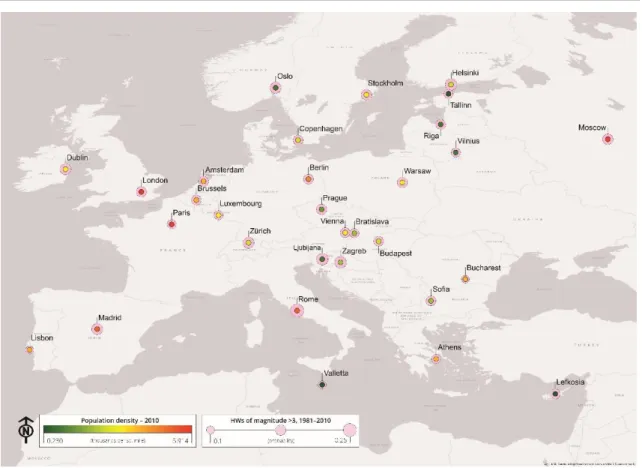
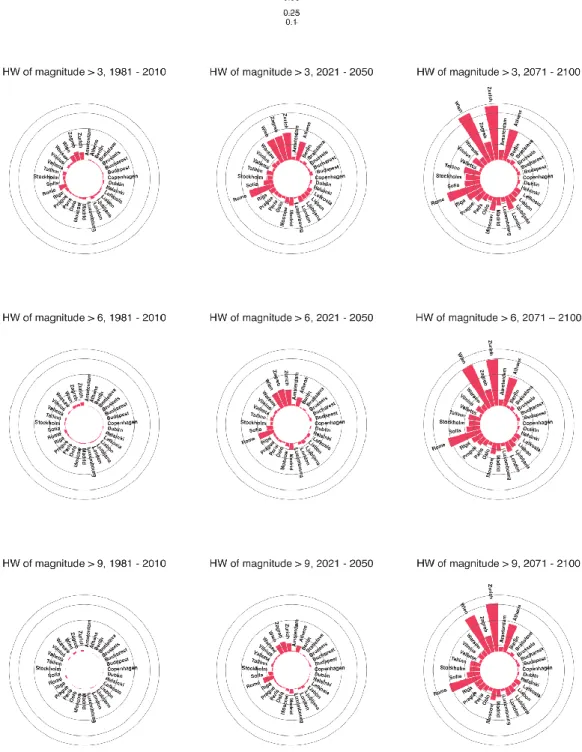
Figure 4 - Target cities with the population density (for 2010) indicated by colors, and severe HWs (magnitude > 3) occurrence between 1981 and 2010 illustrated by proportional sized background symbols. ... 37
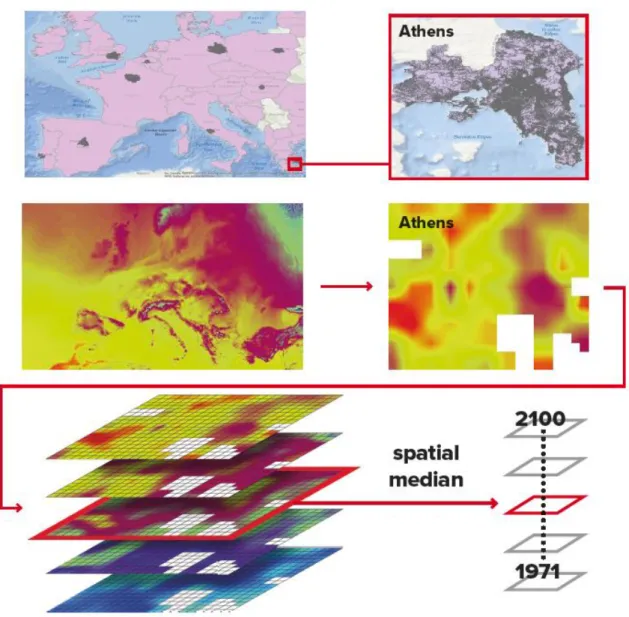
Figure 5 - Goinformatics workflow to determine the larger metropolitan areas and post-processing of the computed HWMId data ... 455
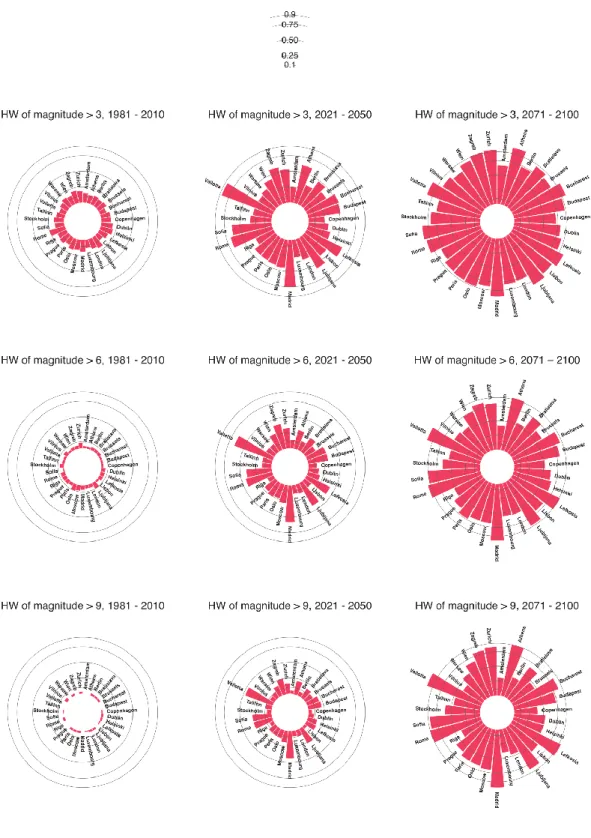
Figure 6 - Probability of HWs occurrence. ... 48
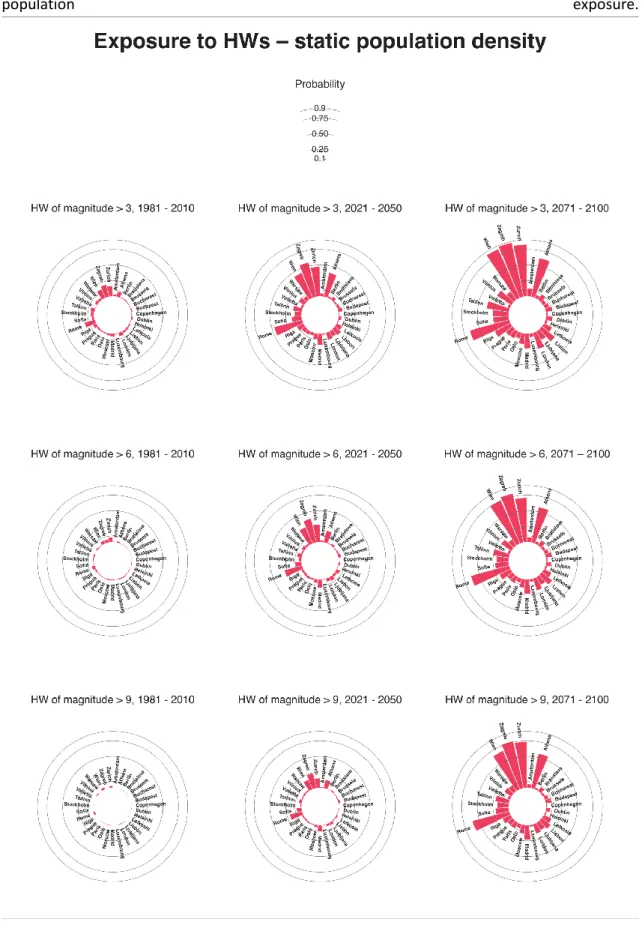
Figure 7 - Exposure to HWs – static population density. ... 50
Figure 8 - Exposure to HWs – dynamic population density. ... 51
Figure 9 - Probability of CWs occurrence... 53
Figure 10 - Different MetroHeat user groups, their purposes and interactions. ... 62
Figure 11 - MetroHeat web tool architecture. ... 67
Figure 12 - MetroHeat user interface and visual disposition of functional features. ... 69
Figure 13 - The examples of different visualization capabilities. ... 70
Figure 14 - Sparklines synchronized visualization. ... 71
LIST OF TABLES
xvii
LIST OF TABLES
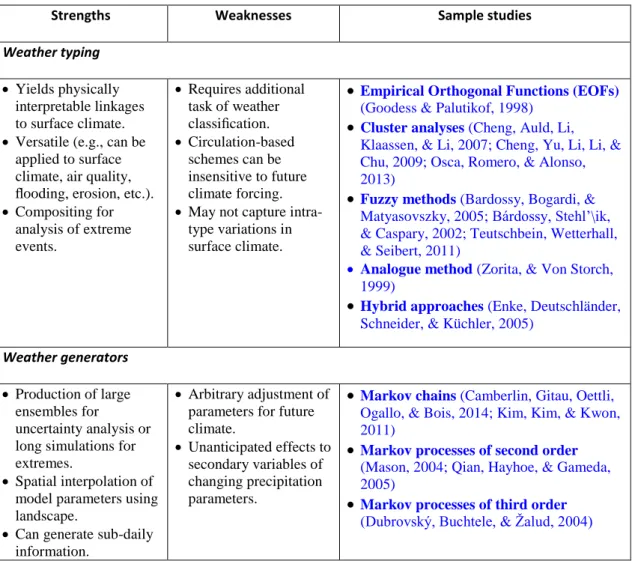
Table 1 - Strengths and weaknesses of statistical downscaling methods with sample studies…..20 Table 2 - The list of utilised GCM/RCMs combinations………..41 Table 3 - Provided climate indices………64
LIST OF ACRONYMS
AHWI – Apparent Heat Wave Index ANN – Artificial Neural Network CC – Climate Change
CCA – Canonical Correlation Analyses CDF – Cumulative Distribution Function CDO – Climate Data Operator
CORDEX – Coordinated Regional Climate Downscaling Experiment CW – Cold Wave
CWMId – Cold Wave Magnitude Index daily DG – Directorates-General
DMI – Danish Meteorological Institute DRM – Disaster Risk Management EC – European Commission
EEA – European Environmental Agency EOF – Empirical Orthogonal Function ESG – Earth System Grid
ETCCDI – Expert Team on Climate Change Detection and Indices EU – European Union
FAO – Food Agriculture Organization GAM – Generalized Linear Models GCM – Global Circulation/Climate Model GDP – Gross Domestic Product
GFCS – Global Framework for Climate Services GIS – Geographic Information System
HSD – Heat-induced Sleeping Discomfort HW – Heat Wave
LIST OF ACRONYMS
xix
HWMId – Heat Wave Magnitude Index daily I/O – Input/Output
IPCC – Intergovernmental Panel on Climate Change IPSL – Institute Pierre Simon Laplace
IT – Information Technology
KNMI – Koninklijk Nederlands Meteorologisch Instituut LAM – Limited Area Models
LCDM – Land Cover Deltatron Model LMA – Large Metropolitan Area MME – Multi Model Ensemble MOS – Model Output Statistics
MRE – Monitoring, Reporting and Evaluation
NASA – National Aeronautics and Space Administration NetCDF – Network Common Data Form)
NRC – National Research Council
NSRP – Neymar-Scott Rectangular Pulses NWP – Numerical Weather Prediction OCT – Open City Toolkit
OECD – Organisation for Economic Co-operation and Development OGC – Open Geospatial Corporation
PCA – Principal Component Analyses PerfectProg – Perfect Prognosis PMP – Precipitation
RCM – Regional Circulation/Climate Model RCP – Representative Concentration Pathways
SMHI – Swedish Meteorological and Hydrological Institute SRES – Special Report on Emission Scenarios
SREX – Managing the risks of extreme events and disasters to advance climate change
adaptation– Special Report
SVD – Singular Value Decomposition SW – Soft Ware Probable Maximum
UCAR – University Corporation for Atmospheric Research UCM – Urban Canopy model
UHI – Urban Heat Island UK – United Kingdom UN – United Nations
UNFCCC – United Nations Framework Convention on Climate Change US – United States
WEF – World Economic Forum WG – Weather Generators
WGBT – Wet-Bulb Globe Temperature WMO – World Meteorological Organization WSDI – Warm Spell Duration Index
INTRODUCTION
1
1 Introduction
1.1 Scientific Background
1.1.1 Climate Change
Continued warming of our planet is evident and captured in the observations. According to (Hansen et al., 2010), during the 1966-2015 period the global annual-mean surface air temperature increased by 0.17 °C per decade. This warming is even stronger (0.21 °C) when only the land area is considered. Another study by (Papalexiou et al., 2018) found a global increase of 0.19 °C per decade during the past 50 years, but with an acceleration up to 0.25 °C per decade in the last 30 years. Climatologist expect the global mean warming to be approximately 2 °C by 2050 (IPCC, 2014; Lelieveld et al., 2016), and the warming by the end of the century might reach up to 5.8 °C (Patz et al., 2005). Even if society acts responsibly and manages to keep global warming under the 2 °C increase relative to preindustrial era, a regional warming might strongly overpass this threshold (Seneviratne et al., 2010). While the global warming rate remains uncertain and climate projections vary in dependency of the used models and scenarios, there is a general agreement on overall warming trend (Tebaldi et al., 2006; Min et al., 2011; Fischer, 2014). Moreover, even a relatively small rise in average global temperature triggers significantly more severe extreme events (Katz et al., 2002; Russo et al., 2015). It was demonstrated by (Diffenbaugh et al., 2007) that severity of the hottest months and days of the year already increased.
Zhang et al., (2011) reported that since 1950 more than 70% of the sampled global land area undergone a significant increase in the occurrence of temperature extremes. A recent study utilizing data of about 9000 globally placed stations shows positive trends in the approximately 80% of studied area (Papalexiou et al., 2018). Moreover, in some regions, the exceedance of the 90th percentile of daily temperatures relative to the 1961–1990 reference period is expected to occur in 70% of the time for the last three decades of this century (Russo & Sterl, 2012; Zhang et al., 2011).
A general warning can be found for mid latitudes (Fischer et al., 2013), and more specifically for the Mediterranean area (Patz et al., 2005; Russo et al., 2014; Papalexiou et al., 2018), Western and Southern US (Patz et al., 2005), Indonesia. Africa, and both Americas (Russo et al., 2014), and Europe (e.g. Lhotka et al., 2018; Russo et al., 2014; Papalexiou et al., 2018) large portions of Russia (Russo et al., 2015), or Australia, Nepal, Maymar, portions of China, Kazakhstan and Mongolia (Papalexiou et al., 2018). When the severe RCP8.5 scenario became a reality, the northern part of Brazil was also found to expect to suffer extreme heatwaves regularly (Russo et al., 2014). In fact, the heat impacts in Latin America (and generally in all humid regions) will be more severe, which is confirmed by modelling when the humidity is taken in the account (Russo et al., 2017). In contrary, Alaska, north-east Australia, and northern parts of Norway, Sweden and Finland show decreasing trends (Papalexiou et al., 2018).
INTRODUCTION
2 Nearly all the regions exhibit stronger warm extremes and weaker cold extremes (Zhang et al., 2011), and warming is projected to accelerate in the future with steep growth in numbers of warm days and nights (Lelieveld et al., 2016). In the future, the increased persistency of large synoptic phenomena in the atmosphere might cause higher extreme temperatures and more severe heat waves (Barriopedro et al., 2011; Tomczyk & Bednorz, 2016; Pereira et al., 2017). The extreme climate events and their associated risks represent a more serious threat to natural and human systems than the changes in climatic mean (Weber & Sonka, 1994; Easterling et al., 2007; Meehl et al., 2000; Tebaldi et al., 2006; Zhou et al., 2004; Zwiers et al., 2011; Mekasha et al., 2014; Seo et al., 2016).
1.1.2 Climate Change and Heat Waves
The Intergovernmental Panel on Climate Change (IPCC) have confirmed that the trends in global temperature experienced over the last century cannot be explained solely on the basis of inherent variability of the climate system (Houghton et al., 2001). Since then, many others have started to argue about the importance of anthropogenic influence in this process. The World Meteorological Organization (WMO, 2015) states that from 79 scientific studies published in the Bulletin of the American Meteorological Society in a period between 2011 and 2014, the majority confirmed that extreme meteorological events were magnified by anthropogenic factors. However, regardless of what is the real trigger in that phenomenon, climate change is a fact and society needs to address this issue and its consequent threats. The Met Office Hadley Centre, HadCRUT4.4.0.0, (Morice et al., 2012) projected that the global average temperature would probably cross the symbolic threshold of 1 °C above the pre-industrial era in 2015. This scenario was recently preliminary confirmed by WMO (WMO, 2015). Worldwide, the period between 2011 and 2015 has been the warmest on record with the highest global average temperature estimates most likely assigned to year 2015. The warming of 2015 is a flag of great importance because it represents global warming of 1 °C (UK Met Office, 2015), which represents the half of internationally agreed limitation in order to avoid dangerous climate change (UNFCCC, 2011). According to WMO, this is caused by an extremely strong El Nino phenomenon, which is itself a result of greenhouse warming (Cai et al., 2014).
The last five years were outstanding in terms of occurrence of many extreme meteorological events – the heat waves in particular. Only in 2015 major heat waves have stroked India in May and June with average maximum temperatures over 42 °C, and locally exceeding 45 °C, which caused over 2300 deaths (Hussain et al., 2016). Heat waves also occurred in Europe (Duchez et al., 2016), northern Africa and Middle East where many new temperature records were set. In May extremely high temperatures were reported in Burkina Faso, Niger and Morocco. Portugal and Spain were exposed to unusually high temperatures as well. In July, Denmark, Morocco and Iran were affected by heat waves. The month of August brought a heat wave to Jordan and, simultaneously, the city of Wroclaw (Poland) experienced some all-time high temperatures with a peak of 38.9 °C on the 8th of August. The heat spread up over Eastern Europe in September,
and the record high temperatures were exceeded in South Africa on a regular basis in spring 2015 (WMO, 2015).
INTRODUCTION
3 According to the analysis of the last half decade many extreme events, especially those related to temperature extremes, have had resolutely increasing probability of occurrence as an impact of anthropogenic climate change. These probabilities have grown by a factor of 10 or higher in some cases. The most steadily growing increase in these probabilities has been on extreme heat (WMO, 2015).
1.1.3 Urbanization and Population Boom
In parallel with climate change, we are witnessing a population boom and the vast majority will concentrate in large metropolitan agglomerations. In 2007, first time in history, the urban population exceeded the rural one. Therefore, the human kind became predominantly urban based. The number of rural dwellers has been growing since 1950 and it is projected to reach its peak in near future (UN, 2014). However, this report also states that in early twenties of the century, the global rural population will start to decline towards 3,2 billion in 2050.
In 2014, about 3.9 billion people, representing 54% of global population, were urban dwellers. Half of the urban population is resided in small agglomerations up to half-million inhabitants. Roughly one of eight urban dwellers is an inhabitant of a megacity (settlements with population of 10 million or more). The number of megacities nearly tripled since 1990. Currently, we have 28 megacities on the planet, and they are home to 453 millions of people. The United Nations (UN, 2014) projected that by year 2030 there will be 41 megacities on the Earth. In previous decades, the largest agglomerations were located in developed regions, but currently the world’s largest cities are in global South. The projections say that by 2050 the urban systems will be home to 66% of global population, representing 6.3 billon urban dwellers (UN, 2014). Cities are commonly associated with the concentration of economic activity, and thus provide its inhabitants with higher level of literacy, education, better healthcare, access to social services and opportunities for cultural and political participation. However, urban environment is nowadays more unequal than rural areas, and a large proportion of urban poor is living in metropolitan systems with sub-standard conditions. The urban poor are especially vulnerable to extreme weather events, and climate change related disasters caused population loss in some cities. If poorly planned and managed, urban expansions may lead to sprawl, pollution and environmental degradation (UN, 2014).
The official outcome of RIO+20 conference entitled “The Future We Want” clearly states that the development of sustainable urban systems is crucial and that cities can lead the way to an economically, socially and environmentally friendly future if the holistic approach to urban planning and management will be applied (UN, 2012).
1.1.4 Climate Change and Cities
Cities and climate change are mutually connected. Urban systems act as important economic hubs and, as such, they are very demanding on resources. Globally, the energy consumption of urban agglomerations is up to 80% of the total energy production, which represents approximately 71–76% of global CO2 emissions (UN, 2014). This illustrates the important role of
4 dioxide emissions. The urbanized areas are not only major drivers of climate change, but simultaneously they are hot spots of climate change impact. Cities are challenged by intersecting issues related to increasing risk of climate hazards and continuing processes of population boom and urbanization (GERISC, 2015).
Providing services like public transport, housing, electricity, water and sanitation is typically cheaper and more environmental friendly in dense urban systems than in rural areas. These services require certain infrastructure. For example, the energy infrastructure leverages economic development, health and quality of life in general. Disruptions of electricity, gas and fuel supplies can have serious consequences on business, healthcare, energy services, schools, street lighting, water treatment and supply, public transport, road traffic management and public safety. For instance, extreme temperature can possibly impact the production of electricity, depending on the particular location and overall context (Rosenzweig et al., 2011). The foreseen life time of infrastructure components varies between 5 and 50 years (in some cases 100 years). Therefore, the current decision making will define not only the safety, but also the contribution of the energy sector on greenhouse warming (IPCC, 2014).
In general, urban systems are hot spots of various disaster risks, which make them especially vulnerable to chain reactions (WEF, 2015). In addition, many of the world’s agglomerations are from historical reasons located in areas highly exposed to multiple hazards (Akbari et al., 1999; Haigh, 2012). Most likely, cities will be increasingly exposed to impacts of climate change in form of urban flooding, flash floods, river floods, and heat waves causing high levels of air pollution triggering serious health problems. Climate change has major economic consequences in form of reduction in labour productivity, disruption of transport systems and significant losses in energy production and its supply chains (Confalonieri et al., 2007).
According to Hartmann et al., (2013), one of the major symptoms of climate change relevant for urban systems are heat waves. Their frequency probably increased since the middle of twentieth century. Constant grown of urban population is driving the replacement of natural vegetation cover by artificial surfaces (EC-DG Environment, 2012). This accelerates the urban heat island phenomenon, and reduces the capacity of natural retention and infiltration of precipitation. One of the most direct consequences is an increase in the seasonal mean temperatures (Collins et al., 2013). Furthermore, increasing temperatures and changes in rainfall variability will only amplify this problem (Revich & Shaposhnikov, 2012). This also indicates that the magnitude of impacts is a function of both the societal and the climatological factors (Rosenzweig et al., 2011). The impact of climate change in urban areas is often worsened by systematic interaction within the inner city environment, and by processes occurring in rural areas surrounding the urban settlements (OECD, 2014). The local authorities should plan and manage the urban system aiming to improve the resilience to extreme meteorological events. Adaptation measures should focus on a regional and local scale in order to solve issues related to the connection of fresh air zones inside and outside the urban agglomeration boundaries (GERISC, 2015). The capacity of local governments to face the impacts of climate change will be tested for the combination of increasing occurrence of natural disasters, insufficient management strategies and rapid urbanization (Tanner et al., 2009). The mortality due to natural disasters is highest in developing
INTRODUCTION
5 countries, while overall economic damage is greatest in developed regions. One of the key reasons of life losses is an absence of efficient early-warning systems (Zommers, 2012).
Under good and qualified management, the process of urbanization can provide an opportunity to economic grown with simultaneous positive environmental development. In the same time, rapid urbanization can strengthen the magnitude of almost every global risk, and local impacts can also be further amplified by unsustainable production and consumption patterns (GERISC, 2015).
1.1.5 Natural Hazard Assessment
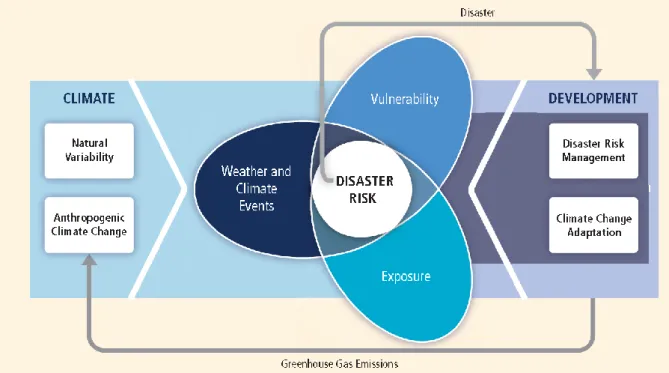
When the climate change and the evaluation of climate impacts are discussed, the assessment of associated potential natural disasters is in the centre of attention. Diagram below (Figure 1) depicts the essential components of assessment of natural hazards related to climate change. Taking to consideration the realistic time and resources constraints, the majority of our effort will be devoted to the key generic steps: “Weather and Climate Events” and “Exposure” components, rather than attempt to execute a complete assessment of potential natural hazards related to climate change.
Figure 1 - Scheme of natural hazard assessment (IPCC, SREX, 2001).
1.1.6 Modelling of the Impacts of Future Climate
The general recipe for estimating the impact of future climate events (not considering the Exposure and Vulnerability parts of Natural Hazard Assessment) consists of deployment of the ensemble of numeric physical models, establishing the robust metrics able to detect the extremes of interest, and the interpretation of obtained results. The members of a Climate
6 Model Ensemble should be ideally validated against reliable observational datasets or, for data scarce regions, against reanalyses products (so-called hind cast procedures). When the model runs for a historical period are found valid, also the future projections are considered as a reliable base of future climate behaviours assessment. Regarding the future periods, considering that our planet is undergoing global warming and local climate exhibits increased variability, the models have to incorporate future scenarios reflecting the directions and magnitude of changes in the evolution of the climate variables relevant to climate impacts of interest. The numerical models provide the simulated climate variables (e.g. daily maximum near-surface temperature, daily precipitation, etc.) but the bigger impacts are commonly associated with the occurrence of extreme events, for example, the prolonged periods of extreme heat or drought. For that purpose, robust and understandable Climate Indices have to be deployed to consistently capture the impacts (e.g. Zhang et al., 2011). The definition of extreme in long time-span is challenging – current extremes are likely to become the future norms (Argüeso et al., 2016). Moreover, the climate indices should be chosen from widely utilized indicators to allow for comparison amongst the studies. For example, in plain words, the term “Heat Wave” can mean various different things (Zhang et al., 2011). The suit of selected climate indices also should be aligned with the purpose of the study. Nevertheless, generally, the climate indicators represent the quantification of climate related natural hazards.
1.1.7 Multi-Model Ensemble Problem
Multi-Model Ensembles are broadly defined as a set of model runs originating from structurally different models. In context of climate ensembles, the projections come from numerical models parametrizing or resolving the selected relevant process. Various types of climate ensembles are recognised, for example, the superensembles (contain more sets of initial conditions for each particular model), or the perturbed physics ensembles (composed from multiple runs of single model but with different settings of parameters) (Tebaldi & Knutti, 2007). The principle that using a combination of multiple models outperforms any single projection or forecast is anchored on the assumption that errors tend to cancel out in the ensemble, when the individual members are independent. Thus, with increasing number of simulations, the overall uncertainty should decrease. The usage of this approach is not at all limited solely to the domain of climate and meteorological science. The examples manifesting the improvement in skill, reliability and consistency of prediction can be found in the public health sector (Early warning system for Malaria occurrence (Thomson et al., 2006)) or in agriculture (crop yield projection by (Cantelaube et al., 2004). The ensemble problem is also related to the field of machine learning, where, for instance, all the trees of random forest can be seen as an individual members of a large ensemble.
To understand why are climate Multi-Model Ensembles (MMEs) somewhat particular, the model structure and model uncertainties should be addressed. Undoubtedly, the different groups around the world develop different circulation models relatively independently. However, there is a whole list of unavoidable similarities. For instance, the parallel developed models aim to provide similar resolution and thus they cannot resolve (therefore they have to parametrize) the same physical phenomenon. The theoretical arguments derived from state-of-the-art physics are likely to be the same. Additionally, the computational methods (including the same known shortcomings) are unavoidably common to many circulation models (Tebaldi, 2007). On the top
INTRODUCTION
7 of that, in the spirit of open science, especially in case of successful models, the entire model components are open and therefore borrowed by other modelers in order to improve and speed up their own development efforts. All abovementioned is resulting in presence of the persistent bias in climate MME (Tebaldi, 2007).
When designing the model, certain choices have to be made and they may implicitly exhibit uncertainty. This uncertainty is difficult to capture by changing parameters within a single model. Such an uncertainty contains not only the theoretical aspects like assumptions, simplifications or choices in parametrizations of physical processes, but also the implications of practical decisions such as numerical aspects of the choice of the grid, the resolution or the truncation. These abovementioned uncertainties are attributed to model structure (Tebaldi & Knutti, 2007). In order to understand and quantify the uncertainty in climate change projections, the structural uncertainties should be deeply investigated. Without such an evaluation it is not possible to guarantee that results do not strongly exhibit artefacts of the individual structures. This represents the strongest argument supporting the utilization of ensembles of different models (Tebaldi & Knutti, 2007). In climate modelling, the total uncertainty is composed of partial uncertainties of completely different nature and origin: firstly, natural fluctuation emerging in climate in the absence of any radiative forcing of the planet. This uncertainty is commonly referred to as the internal variability of the climate system. Secondly, the response uncertainty. It is a model uncertainty in the response to the same radiative forcing. Thirdly, we recognize uncertainty originating in scenarios for future emissions of greenhouse gases, related to potential anthropogenic influence based on the future socio-economic and technological evolution (Hawkins & Sutton, 2012). The proportional influence of all three abovementioned components of uncertainty depends on the prediction lead time and also varies with spatial and temporal scale (Räisänen & Palmer, 2001).The model and scenario derived uncertainties play an important role in long term predictions (e.g. many decades) at regional and larger scales. On the other hand, in context of projections covering upcoming one or two decades at regional spatial scale, the model uncertainty and inner-variability are the most influential (Hawkinson & Sutton, 2012). It should be noted that in the context of climate MME, the uncertainty due to inter model variance and the internal variability of each model should be kept separated. This recommendation is based on the fact that the first mentioned component is not a fundamental property of the climate system, whilst the second one is (Hawkins & Sutton, 2012). Understanding the uncertainty in climate modelling is crucial not only in order to be detected, quantified and attributed, but also for purposes of the adaptation and mitigation planning (Deser et al., 2012).
1.1.8 Adaptation and Mitigation
It is important to describe the concept of sustainable city in terms of efforts towards urban development satisfying environmental, socio-cultural and economic needs of inhabitants, in order to highlight the interactions of mitigation and adaptation measures when applied at different scales (Georgescu et al., 2015).
Strategies to mitigate negative impacts of urbanization on the environment (e.g. urban heat or air pollution) commonly account for direct modifications of surface's properties and surface energy balance (Oke, 2006). For instance, covering the roofs with high albedo materials
8 increases the reflectance and therefore, diminishes the heat storage and consequent sensible heat (Akbari et al., 1999). Furthermore, deployment of highly permeable concrete or tarmac also decreases the amount of heat stored in urban fabric and enables larger surface evaporation (Stempihar et al., 2012). The urban green rises the intensity of the latent heat fluxes and provides direct shading from the vegetation canopy (Dimoudi & Nikolopoulou, 2003). Moreover, in the mitigation and adaptation portfolio, recent technologies complement above-mentioned well established methods (Georgescu et al., 2015). Specifically, these technologies encompass utilization of phase change solar energy storing materials (Santamouris et al., 2011), photovoltaic pavements and canopies (Golden et al., 2007) and waste usage for power generation purposes (Persson & Werner, 2012). In the city context, deployment of these technologies may change water and surface energy cycles, which subsequently mitigates the urban heat island (UHI) effect and therefore, reduces an energy demand and green gas emissions (Georgescu et al., 2015). Also, the anthropogenic heat when put in use for power generation, can be seen as an energy-saving opportunity (Salamanca et al., 2014). The physical principles behind those processes and impacts of related adaptation approaches are well known at various spatial extents, but multi-scale impacts on urban systems need further investigation (Georgescu et al., 2015).
When choosing an appropriate adaptation strategy, the scale interdependency should be considered. Certain approaches (e.g. green roofs) provide micro-scale benefits, where most of the profit is given to selected stakeholders concentrated in vicinity of building rooftop. In contrary, the urban planners should be aware of synoptic and global climate because those may significantly narrow down the portfolio of applicable micro-scale solutions (Georgescu et al., 2015). For instance, in urban systems periodically exposed to dust storms, the effect of installation of highly reflective roofs will be significantly lowered by decrease in albedo due to fine particle deposition (Getter & Rowe, 2006). Moreover, climatological impacts occurring at the larger scale may unexpectedly influence a metropolitan system. For example, high reflectivity can detrimentally influence a hydrology cycle in urban area and as such cause decrease in regional-scale precipitation (Bala & Nag, 2012). Specific climatic conditions predefine effective adaptations. The strategies should be harmonious with large spatial sustainability context. Hence, for example, utilizing non-native flora (aiming for local temperature reduction) with high water demand in arid zones may result to reduction in city water supply (Ruddell & Dixon, 2014). According to Georgescu et al. (2015), the balance between localized cooling and water scarcity in cities should be subject to further research.
Even individual building can have decadal or century-times scale impact. Decisions of urban planners also have climate-related spatial impacts and planning process should consider the limits on parallel or concurrent development resulting from scale interdependent phenomena (Mills et al., 2010). Buildings relatively taller than surrounding constructions would alter shading, near-surface temperature and the wind regime which consequently influence the thermal comfort and the air quality in the area, particularly in case of cumulated impacts related to the rapid development. As an example can serve the study of Pearl River delta in East China, which documents the impact of the sum of rapid development onto regional air quality (Lu et al., 2009). The decision makers should be aware of scale interdependency dimension of development in order to optimize strategies across various spatial scales. Georgescu et al. (2015), clearly states
INTRODUCTION
9 that not all the adaptation and mitigation measures should be given an equal weight across all spatial scales. In addition, there is still demand for deeper analysis, tool development and coordinated efforts, which should rise from the collaboration between global climate and urban communities and related disciplines.
Downscaling methods have been proposed to obtain regional and local-scale weather and climate data. Many well established researchers clearly state that there is a strong need of finer scale information on climate elements, particularly in areas of complex topography and with highly heterogeneous land cover (e.g. Giorgi et al., 2001; Mearns et al., 2003; Wilby et al., 2004). Describing in more detail the areas where information is needed, authors typically provide examples such as coastal areas, river mouths, islands or mountain regions. Until today, the urban systems are not explicitly mentioned on such lists, even though they fulfil the requirements of the above definition (considering the term “topography” in a broader sense). There are examples of successful applications of downscaling methods in the context of urban systems (e.g., Kusaka et al. (2012), predicting heat stress for Tokyo, Osaka and Nagoya metropolises). Furthermore, one of the most frequently mentioned main constraints of the application of downscaling techniques is the lack/scarcity of the observational data within the downscaling domain. However, the city, the smart city in particular, is an example of data generator, and as such perhaps this constrain is not potentially that disconcerting.
The problematics of scientific background is in reality far more complex and include many other aspects, namely the physical principles of heat wave formation, the urban specific temperature related physical processes, urban heat island phenomenon, impacts of extreme heat, the relation of heat and air pollution, physiological functioning of human bodies and health consequences, aging trends in European society, the different impact groups within a urban space, relation between climate science and urban planning, importance of data scale for mitigation and adaptation planning, definition of extremes, the issues of downscaling and comparative ranking, and the communication of climate change. These topics are addressed in more detail in the following chapters of the thesis.
1.2 Problem Statement
The key messages of previous paragraphs frame the scope and relevance of this study. The planet is currently undergoing a process of climate change and greenhouse warming. The heatwaves are one of the most amplified symptoms of this change. Human kind is currently predominantly urban based, and the majority of ever continuing population growth will take place in urban agglomerations. In warming Europe, we are witnessing a growth in urban population with aging trend, which will make the society more vulnerable to extreme heat waves. In the period 1950-2015 the occurrence of extreme heat waves increased across European capitals. As an example, Moscow was hit by the strongest heat wave of the present era, killing more than ten thousand people. Cities are especially vulnerable to impacts of climate change. Urban systems are not only major drivers of climate change, but also impact hot spots. Furthermore, the impacts are commonly managed in city scale. In the same time, when managed in a sophisticated manner, urbanization can provide an opportunity to mitigate natural risks related to climate change. The prevention, mitigation and adaptation measures are and will be managed by local authorities and commonly at city scale. Therefore, assessing climate
10 change impacts on quality of life and on infrastructures in urban systems is an important area of research. Not only the processes and their impacts on all levels (local, meso and global scale), but also the interactions between those should be subject to detailed analysis. While global and regional climate projections are currently available, local-scale information is lacking. Such a detailed information is crucial for impact assessment studies, particularly in urban areas. The assessment of vulnerability of European capitals to extreme heat could be of paramount importance to the decision makers in order to mitigate the heat related mortality, especially with the foreseen increase of global mean temperature.
1.3 Research questions
This research work adds to the body of knowledge on climate change and impacts in the urban systems by addressing the key question:
• Which are the current and future impacts of extreme temperatures in the main European metropolitan systems?
Three research questions emerge from this general question:
• Which European capitals will be affected by more intense and frequent heat waves towards the end of the century?
• Which European capitals will be affected by more intense and frequent cold waves towards the end of the century?
• How can such information be deployed to different stakeholders (such as impact researchers, city planners, decision makers and citizens) in a simple and effective manner?
1.4 Objectives
The main objective of this thesis is to assess current and future impacts of extreme temperatures in European capitals.
A number of detailed objectives emerge from this general objective:
• To analyse how is the climate information being incorporated into the decision process and urban planning.
INTRODUCTION
11 • To compare the impacts of extreme temperatures in European capitals by taking into
account the population exposure.
• To provide recommendations and tools that can help urban inhabitants, city planners, and decision makers to adapt or mitigate the impacts of extreme temperature events.
In order to address the proposed objectives, the research methodology includes three main stages. First, a thorough literature review and discussion on the multidisciplinary issues involved are undertaken. This stage is crucial, because it is expected to contribute to the selection of appropriate methods, tools and information sources, which may be useful not only in the following research stages, but also for impact researchers and city planners.
Secondly, climate projections data for Europe from Multi-Model Ensembles are collected, and a set of indices of extreme temperatures and heat waves (HWs) and cold waves (CWs) indicators are computed. A ranking procedure is then proposed, accounting for the different spatial extents of European capitals, the length of each assessed period (near past, near future, and future), and different impacts’ magnitudes of HWs and CWs. The ranking procedure is then extended to account for population exposure. The results of this research stage are expected to provide further insights on the impacts of extreme temperatures and related population exposure across all the European capitals. Moreover, we expect to raise awareness about HWs, since they are still often not perceived as a serious risk (Keramitsoglou et al., 2017).
Finally, the third stage is dedicated to the development of a Web tool, in order to provide an open data climate service for visualising and interacting with extreme temperature indices and HWs indicators for European capitals. We expect that this tool may contribute to the effective communication of the complex issue of climate change to a large audience.
1.5 Thesis outline
The thesis is organised in five chapters and appendixes. The first chapter discusses the motivation and relevance of the research work, states the objectives and the research questions, and briefly summarises the methodological stages. This chapter ends with a brief overview of each of the main chapters, and their links to published or submitted scientific articles.
Chapter 2 is mainly based on the article “Climate projections and downscaling techniques: a discussion for impact studies in urban systems” published in the International Journal of Urban Sciences (Smid & Costa, 2017). This chapter provides a literature review on the thesis topics, particularly on localised climate projections, emphasising their statistical downscaling, and on the relations between the fields of climate science, urban planning and policy making. Section 2.1 is dedicated to downscaling procedures of climate projections data. Further details on the most significant statistical downscaling procedures are disclosed in Appendix A. In Section 2.2, emphasis is given to recent advancement in urban studies incorporating climate projections. Chapter 2 also includes a discussion on the applicability of climate data to urban planning practice where three main bottlenecks of wider utilization of localized climate projections in planning of adaptation and mitigation measures and urban design in general are formalized.
12 Chapter 3 is an extension of the submitted article “Ranking European Capitals by Exposure to Heat Waves and Cold Waves”. This section presents the research on the impact of future heat waves and cold waves in 31 European capital cities using an ensemble of 8 GCM/RCM models under the RCP8.5 scenario from EURO-CORDEX. In section 3.5 we introduce a ranking procedure based on the ensemble predictions, and population density as a proxy to quantify the future exposure. Section 3.6 covers the obtained results. The ranking of European capitals based on their exposure to extreme heat is of paramount importance to decision makers in order to mitigate the heat related mortality, especially with the foreseen increase of global mean temperature. Furthermore, this simple comparative indicator is expected to help communicating the global, complex and impersonal issue of climate change locally thus contributing to raise awareness and call for action.
Chapter 4 is devoted to the Web tool developed as an integrated part of the Open City Toolkit (OCT) of the Geoinformatics: Enabling Open Cities (GEO-C) project [642332 — GEOC — H2020-MSCA-ITN-2014; http://www.geo-c.eu/]. The architecture, functionalities and the purpose of the Web tool are detailed in this chapter, which is an extension of the submitted article “MetroHeat web tool: a communication service of climate change impacts on temperature over European capitals”.
Finally, Chapter 5 states the conclusions of this study by summarising the main findings and contributions of the research work, and by pointing out a number of suggestions for further research.
LITERATURE REVIEW
13
2 Literature Review
In the warming world, we are witnessing an urban population boom and an increasing number of megalopolis areas (Yang & Chen, 2007). Projections indicate that by 2050 urban systems will be home to 66% of the global population, representing 6.3 billon urban dwellers (UN, 2014). Urban systems act as important economic hubs and, as such, they provide its inhabitants with higher quality of life, including health, cultural and psychological aspects (Murray, 2011). Urbanized areas are not only major drivers of climate change (CC), but are simultaneously hot spots of CC impact, and many of the world’s agglomerations are located in areas highly exposed to multiple hazards (Akbari et al., 1999; Haigh & Amaratunga, 2012). CC impacts on urban systems may cause the stagnation of the state or entire country (Malakar & Mishra, 2017). Climate change has major economic consequences in the form of reduction in labour productivity, disruption of transport systems and significant losses in energy production and its supply chains (Confalonieri et al., 2007). Mortality due to natural disasters is highest in developing countries, while overall economic damage is greatest in developed regions (Kousky, 2014). However, economic development significantly decreased disaster damage (Choi, 2016). All the above-mentioned illustrates the importance of CC impact assessment in urban contexts. While impact assessments are commonly based on the output of state-of-the-art GCM-RCM simulations (Regional Circulation Models nested within General Circulation Model) providing information at scales varying between 12.5 and 50 km, the process of urban planning operates with finer scales exploiting detailed knowledge of neighbourhoods sometimes even at sub-street level. The GCM-RCMs are numerical coupled models describing atmosphere, oceans, land surface, sea ice and interactions among those earth systems. Those models remain essential tools to assess climate change (Fowler et al., 2007). However, their coarse resolution and inability to resolve sub grid scale features limits their usability. A large portion of impact studies operates on scales finer than common resolution of global or even regional model outputs (Wilby et al., 2004).
The strong need for higher resolution climate data for impact assessment is a long time well-known issue (e.g., Cohen, 1996; Kim et al., 1984). This interest originated in the recognized discrepancy of course resolution GCMs (hundreds of kilometres) and the scale of interest of impact studies (an order or two orders of magnitude finer scale) (Hostetler, 1994). The impact applications are highly sensitive to local climate variation, and as such they require information proportional to the point climate observations. The fine-scale variations are parametrized in lower resolution models. The requirement of fine-scale information emerges particularly in regions of complex topography (Giorgi & Bi, 2000; Mearns et al., 2003; Wilby et al., 2004). Describing areas where information is needed in more detail, authors typically provide examples such as coastal areas, river mouths, islands or mountain regions. Until today, urban systems are not explicitly mentioned on such lists, even though they fulfil the requirements of the above definition (considering the term ‘topography' in a broader sense).
When choosing an appropriate adaptation strategy, scale interdependency should be considered. Certain approaches (e.g. green roofs) provide micro-scale benefits, where most of the advantage is given to selected stakeholders concentrated in the vicinity of building rooftops.
LITERATURE REVIEW
14 On the contrary, urban planners should be aware of synoptic and global climate change because this may significantly narrow down the portfolio of applicable micro-scale solutions (Georgescu et al., 2015). For instance, in urban systems periodically exposed to dust storms, the effect of installation of highly reflective roofs will be significantly lowered by the decrease in albedo due to fine particle deposition (Getter & Rowe, 2006). Moreover, climatological impacts occurring at a larger scale may unexpectedly influence a metropolitan system. For example, high reflectivity can detrimentally influence a hydrology cycle in an urban area and as such cause a decrease in regional-scale precipitation (Bala & Nag, 2012). Georgescu et al. (2015), clearly states that not all adaptation and mitigation measures should be given an equal weight across all spatial scales. In addition, there is still demand for deeper analysis, tool development and coordinated efforts, which should rise from the collaboration between global climate and urban communities and related disciplines.
LITERATURE REVIEW
15 GCM-RCM outputs are still insufficient for the analysis of many regional and local climate aspects, such as extremes. GCMs of very high resolution would indeed improve the simulations of regional and local aspects (Christensen et al., 2007), but they remain unreachable due to the enormous computational cost (Fowler et al., 2007), which leads to the accommodation of downscaling techniques (Rummukainen, 2010).
2.1 Downscaling of climate projections
In this study the term “Downscaling” refers to techniques improving spatial or/and temporal resolution of climate projections. Principally any data can be refined by downscaling techniques (Rummukainen, 2010). Coarse GCM output might be satisfactory, for example when the variation within a single grid cell is low or in case of global assessment. The main advantage of information directly obtained from GCM is the certainty that physical consistency remains unattached (Mearns et al., 2003). GCMs are valuable predictive tools, but they cannot account for fine-scale heterogeneity and reflect on features like mountains, water bodies, infrastructure, land-cover characteristics, convective clouds and coastal breezes. Bridging this gap between the resolution of climate models and regional and local scale processes represents a considerable challenge. Moreover, the uncertainties that characterize the GCMs/RCMs are generally aggravated when these models are downscaled, which is the crucial step for identifying the city-specific impacts and, consequently, to identify vulnerabilities. Hence, the climate community put significant emphasis on the development of techniques for downscaling (Fowler et al., 2007). There is no consensual and unique classification scheme to be applied in attempts to comprehensively review and summarize the downscaling techniques. In many studies (e.g. Fowler et al., 2007; Khan et al., 2006; Trzaska & Schnarr, 2014), the methods are categorized into two main groups: Dynamical downscaling and Statistical downscaling. Dynamic downscaling is based on RCMs or fine spatial-scale numerical atmospheric models, such as Limited Area Models (LAM) (Feser et al., 2011; Fowler et al., 2007). Statistical downscaling is based on observed relationships between climate at fine and coarse resolutions that are used to transform global climate models’ output to finer resolution. Alternatively, Mearns et al. (2003) distinguish three groups of approaches: High resolution GCMs; Nested LAM and RCMs; and Empirical/Statistical and statistical/dynamical methods. Within the group of Statistical downscaling, many approaches can be distinguished and classified according to different criteria. For example, Wilby et al. (2004) provide background information and guidance on the application of some Statistical downscaling methods, but also listed alternatives to downscaling techniques (thus somehow excluding those from the family of downscaling methods) including spatial interpolation of grid points (sometimes named ‘unintelligent downscaling’), climate sensitivity analysis (frequently addressed as bottom-up approach), spatial/temporal analogues using historical data and simple change factor (known as Delta method). Giorgi et al., (2001) provide a survey of statistical downscaling techniques focusing on studies published between 1995 and 2000. More detailed review of downscaling techniques in field of climate projections can be found in appendix A.
2.1.1 Dynamical downscaling
In a nutshell, dynamical downscaling represents a group of methods originally used in numerical weather forecasting (Rummukainen, 2010). The first studies establishing the foundation of
LITERSTURE REVIEW
16 regional modelling are Dickinson et al., (1989) and Giorgi & Bates, (1989). Since then, the field has undergone massive development (e.g., Christensen et al., 2007; Feser et al., 2011; Giorgi et al., 2001; Hong & Kanamitsu, 2014; Xue et al., 2014; Wang et al., 2004). Dynamical models address data and physical processes equivalent to GCMs, but at finer scales, and provide results only for selected limited regions of the globe (Trzaska, & Schnarr, 2014). RCMs utilize the same physical-dynamical definitions of the key climate processes as GCMs. Atmospheric fields representing the output of a global model (e.g. surface pressure, wind, temperature and humidity) are loaded into vertical and horizontal boundaries of the RCM. Administering of boundary conditions represents a major challenge of dynamical downscaling (Rummukainen, 2010). The physics-based equations and locally specified data are used to gain regional climate outputs (Trzaska, & Schnarr, 2014). The unresolved inner-cell variabilities are pushed to RCM output rather than fully taken into account. All the inner-cell fine scale processes are approximated in a procedure called parametrization (Rummukainen, 2010).
Two major streams are recognizable in dynamical downscaling. In the first, the resolution is increased over the entire domain of the atmospheric global model (e.g., Christensen et al., 2007). The second strategy is based on the utilization of a global model with variable grid cell size (Fox-Rabinovitz et al., 2008; Lal et al., 2008). This technique maintains a coarse grid over the majority of the globe, but increases the resolution within a particular area of interest (Rummukainen, 2010).
The earlier RCMs resolution used to vary between 100 to 50 km, and at its best 25 km grid cells (Rummukainen, 2010). The more recent development proved that RCMs are capable of delivering high resolution results (20 km or less) (Leung et al., 2003; Mearns et al., 2003). Consequently, increasing resolution also entails increasing computational cost and data volume. RCMs also require a high level of expertise to interpret the results. Moreover, the RCM experiments require high frequency (e.g. 6 hours) GCM fields supply for boundary conditions. These data are not usually stored due to mass-storage demand (Mearns et al., 2003). Due to these practical limitations, the regional dynamical downscaling models remain out of reach for a vast majority of researchers. Accordingly, the emphasis in this paper is given on the application of statistical downscaling techniques.
2.1.2 Statistical downscaling
Statistical downscaling, also known as ‘Empirical/statistical’ or ‘Statistical/dynamical’ downscaling (Mearns et al., 2003), is based on the perspective that regional climate is mainly conditioned by two factors: the large-scale climate and the local/regional features such as topography, land-sea distribution or land use (Fowler et al., 2007; Mearns et al., 2003; Zorita & Von Storch, 1999; Wilby et al., 2004). The large scale climate variables are used as ‘predictors’ to regional or local variables named ‘predictands. Fowler et al. (2007) expressed the essence of the idea of statistical downscaling as the following descriptive equation:
R=F(X)
where R represents the local climate variable which is subject to downscaling, X is the set of large climate variables, and F is a function which relates R and X being validated by the use of point observations or/and gridded reanalysis data. This equation represents the most common
LITERATURE REVIEW
17 form, but other relationships have been used, such as relationships between predictors and the statistical distribution parameters of the predictand (Pfizenmayer & von Storch, 2001), or the frequencies of extremes of the predictand (Katz & Group, 2002).
Statistical downscaling allows one to simultaneously simulate multiple outputs such as precipitation, maximum and minimum temperatures, solar radiation, relative humidity and wind speed (e.g. Parlange & Katz, 2000), which is of great importance, particularly for impact studies (Wilby et al., 2004). It is also possible to downscale predictors independently, but in such a case, it is crucial to ensure that inter-variable relationships remain intact.
The performance of downscaling techniques depends on the choice of the regional domain (Wilby & Wigley, 2000), which in practice is often not considered (Benestad, 2001), and also depends on the regionalization methods (Wilby et al., 2004). Gutiérrez et al. (2013) assessed the performance of statistical methods commonly used for downscaling temperature (including Analogue methods, Weather typing techniques, Multiple linear regression, and Regression conditioned on weather types) with respect to their robust applicability in climate change studies. These authors established a new validation framework exploiting the anomalous warm historical periods. Based on this framework the study concluded that regression methods are the most appropriate in regard to climate change studies. Weather typing was found to underestimate the temperature in moderately warmer conditions and Analog methods, even though best reproducing the observed distributions, significantly underestimate the temperatures for warm periods in comparison with observed values.
Operational weather forecasting approaches, such as Perfect Prognosis (Perfect Prog) (Von Storch et al., 1993) and Model Output Statistics (MOS) (Wilks, 1995, 1999), may also be incorporated in statistical downscaling (e.g., Feddersen & Andersen, 2005). These approaches, also named statistical post-processing methods, have been successful in correcting many deficiencies inherent to forecasts from numerical weather prediction models (Marzban et al., 2006). Both groups of methods use large multiple regression equations, taking advantage of the correlations between predictand and regressors. The classification has its foundation in the character of the employed predictors (Maraun et al., 2010).
Perfect Prog was developed to exploit the deterministic nature of dynamical Numerical Weather Prediction (NWP) models. Large scale observational data are often replaced by the reanalysis products, and the MOS approach is also rooted in NWP (Glahn & Lowry, 1972). The main principle is to exploit statistical relationships between local observational data and simulated output of the numerical model, in order to correct for RCMs errors (Maraun et al., 2010). This approach allows for the impact of a particular dynamical model to be directly reflected at different projections. A limitation of MOS models is that the data set must contain both the historical records of the predictand and the corresponding stored records of the forecast produced by the dynamical model.
2.1.3 Discussion of downscaling approaches
The choice of an appropriate method, or even deciding whether or not it is convenient to apply a downscaling procedure, is often not straightforward (Mearns et al., 2003). Nevertheless, frequently, the global or continental scale information is implemented directly, which negatively
LITERSTURE REVIEW
18 affects the resulting local scale impact maps (Trzaska, & Schnarr, 2014). We acknowledge that the most cutting edge approach to provide future localised climate information is to combine dynamical downscaling with further statistical advancement and bias corrections, as Lemonsu et al., (2013) did when assessing the evolution of Parisian climate. However, these authors had access to a luxurious retrospective dataset with high spatial-temporal resolution for evaluation purposes. Moreover, their skills, expertise and the access to (funding, time and computational power) resources were arguably outstanding. Those advantages are usually associated with larger cities hosting universities and other institutions able to help with such sophisticated planning. Smaller urban systems often struggle to obtain such support, mainly in terms of expertise (Georgi et al., 2006). This is of high importance since consistent long-term urban policy should be based on systematic local participation.
On the other hand, the major practical limitation of regional dynamical downscaling, which is its high computational demand (Mearns et al., 2003; Fowler et al., 2007; Rummukainen, 2010), is not so impactful in the case of empirical/statistical downscaling techniques. Furthermore, statistical downscaling allows to simultaneously simulate multiple outputs such as precipitation, maximum and minimum temperatures, solar radiation, relative humidity and wind speed (e.g. Parlange & Katz, 2000), which is of great importance, particularly for impact studies (Wilby et al., 2004). This flexibility, together with their reachability to wider urban stakeholder communities, determines the focus of this paper in terms of practical bottlenecks discussed below. In the following, we outline the strengths and weaknesses of statistical downscaling approaches.
The climate community invested significant effort to compare the methods of statistical downscaling (e.g., Benestad, 2001; Dibike & Coulibaly, 2005; Huth, 1999; Khan et al., 2006; Schoof & Pryor, 2001; Widmann et al., 2003; Wilby & Wigley, 1997; Zorita & Von Storch, 1999). Schoof (2013) provides a broad overview of statistical downscaling for studies on regional climate change, focusing on downscaling assumptions, choices of predictors and predictands, and methodological approaches.
The strengths and weaknesses of distinct approaches of statistical downscaling are summarized in Table 1. The basic assumption of stationarity is essential, but it also represents the major theoretical weakness of statistical downscaling (Wilby et al., 2004). The concept of stationarity assumes that the statistical relationship between the predictor and predictand will not change in future climate (Fowler et al., 2007). However, there is evidence that this may not occur (e.g. Fowler & Kilsby, 2002; Slonosky et al., 2001). Stationarity of the predictor-predictand relationship can be tested using long records, or a period of different climate characteristics can be used for model validation. Non-stationarity is introduced by an incomplete set of predictors, which does not reflect the low frequency behaviour, or has an inappropriate sampling or calibration period, or by real changes in the climate system. However, in projected climate change, the circulation dynamics may be robust to non-stationarities and the associated degree of non-stationarity is relatively small (Hewitson & Crane, 2006).
When applied to a changing climate, another key assumption inherent to statistical downscaling is that the predictors should ‘carry the climate change signal’ (Giorgi et al., 2001). Selected predictors should be physically meaningful and reflect the processes which subsequently control