Call into the platform!
Merging platform grammatisation and practical
knowledge to study digital networks
Call into the platform! Gramatización de la plataforma y el
conocimiento práctico para estudiar redes digitales
Call into the platform! Fundindo a gramatização da plataforma e
o conhecimento prático para estudar redes digitais
Janna Joceli Omena Doctoral researcher
(Universidade Nova de Lisboa, ICNOVA, iNOVA Media Lab) http://orcid.org/0000-0001-8445-9502
Portugal António Granado Assistant Professor
(Universidade Nova de Lisboa, ICNOVA, iNOVA Media Lab) https://orcid.org/0000-0002-7990-6176
Portugal
Reception date: 31 July 2019 Review date: 2 December 2019 Aceptation date: 13 December 2019 Published: 1 January 2020
To cite this article: Omena, J. J. y Granado, A. (2020). Call into the platform! Merging platform grammatisation and practical knowledge to study digital networks, Icono 14, 18 (1), 89-122. doi: 10.7195/ri14.v18i1.1436
Abstract
This paper introduces a medium-specific research perspective as fundamental basis for Social Sciences and Communication fieldwork. It points to the importance of com-bining knowledge on platform grammatisation with data research practices (capture, mining, analysis and visualization) to study digital networks. That is what we refer to as
call into the platform; an effort to account for the technical fieldwork and digital
meth-ods in an interdependent position to research. In this conception, and through the case of Portuguese Universities on Facebook, we interrogate how digital networks contribute to the research contexts of communication and social sciences studies. To respond to this question, two distinctive digital networks were explored, shedding light in the institu-tional connections and the visual culture of the higher education in Portugal. The first comprises all connections made by a given Page - the act of liking other pages or being liked in return (Page like network). The second is built upon the affordances of computer vision APIs - the connections between images and their descriptive labels (Page timeline image-label network). Beyond providing new ways to design and implement research that can be repurposed for different studies, the main contribution of this study lies in embracing the methods of the medium as key component for digital social sciences.
Key Words:
Social media research; Facebook; Digital methods; Image-label network; Portuguese universities; Vision APIResumen
Este artículo presenta una medium-specific research perspective como base funda-mental para el trabajo de campo de Ciencias Sociales y Comunicación. Basándose en el ejemplo de las posibilidades de las redes digitales, señala la importancia de combinar el conocimiento sobre la gramatización de la plataforma con las prácticas de investigación de datos. Esto es lo que llamamos call into the platform. Asumimos el trabajo de campo técnico como algo que tien uma posicion inter-dependient en la investigación de las ciencias sociales digitales. Este artículo presenta el caso de las universidades portugue-sas en Facebook, uno estudio que interroga cómo las redes digitales contribuem com lá investigación em comunicación. Para responder a esta pregunta, exploramos dos redes distintivas que evidencian sobre las conexiones institucionales y la cultura visual de
la educación superior en Portugal. La principal contribución de este artículo radica en adoptar los métodos del medium como clave para las ciencias sociales digitales.
Palabras clave:
Investigación en redes sociales; Facebook; Métodos digitales; Portugal; Vision apis; Redes digitalesResumo
Este artigo introduz uma investigação específica do meio (medium-specific research) como base fundamental para o trabalho de campo de Ciências Sociais e Comunicação. A partir das affordances de redes digitais, aponta para a importância de combinar os conhecimentos sobre gramatização das plataformas com as práticas de pesquisa com da-dos. O artigo apresenta o caso das Universidades Portuguesas no Facebook, e questiona como as redes digitais podem favorecer os estudos de comunicação. Para responder a esta questão, exploramos duas redes distintas que esclareceram as ligações institucio-nais e a cultura visual do ensino superior em Portugal. Primeiro, a rede de gostos que compreende todas as conexões feitas por uma determinada página. A segunda rede é construída sobre as possibilidades da visão computacional e retrata as conexões entre as imagens e seus rótulos descritivos. A principal contribuição deste artigo é a realização de um exercício prático que reimagina a tecnicidade das redes como componente funda-mental para o estudo da comunicação institucional no Facebook.
Palavras chave:
Mídia social; Facebook; Métodos digitais; Visão computacional; API; Redes digitais1. Introduction
Three visions of approaching the digital have been modelling research in the field of Social Sciences and Communication. The mastering of online question-naires, surveys and interviews to enquiry our digital life comprise the first. Al-though taken as key research methods, the proposal of migrating the social sciences instrumentarium to online does not properly respond to the affordances of digital platforms and data (Rogers, 2015; Marres, 2017). A second vision conforms mixed methods or what Marres (2017) refers as an affirmative approach to grasp the
digi-tal; to treat “digital devices as an empirical resource for enquiry” (p.125) and also to affirm the role of bias in processes like issue formation. Despite well-suited for online environment, this vision remains focused on the instrumental capacities of the digital, just as the first one. For both cases, the appreciation of technology is somehow broken and thus not taking seriously as “hybrid assemblages” (Latour, Jensen, Venturini, Grauwin, & Boullier, 2012). Conversely, this paper foregrounds “the medium-specificity of social phenomena” (Marres, 2017, p. 117); when digital platforms are both object and method of study (Latour et al., 2012).
We bypass the so-called digitization of methods and opt for the deployment of online mechanisms, tools and data for conducting social or medium research (Rogers, 2013; 2015; Marres, 2017). This introduces the third vision for approaching the digital - from
the inside out; the incorporation of the methods of the medium to reimagine social and
medium research (Rogers, 2019). In this line of thought, we account web platforms as
sociological machines (Marres, 2017) that are qualified by digital instruments for data
capture, analysis and feedback. Consequently, we consider digital infrastructures, with Marres (2017) and Rogers (2019), as promoters of methodological innovation.
Drawing on the case of Portuguese Universities on Facebook, this paper points to the importance of combining knowledge on platform grammatisation with data research practices (capture, mining, analysis and visualization). It furthermore considers the no-tion of grammatisano-tion (Gerlitz & Rieder, 2018; Omena, Rabello & Mintz, 2020) as a path to understand how social media delineated, (re) organise and structure online activity through software, e.g. social media application programming interfaces (APIs). That is what we refer to as call into the platform, which points to the functional understanding of web platforms as a fundamental basis for Digital Social Sciences and Communication. There is thus a requirement on technical layers of knowledge about the platform itself entangled with digital methods perspective (Rieder, 2015; Rogers, 2019).
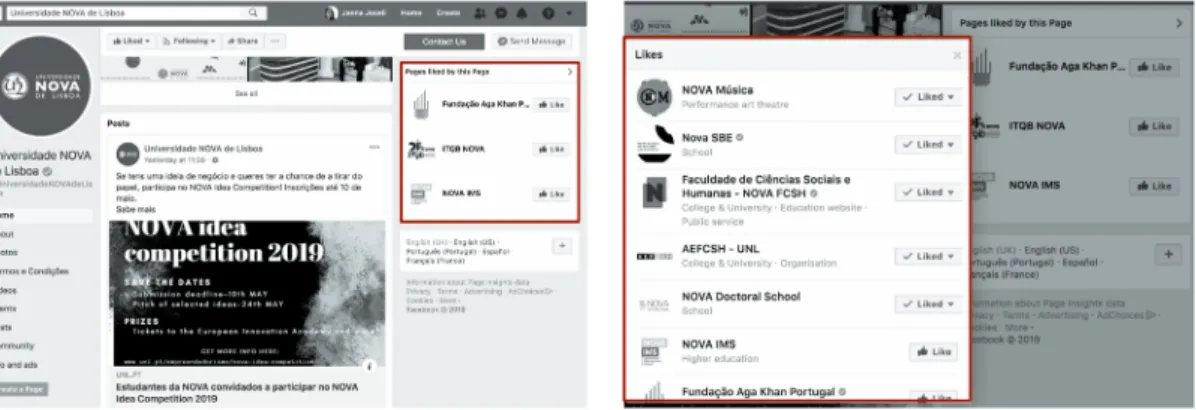
The proposal of calling into the platform to study digital networks, therefore, envisions the infrastructural aspects of Facebook and its forms of grammatising online activity. One way of understanding Facebook grammatisation is to grasp how its Graph API delineate predefined forms of activities and their specific prop-erties. From the existence of a Facebook Page and related metadata1 to very
pecu-liar characteristics, e.g. what a given page “is” by informing the “page category” (e.g. College & University). In platform functionality and comprehension, we ask what one can learn from the connections between Facebook pages (through likes) and from a list of (timeline) image URLs.
We further raise questions on the affordances and limitations of Facebook as source for digital Social Sciences research through the exercise of reading digital networks. What can be studied from single page like connections? What can we foresee from a historical dataset of images featured in Facebook Pages timeline? How to reima-gine platform grammatisation to study the institutional communication of Portuguese Universities? To address these challenges, two distinctive networks2 will be explored
shedding light in the institutional connections and the visual culture of the high-er education in Portugal. These networks emhigh-erge from diffhigh-erent situations: one afforded by Facebook Graph API (the like network of Facebook Pages) and another afforded by digital data (the timeline image-label network3). The first (see Fig
1) comprises all connections made by a given page; the act of liking other pages or being liked in return (a monopartite network). The second is built upon the affordances of computer vision APIs in describing large images datasets, and the advantages of software and data for building and plotting a network of images and their descriptive labels (a bipartite network).
Given this scenario, we take the visual affordances of networks and data rela-tional nature as an analytical framework (Venturini, Jacomy, Bounegru, & Gray, 2018; Venturini, Jacomy, & Pereira, 2015; Venturini, Jacomy, & Jensen, 2019; and Omena, Chao, Pilipets et al. 2019). Thus, overlooking statistical metrics, we argue with Venturini and Rogers (2019), that digital social sciences research
through web platforms, should always be research about these platforms. That is
to say: one cannot study society through a web platform without studying the platform itself. In what follows we operationalise research about Facebook as a form of grasping the institutional connections and visual culture of Portuguese Universities through this platform.
2. Material and Methods
The material presented in this paper is part of a larger research project about the Portuguese Universities on Facebook, which started in March 2017. Since then, and following the advantages of API research (Venturini & Rogers, 2019), the pub-lic page metadata of the 14 pubpub-lic universities in Portugal and one private (see Table 1) have been collected and archived through the application Netvizz4
(Ried-er, 2013). The list of 15 universities complies with the Council of Deans of Por-tuguese Universities – CRUP, that lists all PorPor-tuguese Public Universities and the Portuguese Catholic University (the oldest private higher education institution in Portugal). CRUP represents more than 80 percent of all students enrolled at Portu-guese universities.
Facebook Page ID was the entry point for data collection, advanced by the Netvizz modules Page Like Network and Page Timeline Images. Table 1 shows the number of extracted pages for each Like Network (crawl depth 1), with data ex-traction on March 2019, and the number of all timeline images collected. This latter dataset is a substantial and representative sample because it brings together all images uploaded by the 15 Portuguese Universities: from each page created time to March 2018.
Page Created
Time
University Page ID Extracted pages from Page Like Network Module Number of extracted images from Timeline Im-ages Module Feb 2009 Universidade do Porto 51541308379 69 pages 1272 images Sep 2009 Universidade da Beira Interior 143419211198 42 pages 1719 images Mar 2010 Universidade Católica
Portuguesa 342519554742 16 pages 528 images
Sep 2010 Universidade de Aveiro 114882798568553 23 pages 1055 images Oct 2010 Universidade de Coimbra 159654804074269 4 pages 66 images Apr 2010 ISCTE – Instituto Universitário
de Lisboa 116726201675273 152 pages 616 images
Jan 2011 Universidade de
Trás-os-Montes e Alto Douro (UTAD) 110296129010034 391 pages 7054 images Mar 2011 Universidade do Algarve 190354481008389 528 pages 279 images Feb 2011 Universidade do Minho 111501795592752 121 pages 2731 images May 2011 Universidade Aberta
de Portugal 157257697673304 128 pages 982 images
Jan 2012 Universidade Nova de Lisboa 331782250179584 33 pages 365 images Feb 2012 Universidade de Lisboa 263694373699158 53 pages 562 images Nov 2012 Universidade de Évora 398588126903994 149 pages 2772 images Feb 2014 Universidade dos Açores 1696811123898577 1 pages 1813 images Jul 2014 Universidade da Madeira 590410784413143 48 pages 784 images
Total of pages and images: 1.758 pages 22.598 images Table 1: List of Portuguese Universities according to Facebook Page IDs, created time by
Facebook Page Transparency, and the outputs of data extraction through Netvizz5.
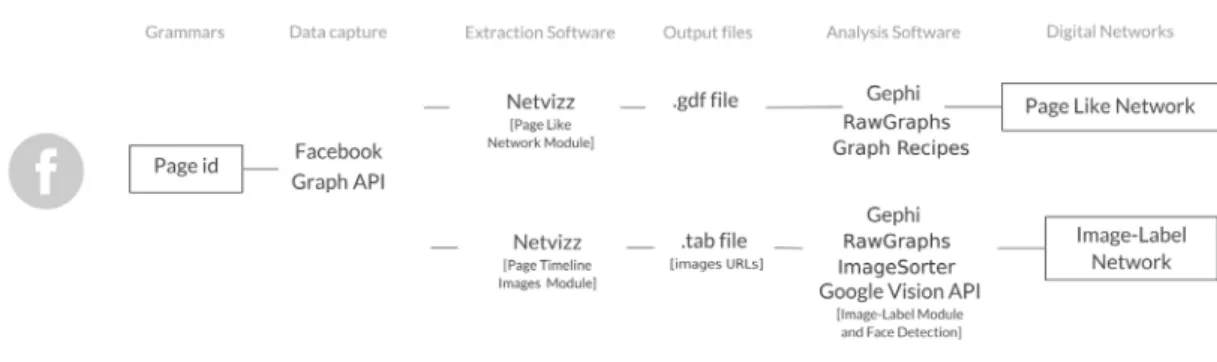
The research design visual protocol6 is explained as follows (Figure 1). The entry
points for collecting data were page ids. Through calling the Facebook Graph API, Netvizz returns both tab. and gdf. files that contains metrics and data afforded by Facebook Platform (e.g. Reactions button, post published date, comments). Some of these metrics were attached to node attributes (e.g. page category, post-activi-ty, fan count, talking about count) or edge property (the act of like connects pag-es) within the like network, others facilitated the process of building up an image network (e.g. a list of image URLs). For data analysis and visualization we used
Ge-phi (Bastian, Heymann, & Jacomy, 2009), and Graph Recipes7, for the image-label
network we relied also on python scripts: one for interfacing with Google’s Vision API8 and other for plotting images into svg. files, the Image Network Plotter9.
For the automated image content analysis, the option was Google´s Vision API due to its descriptive capacities which tend to higher levels of specificity when labelling large image datasets, and when compared with other vision APIs such as IBM or Microsoft (Mintz et al., 2019). To analyse 22,594 images generated by Portu-guese Universities, two particular properties of Google’s computer vision API were chosen: the description of images and the detection of face expressions - namely
label and face detection. For this latter, RawGraphs (Mauri, Elli, Caviglia, Uboldi, &
Azzi, 2017) and ImageSorter10 served as important tools to analyse, navigate and
visualise the results related to face detection.
Figure 2: Research protocol diagram: combining the knowledge of platform grammatisation with
the praxis of data capture and data analysis for studying Portuguese Universities Digital Networks.
For the scrutiny of the two distinctive digital networks (page like and image-la-bel networks), we relied mostly on visual network analysis (Venturini et al., 2015; 2019; Omena, Chao, Pilipets et al. 2019). This approach draws our attention to the visual affordances of the networks, rather than focusing only on statistical metrics. The position, size and colour of nodes are fundamental aspects in this analytical process, as well as the spatialization of the network, here provided by
ForceAtlas2. This force-directed algorithm, commonly used for studying networks emerged from social media, helps in the interpretation of data by creating a bal-ance state in the spatialization of the network (Jacomy, Heymann, Venturini, & Bastian, 2014). Modularity calculation (Blondel, Guillaume, Lambiotte, & Lefebvre, 2008) was also used to identify clusters: the detection of institutional interests within the like network and the different modes of visual representations within image-label networks. Adding to that, we took into account a critical framework for reading digital networks (Omena & Amaral, 2019) which simultaneously re-flects technical-practical knowledge on platform grammatisation, the narrative affordances of ForceAtlas2 and Gephi software.
3. Results
Seeing beyond like connections
The analysis of Portuguese Universities Page like network is organised according to an overview of the page’s profile, institutional connections and the narrative thread afforded by the spatialization of the network; by looking at its whole and parts as well as the central and bridging nodes (Latour et al., 2012; Venturini et al., 2019; Omena & Amaral, 2019). The question of clusters’ formations is also ad-dressed, moving to an in-depth analysis of page categories as a path to unveil the universities specific (institutional) interests.
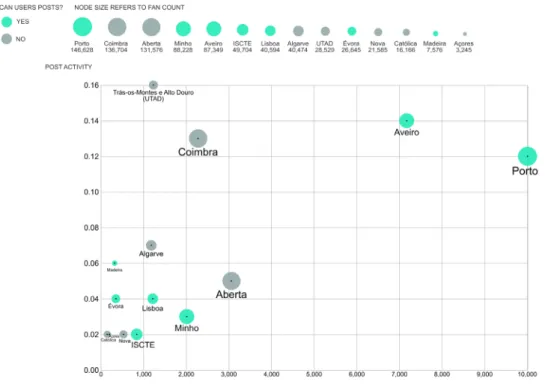
Starting with a general overview, the scatterplot below (Figure 2) displays dif-ferent Facebook metrics (variables) attached to a given university (nodes). Through the size of nodes, we see that Facebook typical forms of measurements can be very contradictory if taken as analytical parameters. For instance, a high degree of post activity may not relate with users’ engagement - talking about count (see the universities of UTAD, Coimbra and Algarve). In the same token, the number of fan count (see Aberta). In other words, a high degree of activity or number of fans not necessarily indicates high levels of engagement. Additionally, we see that more than a half of the universities allow users to post (green nodes), but these publications are kept hidden from their Page timeline.
Figure 3: An overview of Portuguese Universities according to the following Facebook metrics: post activity (posts per hour and based on the last 50 posts); talking about count (attention
metric); users can post (whether a page allows users to publish posts on the page); fan count (number of likes a page has received). Scatterplot made in RawGraphs and edited in Inkscape.
When moving towards the heat map of the Portuguese Universities page like network (Figure 4), we first notice that Media and News Companies (see the nodes among Público and Expresso), followed by the Foundation Calouste Gulbenkian, at the heart of the interests of this network. A second aspect corresponds to a high density of connections that surrounds UTAD and Algarve universities and, with a lower density; ISCTE, Porto, NOVA e Lisboa. A third aspect concerns Madeira University which is detached from the main component within the network and, ironically, geographically isolated. Madeira is an island located in Funchal part of the Maderian archipelago. Following the positioning of the nodes, one final
observation relates to the central role of Universia Portugal (an academic Portal), European Commission, Forum Estudante (an academic and professional-oriented magazine) and the Association of Portuguese Speaking Universities (AULP).
The exercise of replacing edges with a density heat map provides a vision of the whole network and signalise the matters of common concern among Portuguese Universities (Media and News Journal); pointing also to agglomerations (clusters) and central actors.
Figure 4: The heatmap of Portuguese Universities page like network corresponding to March
2019. The networks show 44 visible nodes (out of 1.522) and it contains 18.988 edges. Node size by indegree. Visualization by Graph Recipes (Heatmap dessert) and Gephi.
While recognising the value of the nodes positioned in the centre of the network (under the categories of Media/News Company and Newspapers), these nodes were removed with the intention to better visualise clusters. For instance (see Fig. 5), the emergence of three small clusters attached to the universities of Aveiro, Beira Interior and Minho. Furthermore, new central actors for Portuguese Universities were detected: the General Direction of Portuguese Higher Education, MIT Portugal Program (an inter-national collaboration centre), FNAC Portugal and Futurália (the biggest Education Fair in Portugal). After that, we read the spatialisation of the network through the visual affordances of ForceAtlas211. In the centre of the network, we see the very connected
pages that have a key role to the whole network, while influential actors and bridging nodes12 take part in the mid-term field. For instance, the Portuguese television and
radio channels (e.g. RTP2, SIC TV, Rádio Comercial), AULP and the job opportunities of-fice as bridging nodes. In the mid-term, small clusters can be seeing with connections mainly related to Porto, Nova, Lisboa and Évora universities.
In the periphery (Fig. 5), while the large holes denote less connections with the centre or mid-term zones, the existence of clusters correspond to the particular interests of Algarve, UTAD, Minho, Beira Interior and ISCTE. For instance, faculties, laboratories, student associations, schools. As an isolated element, Madeira only takes part of the network due to the likes the page has received from a medical ser-vice and a high school Facebook Pages. Madeira university itself has only connected to pages featured by “Portugueses in...” or “Portuguese immigrants in...”, evoking to the presence of Portugueses in European, South America and African cities or countries. Those are, somehow, unexpected connections for an official higher-edu-cation Institutional Facebook Page.
Throughout the observation of the shape of edges in large and small clusters, a visual pattern is identified suggesting how clusters are formed. An outward movement from the central node to its neighbours alludes to the fact that cluster formation is substantially based on the act of liking (see Algarve, UTAD and ISCTE in Fig. 5). To confirm the visual hypothesis, we invoked degree centrality to ana-lyse cluster formation within the page like network: by sizing nodes according to the number of connections made by a page (degree), and the total of likes a page received (indegree) or made (outdegree).
Figure 5:Reading the page like network of Portuguese Universities according to the narrative
thread afforded by the force directed layout ForceAtlas2. The nodes categorised by Media/ News Company and Newspapers were removed in order to highlight cluster formation and to
see the universities particular interests. 1.426 nodes,16.125 edges. Node sized by degree.
We thus reimaged page likes (table 2) to define whether cluster formation is based on page activity (by means of liking pages), reciprocity (by a balanced num-ber of likes made vs. received), popularity (by means of receiving likes), or little
reciprocity. In so doing, we avoid misinterpretation in the process of interpreting digital networks, e.g. taking larger clusters as more important or overseeing the role of hidden elements.
Algarve has the largest cluster mainly because it has liked more than 500 pages. In contrast, the small cluster of Minho is based on reciprocal connections, while Porto seems to be very popular among other institutional Facebook Pages. When accounting for how connections are made within a network (data relational na-ture), node size or visibility should only inform different characteristics that serve as basis for understanding the cluster formation and its narrative thread.
Clusters/Page Indegree [liking pages] Outdegree [receiving likes from pages] Formation based on Universidade do Algarve
Universidade de Trás-os-Montes e Alto Douro Universidade de Évora
Universidade Aberta de Portugal ISCTE 178 117 54 19 75 527 390 148 127 151 Page activity [by means of liking pages] Universidade do Minho Universidade de Lisboa Universidade Católica Portuguesa
131 66 37 120 52 15 Reciprocity [by balanced number of likes received and made] Universidade do Porto Universidade de Aveiro Universidade da Beira Interior
Universidade NOVA de Lisboa
140 81 75 66 68 22 41 33 Popularity [by means of receiving likes]
Universidade da Madeira 2 47 Little reciprocity
Table 2: Analysing cluster formation and nodes size on the basis of in-degree and out-degree.
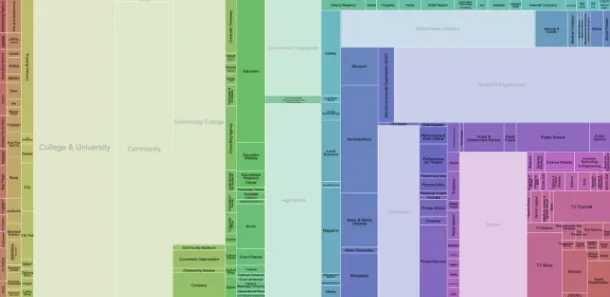
After understanding cluster formation, the Facebook parameter Page Category13
served as form of identifying the interests of Portuguese Universities (see Fig. 6) within the network. Not surprisingly, College & University, School, Community, Non-profit Organization, Community College, High School, Government Organiza-tion, and Media/News Company are the dominant categories within the network. Page category also reveals multiple dimensions of sociality: media and
communi-cation (TV, radio, newspaper, website); culture (museums, library, art, musician/ band); business (company, consulting or advertising or marketing agency, agri-culture service); public services and health concerns (medical and health, hospi-tal); entertainment (golf course and country, cultural centre, movie theatre) and gastronomy (Thai restaurant, dessert shop); public figures and news personality. Even very specific interests like Barbershop, Car Dealership, Shopping Mall, Sports League and Events. However, when searching for political related categories, civic engagement, social movements or causes, nothing was found.
Figure 6: What are the dominant (highlighted in white) and ordinary (in colour) associations linked
to Portuguese Universities? Treemap of Page Categories: size refers to the frequency of appearance.
Back to the mainstream categories, and driven by College & University and School, three groups that stand for the institutional profile and specific interests of each university were detected:
1. Schools from varied districts/regions of Portugal; with especial attention to school groups (Algarve and UTAD), polytechnic institutes (Évora), universi-ty departments or services (Minho).
2. Internal stakeholders; faculties, institutes, departments, research centres, and courses from each university. For instance, Coimbra, Lisboa and NOVA focus on their faculties or institutes, meanwhile Aveiro pays more attention to departments, Beira Interior to students’ nuclei from different courses, and Católica to courses including its branches in Porto and Braga.
3. International universities and Portuguese higher education14 exclusively
represented by ISCTE – IUL, and local learning centres.
Contrasting with this description, Aberta University is uniquely positioned in combination of the three groups due to its balanced range of connectivity. Another affordance of looking at page categories is unfolding official pages that are set aside by the university or the other way around. A good example is the lack of connection between Coimbra University and its Department of Physics, The geophysical and as-tronomic laboratory, The geophysical and asas-tronomic laboratory, Rádio Universidade de Coimbra, and others15. Additionally, the discovery of pages oriented towards
spe-cific audience, e.g. Brazilians students16.
The imagery of Portuguese Universities
What can we foresee from a historical dataset of Facebook images timelines? How to repurpose the methods of the medium to study the visuality of higher educa-tion in Portugal? As natively digital objects, online images have uniform resource identifiers (URLs) that often provides a fragment component preceded by a = (equal sign) which points to an unique identifier (id) of a given image, such as https:// scontent.flis9-1.fna.fbcdn.net/v/t1.0-9/1937274_144956263379_7335679_n.jpg?_ nc_cat=108&_nc_ht=scontent.flis9-1.fna&oh=2a719e0099e71e-4049305a22ea62 8887&oe=5D536D7D. By taking advantage of the image’s URLs afforded by
Face-book Graph API and merging these into the computer vision services of Google Cloud API, we were able to describe and interpret the imagery of Portuguese Universities.
A total of 22.594 images were plotted in a bipartite network, in which nodes are images (90.62%) and labels (9.38%), while edges (161.474 in total) show the connections made by a number of labels that describe one or more images. The
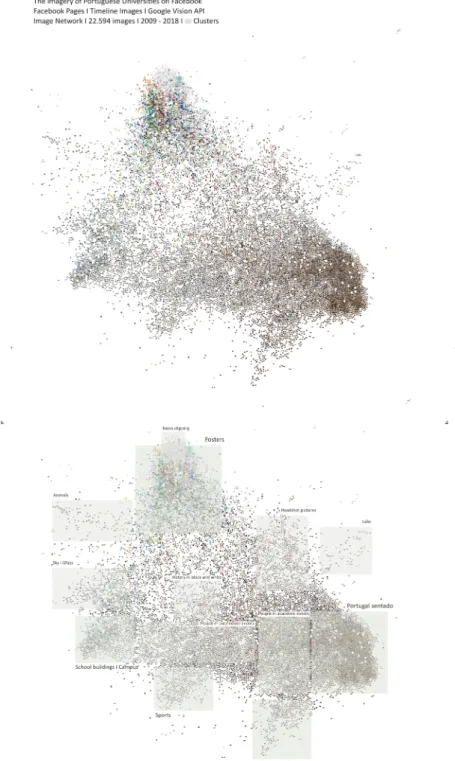
co-occurrences of similar descriptive visual content (labels) informs the position of the images within the network. In alignment with Rose’s (2016) proposal for in-terpret visual material, the first level of analysis enquires about the site of the im-age itself. The multi-sited composition and meanings indicate different formations of institutional interests that are invested in the visuality of the page timelines. What visualities describe this culture? What the dominant visualities and their inherent meanings can tell? What is not there (and why)? Through the computer vision API-based network, in Figure 7, we see the plot of all images featured in the timeline of the 15 Portuguese Universities Facebook Pages, and spatialised according to correlated labels. At the bottom, the analytical exercise of relabelling the machine vision by categorising clusters. In what follows we will present how the scrutiny of timeline images can provided general and specific insights on the visual culture of Portuguese Universities over the years, more precisely from each university page created time to March 2018.
In Figure 7, at the top, we see a quite homogeneous network; except from the strong concentration of images in dark hues on the right side and the colourful ag-glomeration at the top. These clusters represent the most common visual representa-tion associated with Portuguese Universities official Facebook Pages: Portugal sentado (Portugal while seated) and posters. The former is named after a Portuguese journalis-tic expression that relates to the (bad) habit of publishing photos of people seated in press conferences, auditoriums, all kinds of meetings, parliament, scientific conferenc-es, or even sports events. In order words, something to be avoided in the newspapers.
Posters depict all sort of written content: screenshots of news, institutional newsletter,
banners to promote academic events or to celebrate commemorative dates.
In the peripheral zone of the image-label network, the formation of discrete clusters that points to different visualities with a more detailed classification (la-bels) to describe the images, whereas a more generic labelling takes place in the centre of the network. After analysing the different regions of the network, ten clusters were detected beyond those two already mentioned (see Fig. 7): people
in academic events, people in outdoor/indoor events, school buildings, head shot pictures, sports, musical performance, sky and grass, animals, labs, and history in black and white.
In a general view (Fig. 8), the visual depiction of Portuguese Universities main-ly outlines the tedious pictures of audiences (sitting in an auditorium) or keynote speakers in academic conferences. Adding to that, pre and post conference conver-sations, organizers or participants posing to pictures, posters presentations, insti-tutional partnership (e.g. hands shaking or signing contracts) and prize winners. Next to portugal sentado and nearly the center of the network (Fig. 7), there are two other clusters which main focus is people in academic events (outdoor and in-door activities); also, small and big groups chatting or posing for photo, professors or students being interviewed.
Another strong visual identity is the graphical depiction of posters and banners with the most varied type of announcements. Beyond conference, symposiums, workshops, sports or new students related banners, number of likes achieved by a page (fan count), and the celebration around the ‘international day of’ (e.g. water, statistics). A very particular visuality is also uncovered; that is news clip-ping which indicates how Portuguese Universities value when mainstream or tradi-tional Portuguese newspapers headlines or mentions academic research, professors or students. In this scenario, and between 2009 and 2018, we may infer that the dominant visualities of Portuguese Universities conform to people attending events and institutional posters.
The architecture of school buildings earned a place of honour, in particular the overwhelming presence of Institute of Social Sciences (ICS) of Minho University (Fig. 8). We also visualise head shot pictures of local, national and internation-al researchers (perhaps a few number of students), and a full cluster dedicated to university sports (Fig.8). From collective (including wheelchair categories) to individuals’ modalities, the rule seems to be the depiction of victorious teams; images of teams celebrating the victory, athletes on the podium, holding medals or a trophy. At the bottom of the network, the musical performance cluster (Fig. 7), composed by cultural events in the shape of concerts, choirs, orchestra and musicians with their instruments. There is also a group of images putting together because sky and grass are their main visual composition.
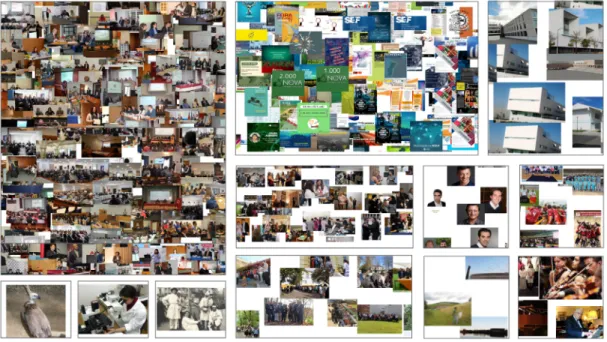
Figure 8: The visual history of Portuguese Universities from 2009 to 2018: image tree map
based on clusters detected in the image-label network (portugal sentado, posters, people in
academic events, people in outdoor/indoor events, school buildings, head shot pictures, sports, musical performance, sky and grass, animals, labs, and history in black and white).
The ordinary visual content (less substantial in numbers) brings wild and do-mestic animals such as birds, caws, awls, tigers, monkey, dogs and cats; the ste-reotype images of labs - namely researchers working with a telescope; and people who made history in black and white pictures. This latter, therefore, basically rep-resents historical photos published by Porto. The visual description and historical perspective of Portuguese Universities seem to lack, however, the everyday life of students and non-stereotypical imagery of scientific research, while it overvalued the academic events and institutional communication through banners and news clipping.
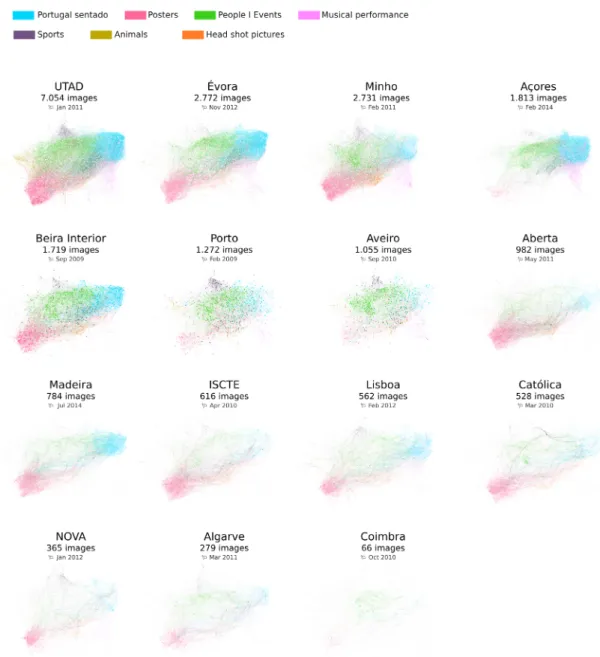
Figure 9: Vision API-based network grid. Seeing the visual patterns of a given
After having a general (but also detailed) perspective on the imagery of Portuguese Universities on Facebook, in the second level of analysis, we questioned about the visual choices and patterns attached to each university. Fifteen bipartite image-label networks were arranged in a grid to respond to this question (Fig. 9). The focus of our analytical observations here is on the presence or absence of colours, which indicates different visual patterns and particularities. In the grid, for each university image-la-bel network there is the number of images in accordance with the page created time. These individual characteristics helps in to situate different networks. The vision API-based network grid provides not only an innovative technique to approach Portuguese Universities’ timeline images but their visual history on Facebook.
As previously described, pictures of sitting audiences, posters and people in academic conferences, correspond to the dominant imagery of the majority of Portuguese universities on Facebook – with exception of Coimbra University. In contrast to this portrayal, the practice of sports and musical performance appear to have little visual space among universities, at least if compared with the main images’ categories. For instance, there is a minor representation in Açores, Lisboa and Católica and no visual mention in Madeira. Aberta University does not contemplate sport practices. Particular characteristics can be seen through the animals cluster which is almost exclusively to UTAD but also represented in Porto and, on a minor scale, in Aveiro. The head shot pictures seems to please all universities, except in the case of Açores, Madeira, Coimbra; these latter do not invest in such style. The vision API-based network grid (Fig. 9) offers an effective and direct way of reading the choices and patterns that constitute the imagery of Portuguese University on Facebook. Such technique can be replicated for other similar studies.
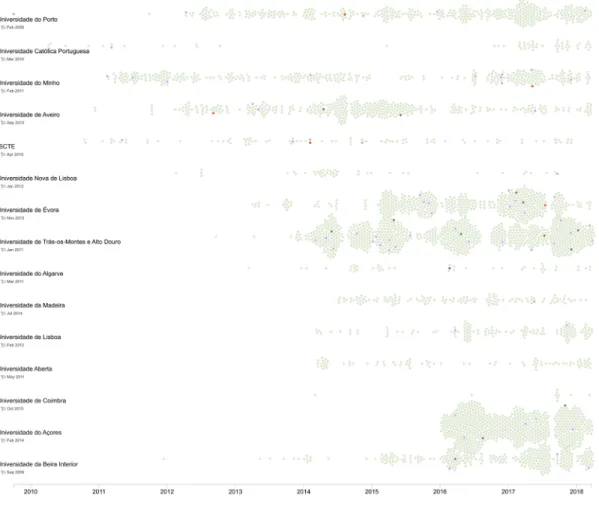
Since people is at the core of the visual communication, the last level of analysis took advantage of the face detection module made available by Google Vision API. The main objective was to repurpose machine vision to assess the mood of Portu-guese higher education. Results demonstrate an overwhelming depiction of happi-ness along the years, but also detect other face expressions such as surprise, sorrow and anger (see Fig. 10). In terms of consistency, and considering the page created time, Porto, Minho, Aveiro, ISCTE and Madeira have recursively publishing images
that contain joy in their respective Facebook Pages. Whereas, in terms of volume and duration, Trás-os-Montes e Alto Douro (775 images), Açores (603 images), Évora (447 images) and Beira Interior (285 images) stand out as the Facebook Pages with more images that are very likely or likely to express joy. But what are those images related to? What would be the motive for great happiness or pleasure? After plotting images separately (see appendices), it was possible to uncover the different motives that drives the visual imagery of UTAD, Açores, Évora and Beira Interior.
The happiness in UTAD is mainly featured by students, staff or professors posing for a picture in varied types of academic events, and the depiction of smiling speakers and audience. There is also joy in head shot pictures, news clipping, people drinking wine, in a few selfies, sports, tech related pics, and the inauguration of new facilities. In a similar spirit, the visuality of Beira Interior has a great focus on students partici-pating in outdoor and indoor events. Although it also brings university staff and board members in these events, some selfies, head shot pictures and the register of awards ceremonies. The smiling audience, the act of posing for pictures in academic events and official ceremonies are also key visual characteristics in Évora, added by the over-whelming presence of students. Other types of events prompt the happy visuality of Açores: official ceremonies to award the best graduated students (both in an auditori-um and in the rectory building); events where the faculty staff and board members get together, e.g. in the rectory building, outdoor picnic. Photos of students in classroom, in the rectory building or in outdoor events are also common.
Beyond the academic events that put together students, professors, staff and board members, there is a common reason that brings joy to the higher-educational environment; the visit of the president of Portugal, Marcelo Rebelo de Sousa. His presence is synonymous of a series of pictures in the Facebook timeline images of UTAD, Açores, Évora and Beira Interior universities. The International Exchange Erasmus Students Network connects also to the joy of Évora and Beira Interior, and although sporting achievement are too little, these images often connect to felicity. When further analysing the other face expressions, the results supplied by com-puter vision can be deceptive. The Facebook timeline images that contain surprise (64 images) do not exactly depict faces showing that something unexpected may
have happened. Rather, we see face expressions that may be tricky for machine learning algorithms, e.g. to raise eyebrows or open and close the mouth when talk-ing or givtalk-ing a presentation. Although useless for detecttalk-ing real surprised faces, the results provided by machine vision demonstrate a type of visuality that should perhaps be avoided in institutional communication; for not offering a pleasant visual identity (e.g. a, b, c, d, e).
Figure 10: Computer vision for seeing the mood of Portuguese Universities over the years
accord-ing to face detection module of Google Vision API. Four main expression were detected as very likely or likely to appear in the universities Facebook images timeline: joy, surprise, sorrow and anger.
The sorrow related images (a total of 14) are mainly groups of students in dif-ferent situations such as: in learning environments when they appear to be very
concentrated and sitting in a small auditorium or standing in a laboratory paying attention to the professor (e.g. in Açores and in UTAD); in academic events (e.g.
1 and 2 from UTAD, and e.g. 3 from Aveiro); or students being interviewed by a television reporter (Algarve). Institutional and academic events also categorise a few sorrow images, e.g. university staff happen to appear in organising or planning activities in an educational event (Beira Interior), a picture zooming in focused audience sitting in an auditorium (Açores), and when a university receives the president of Portugal, Marcelo Rebelo de Sousa who, accompanied by the dean of Évora University (Ana Costa Freitas) and board members, was walking up stairs to enter the university building (Évora). There is also the case of detecting sorrow faces in banners; one promoting an exhibition about the miracles of Nossa Senhora de Fátima constituted by an old black and white photo with three children staring at a camera and looking all sad (UTAD), another with Alfred Hitchcock looking down another filmmaker (Évora).
The five images with anger faces derive from the practice of sports, except for the promotion of the Masters in Theatre of Évora University in 2017. The other cas-es bring winner athletcas-es such as João Paulo Fernandes who get the second place in London Paralympic Games 2012 (Aveiro); the celebration of Porto’s female Rugby team for third place in the European University Games 2014 (Porto); the image of
Minho´s female five-a-side football athletes in the middle of the court celebrating (probably the victory) in 2017 (Minho), or the applications for EA Campus 2014
(ISCTE).
The thick description about face detection, in particular surprise, sorrow and
anger, intentionally calls our attention to the lack of precision and limitations of
computer vision APIs.
Discussion
The study of Portuguese Universities Facebook Pages exposes some practical and institutional implications for both research and communication practices. For
this latter, we should consider that the use of social media for institutional com-munication is indeed a very recent activity: Facebook is a teenager (15 years old) and the oldest Portuguese universities pages on this platform were created in 2009 (Porto and Beira Interior). For the last ten years, Portuguese universities have been learning how to communicate on Facebook, while they use it and rely on its affordances.
However, it also becomes clear that Portuguese universities are using Facebook as just another platform to “shout out” their activities. At the same time, most universities seem to be not spending enough time building their social media net-works or giving attention to some aspects of their missions. Research activities or accomplishments, for instance, are very seldom referred, which means that science communication is practically inexistent. Connection with the outside world is also neglected.
When seeing the dominant images shared by Portuguese universities, we find mostly “Portugal Sentado” (people seated while listening to conferences) and con-ference posters, showing very little imagination and a somewhat careless attitude towards social media best practices and potentialities for communication. By using the same type of photos time and time again, universities are perpetuating the stigma of a boring academic environment. The “institutional” visuality of academia reproduced by Portuguese universities fails in getting advantage of the attention economy of Facebook. In other words: no “clickworthy” and “shareable” content.
From the research perspective, the innovative approach of vision API-based networks shed light on how the universities in Portugal make use of, manage and give priority to their visual content over the years. The digital visual methods adopted here come along with thick descriptions, technical knowledge and prac-tical expertise; highlighting the need of questioning the methods of the medium critically. That is the case of recognising the lack of precision and limitations of computer vision in the analytical process or being aware of the problems with web data (knowing how to deal with it!).
Our proposal of calling into the platform is an invitation to conduct communica-tion and social research through the lens of medium-specificity. Following Latour’s oligoptic vision of society, it derives from the explorations in the context of the device-aware sociology (Marres 2017) and the technical-practical fieldwork. This reality challenges new media researchers to take advantage of the intrinsic proper-ties and dynamic nature of digital platforms, and here lies the main contribution of the article. That is a practical walk-through the possibilities of repurposing the technicity of networks for studying societal (institutional) phenomenon on Facebook. A call for another culture of making research questions and designing research; a call for embracing an open-ended process in which new questions are always welcome.
Acknowledgement
We would like to thank Fábio Gouveia for helping us with sorting specific groups of images in our dataset, facilitating the process of the visual analysis according to
Joy. We thank also the valuable feedback given by Elena Pilipets.
References
Bastian, M., Heymann, S., & Jacomy, M. (2009). Gephi: An Open Source Software for Exploring and Manipulating Networks. Third International AAAI Conference
on Weblogs and Social Media, 361–362.
Blondel, V. D., Guillaume, J.-L., Lambiotte, R., & Lefebvre, E. (2008). Fast unfolding of communities in large networks. Journal of Statistical Mechanics: Theory and
Experiment, 10008(10), 6.
Gerlitz, C., & Rieder, B. (2018). Tweets Are Not Created Equal: investigating Twitter’s client ecosystem. International Journal of Communication. International
Journal of Communication, 12, 528–547.
Jacomy, M., Venturini, T., Heymann, S., & Bastian, M. (2014). ForceAtlas2, a Continuous Graph Layout Algorithm for Handy Network Visualization Designed for the Gephi Software. PloS One (9)6, e98679.doi: https://doi.org/10.1371/ journal.pone.0098679
Latour, B., Jensen, P., Venturini, T., Grauwin, S., & Boullier, D. (2012). “The whole is always smaller than its parts” - a digital test of Gabriel Tardes’ monads.
British Journal of Sociology, 63(4), 590–615.
Marres, N. (2017). Digital sociology: the reinvention of social research. Bristol: Polity Press.
Mauri, M., Elli, T., Caviglia, G., Uboldi, G., & Azzi, M. (2017). RAWGraphs. In
Proceedings of the 12th Biannual Conference on Italian SIGCHI Chapter - CHItaly ’17 (pp. 1–5). New York, New York, USA: ACM Press.
Mintz, A., Silva, T., Gobbo, B., Pilipets, E., Azhar, H., Takamitsu, H., Omena, J.J. & Oliveira, T. (2019). Interrogating Vision APIs. Lisbon. Retrieved from https:// smart.inovamedialab.org/smart-2019/project-reports/interrogating-vision-apis/
Omena, J.J.,Chao, J., Pilipets, E., Kollanyi, B., Zilli, B., Flaim, G., Sívori, H., Ruiven, K., Rademakers, L., Li, M., & Del Nero, S. (2019). Bots and the Black Market of Social Media Engagement. Digital Methods Initiative Wiki. Retrieved from https:// wiki.digitalmethods.net/Dmi/SummerSchool2019Botsandtheblackmarket
Omena, J.J., Rabello, E. & Mintz, A. Digital Methods for Hashtag Engagement Research. Social Media and Society, special issue ‘Studying Instagram Beyond Selfies’, edited by Alessandro Caliandro and James Graham (forthcoming) Omena, J.J. & Amaral, I. (2019). Sistema de leitura de redes digitais multiplataforma.
In: Métodos Digitais: Teoria-Prática-Crítica., edited by Janna Joceli Omena. Lisboa: ICNOVA.
Omena, J. J., Rabello, E., & Mintz, A. (2017). Visualising hashtag engagement: Imagery of political polarization on Instagram. Digital
Methods Initiative Wiki. Retrieved: https://wiki.digitalmethods.net/Dmi/ InstagramLivenessVisualisingengagement
Ricci, D., Colombo, G., Meunier, A., & Brilli, A. (2017). Designing Digital Methods to monitor and inform Urban Policy. Retrieved from https://hal.archives-ouvertes.fr/hal-01903809
Rieder, B. (2013). Studying Facebook via Data Extraction: The Netvizz Application.
Proceedings of WebSci ’13, the 5th Annual ACM Web Science Conference, 346–
Rieder, B. (2015). Analyzing Social Media with Digital Methods. Possibilities, Requirements, and Limitations. Retrieved October 26, 2015, from https://www. slideshare.net/bernhardrieder/analyzing-social-media-with-digital-methods-possibilities-requirements-and-limitations
Rogers, Richard. (2013). Digital Methods. Cambridge, MA: MIT Press.
Rogers, Richard. (2015). Digital Methods for Web Research. Emerging Trends in the
Behavioral and Social Sciences. In Scott R. & Kosslyn S. (eds.), Emerging Trends
in the Behavioral and Social Sciences. Hoboken, NJ: Wiley. Rogers, Richard. (2019). Doing digital methods. Lodon: Sage.
Rose, G. (2016). Visual Methodologies (4th Ed.). UK: Open University.
Venturini, T., Jacomy, M., Bounegru, L., & Gray, J. (2018). Visual Network Exploration for Data Journalists. In B. Eldridge II, S. & Franklin (Ed.), Handbook
to Developments in Digital Journalism Studies. Abingdon: Routledge.
Venturini, T., Jacomy, M., & Pereira, D. (2015). Visual Network Analysis. SciencesPo
Media Lab working paper. Retrieved from https://www.researchgate.net/ publication/278030230_Visual_Network_Analysis
Venturini, T., Jacomy, M., & Jensen, P. (2019). What do we see when we look at networks an introduction to visual network analysis and force-directed layouts. arXiv:1905.02202 [physics.soc-ph] Retrieved from https://arxiv.org/ abs/1905.02202
Venturini, T., & Rogers, R. (2019). “API-based research” or how can digital sociology and digital journalism studies learn from the Cambridge Analytica affair. Digital
Journalism,1-9.
Notes
[1] E.g. Page description, post date of publication, reactions, shares, comments, posts per hour (post_activity), how users interact with or talk about a page (talking_about_account), the total number of likes a page has received (fan_count) and whether users can or cannot post in a Page (users_can_post) https://developers.facebook.com/docs/graph-api/reference/page/ [2] As socio-technical formations, digital networks offer ways of understanding social and
cultu-ral phenomena (including institutional communication).
[3] On image-label networks see the work of Ricci, Colombo, Meunier, & Brilli, 2017; Omena et al. 2017; and Mintz et al., 2019.
2019.
[5] In March 2017, the University of Coimbra had 363 timeline images registered and in March 2018, we detected the page had changed its Facebook ID; from 170094986358297 to 159654804074269. The total of 66 images collected though corresponds to the latter page id and all images were uploaded between 21 June 2013 to 13 March 2017.
[6] Research protocol diagrams presents the entire research process “in a compact visual form” (see work of Niederer and Colombo 2019); it visually informs the research steps advanced by digital methods approach.
[7] https://medialab.github.io/graph-recipes/#!/upload
[8] That corresponds to an expanded version of Memespector originally developed in PHP by Ber-nhard Rieder, and later ported to Python and expanded by André Mintz. Available in: https:// github.com/amintz/memespector-python. See Google Vision API here https://cloud.google. com/vision/.
[9] https://github.com/amintz/image-network-plotter [10] https://visual-computing.com/project/imagesorter/
[11] In practice, this force-directed layout provides a narrative thread that has fixed layers of interpretation but multiple forms of reading (see Omena & Amaral, 2019).
[12] When a node connects nodes of different clusters.
[13] Facebook used to have six broad categories of pages: Local business or place; Company, Orga-nization or Institution; Brand or product; Artist, Band or Public Figure, Entertainment; and, Cause or Community. Each category had a long sub-category list. In July 2019, we verified that the platform now only offers two broad categories of pages: i) Business or Brand and ii) Community or Public Figure. These latter are also constitute by sub-categories but, now, they can only be visible when searched, see https://www.facebook.com/pages/creation/.
[14] For instance, Münster University, University of Groningen, Universidad Carlos III de Madrid, UNED - Universidad Nacional de Educación a Distancia, Universidade da Cidade de Macau, and Portuguese Higher Education: Universidade do Porto, Instituto Superior Técnico, Universidade da Beira Interior, Universidade Lusíada de Lisboa, Escola Superior de Comunicação Social, Uni-versidade de Lisboa, Laboratório de Ciências da Comunicação, ISCTE Business School.
[15] Turismos Universidade de Coimbra, Relações Internacionais Universidade de Coimbra -
Inter-national Office, Sociologia, Universidade de Coimbra, Clube de Robótica da Universidade de
Coimbra.