R E S E A R C H PA P E R
Metagenetic analysis of patterns of
distribution and diversity of marine
meiobenthic eukaryotes
Vera G. Fonseca1,2,3*, Gary R. Carvalho1, Ben Nichols4, Christopher Quince4,
Harriet F. Johnson5, Simon P. Neill5, John D. Lambshead6,
W. Kelley Thomas7, Deborah M. Power2and Simon Creer1
1Molecular Ecology and Fisheries Genetics Laboratory, School of Biological Sciences, Environment Centre Wales, Bangor University, Deiniol Road, Bangor, Gwynedd LL57 2UW, UK,2Centre of Marine Sciences, CCMAR, University of the Algarve, Gambelas, 8005-139 Faro, Portugal,3Zoological Research Museum Alexander Koenig (ZFMK), Centre for Molecular Biodiversity Research, 53113 Bonn, Germany,4School of Engineering, University of Glasgow, Rankine Building, Oakfield Avenue, Glasgow G12 8LT, UK,5School of Ocean Sciences, Bangor University, Menai Bridge, Anglesey LL59 5AB, UK,6School of Ocean and Earth Science, National Oceanography Centre, European Way, Southampton SO14 3ZH, UK, 7Hubbard Center for Genome Studies, University of New Hampshire, 35 Colovos Road, Durham, NH 03824, USA
A B S T R A C T
Aim Meiofaunal communities that inhabit the marine benthos offer unique opportunities to simultaneously study the macroecology of numerous phyla that exhibit different life-history strategies. Here, we ask: (1) if the macroecology of meiobenthic communities is explained mainly by dispersal constraints or by envi-ronmental conditions; and (2) if levels of meiofaunal diversity surpass existing estimates based on morphological taxonomy.
Location UK and mainland European coast.
Methods Next-generation sequencing techniques (NGS; Roche 454 FLX plat-form) using 18S nuclear small subunit ribosomal DNA (rDNA) gene. Pyrosequences were analysed using AmpliconNoise followed by chimera removal using Perseus.
Results Rarefaction curves revealed that sampling saturation was only reached at 15% of sites, highlighting that the bulk of meiofaunal diversity is yet to be discov-ered. Overall, 1353 OTUs were recovered and assigned to 23 different phyla. The majority of sampled sites had c. 60–70 unique operational taxonomic units (OTUs) per site, indicating high levels of beta diversity. The environmental parameters that best explained community structure were seawater temperature, geographical dis-tance and sediment size, but most of the variability (R2= 70%–80%) remains
unexplained.
Main conclusions High percentages of endemic OTUs suggest that meiobenthic community composition is partly niche-driven, as observed in larger organisms, but also shares macroecological features of microorganisms by showing high levels of cosmopolitanism (albeit on a much smaller scale). Meiobenthic communities exhibited patterns of isolation by distance as well as associations between niche, latitude and temperature, indicating that meiobenthic communities result from a combination of niche assembly and dispersal processes. Conversely, isolation-by-distance patterns were not identified in the featured protists, suggesting that animals and protists adhere to radically different macroecological processes, linked to life-history strategies.
Keywords
454 Roche pyrosequencing, environmental metagenetics, macroecology, marine eukaryotes, meiofauna, metabarcoding, microscopic biodiversity, next-generation sequencing.
*Correspondence: Vera G. Fonseca, Zoological Research Museum Alexander Koenig (ZFMK), Centre for Molecular Biodiversity Research, Adenauerallee 160, 53113 Bonn, Germany. E-mail: [email protected]; [email protected]
This is an open access article under the terms of the Creative Commons Attribution License, which permits use, distribution and reproduction in any medium, provided the original work is properly cited.
The copyright line for this article was changed on 16-Oct-14 after original online publication.
I N T R O D U C T I O N
Biological diversity is unevenly distributed over the surface of the planet, and several global patterns of spatial variation in biodiversity have been explored. Such patterns can vary from hotspots to coldspots (highs and lows) of diversity, change with spatial scale and along gradients across space or environmental conditions (Gaston, 2009). There is still no consensus that explains all the diversity patterns found in nature, with assump-tions ranging from niche theory (Tilman, 1982) to neutral theory (Hubbell, 2001). Distribution patterns are understood relatively well in macroscopic organisms such as plants and animals, but are hotly debated in small-bodied taxa (Lambshead & Boucher, 2003), including eukaryotic meiobenthic fauna. For example, the wide or even cosmopolitan distribution of marine meiofauna has previously been considered a paradox, because meiofaunal organisms do not typically have a planktonic larval stage (Giere, 2009). Importantly for the consideration of macroecological patterns and processes, meiofaunal commu-nities are characterized by a breadth of phyla, differing in body size, morphology and life-history strategies, which is predicted to strongly affect patterns of alpha and beta diversity (Giere, 2009), especially in the marine environment where the oppor-tunities for gene flow are high (Palumbi, 1994). Consequently, in-depth analysis of communities that share similar habitats but exhibit high taxonomic and biological diversity provides an insightful opportunity to characterize and interpret distribution trends in microbial taxa, regardless of phylogenetic or taxo-nomic constraints. Here, we exploit such an opportunity to deci-pher the biodiversity and distribution patterns of intertidal microbial marine benthos using next-generation sequencing (NGS) technologies.
The application of NGS sequencing platforms for large-scale environmental studies focusing on homologous taxonomic markers, termed ‘metagenetics’ (Creer et al., 2010; Fonseca et al., 2010), has driven a paradigm shift in environmental microbiol-ogy (Zinger et al., 2011) that has been recently extended to eukaryotes (Fonseca et al., 2010; Stoeck et al., 2010; Bik et al., 2012; Logares et al., 2014) and the expanding field of environ-mental DNA analysis (Hajibabaei et al., 2011; Taberlet et al., 2012; Thomsen et al., 2012; Ji et al., 2013). Many marine habi-tats remain poorly sampled, and several species-rich taxonomic groups, especially smaller organisms, are under-studied (Costello et al., 2006), making it impossible to infer the drivers of diversity and structuring in these groups. Previously, we revealed a novel perspective of meiobenthic diversity at a microgeographical scale (Fonseca et al., 2010), and here we aim to elucidate the structure and drivers of marine eukaryote com-munity across macroecological scales, using the 18S rDNA marker gene. We sampled the marine benthos intensively around the UK, extending to France, Spain and Portugal, and with an outgroup reference site in Africa. Collectively, the data provide unique and important insights into the distribution and diversity of marine meiobenthic eukaryotes that inhabit the spatially constrained but globally important marine benthic biosphere.
M AT E R I A L A N D M E T H O D S Sample collection
Sixty-six marine benthic samples were collected from the low-tide mark using a standard corer methodology (Platt & Warwick, 1988) at 23 sampling stations of sandy sediments around the UK, France, Spain, Portugal and Gambia (Appendi-ces S1 & S2 in Supporting Information) during the summers of 2007 and 2008: 16 sampling sites in the UK; two sites each in France, Spain and Portugal; and one sampling site from Gambia representing a geographical outgroup. Three biological samples,
each composed of a single 44 mm diameter× 100 mm benthic
core, were taken approximately 10 m apart at each sampling site. An additional core was taken for sediment analysis, performed using a Malvern Mastersizer 2000 as in Fonseca et al. (2010). Seawater salinity and seawater surface temperature (SST) values were obtained using the data archives of DEFRA (http:// chartingprogress.defra.gov.uk/) and NOAA (http://www.ncdc .noaa.gov/), respectively.
All sediment samples were immediately preserved in 500-mL storage pots containing 300 mL of DESS (20% DMSO and 0.25 m disodium EDTA, saturated with NaCl, pH 8.0) (Yoder
et al., 2006) and subsequent meiofaunal size fraction and DNA
extraction were performed according to Fonseca et al. 2010, 2011) and Creer et al. (2010), using the whole core from each sample site.
Primer design and PCR strategy
The primers SSU_FO4 (5′-GCTTGTCTCAAAGATTAAGCC-3′) and SSU_R22 (5′- GCCTGCTGCCTTCCTTGGA-(5′-GCTTGTCTCAAAGATTAAGCC-3′) were used to amplify approximately 450 bp of the V1–V2 regions of the nuclear small subunit rDNA (18S rDNA). These primers anneal to regions of 18S rDNA that are highly conserved in meiofauna, and flank a highly divergent region that is used to discriminate operational taxonomic units (OTUs) (Creer et al., 2010). Fusion primers, PCR amplification and 454 sequencing were then executed following Creer et al. (2010) and Fonseca
et al. (2010).
Data analysis and generation of OTUs
Amplicons were generated from 23 triplicate benthic sampling sites from the low-tide zone of marine sandy beaches around the UK, France, Spain, Portugal and Gambia. Sequences generated from four half-plates of 454 Roche GSFLX pyrosequencing
were analysed using AmpliconNoise, which denoises
pyrosequencing data, reducing per-base sequencing errors, through filtering, flowgram and sequence-clustering steps (Quince et al., 2011). Singletons and sequences shorter than 199 bp were discarded; the average resulting sequence size was 200– 220 bp. Chimeras are known to inflate diversity levels (Fonseca
et al., 2012) and were therefore identified and removed using
Perseus (Quince et al., 2011). Denoised and chimera-removed sequences were then used to identify operational taxonomic
units (OTUs). OTUs were calculated using a complete linkage-clustering algorithm, measuring the distance between the most dissimilar members in each cluster, at 96% and 99% identity cut-offs. Given the nature of 18S rDNA intraspecific genetic diversity, potential undetected molecular biological errors and the nature of OTU clustering, 99% OTUs are used here to inves-tigate the distribution of genotypic diversity. Conversely, the AmpliconNoise analysis of a reference nematode community (Porazinska et al., 2009) across a range of similarity cut-offs showed that a 96% similarity algorithm most closely emulated taxonomic species richness. We therefore refer throughout to 99% clustering as the distribution metric and 96% clustering as the richness metric. Taxonomic assignment was performed using megablast against the downloaded GenBank/EMBL/ DDBJ nucleotide database, and OTU annotation was restricted to matches of 90% and higher, using the octupus annotation and parsing toolkit (Fonseca et al., 2010). Sequence data have been deposited in the GenBank/EMBL/DDBJ short-read archive as submission PRJNA185478.
Diversity and community analysis
For direct ecological comparisons of sample OTU richness, the original data set was standardized using 9490 (the lowest cover-age achieved in any one sample) randomly picked sequences
(over 200 bp in length; n= 218,276) from each sample, prior to
denoising and OTU clustering. Sample-specific rarefaction curves were performed using the DiversityEstimates software package via AmpliconNoise and phylum-specific rarefaction curves were generated using EstimateS 8.2.0(Colwell, 2013) using a range of richness estimators (ACE, Chao1, Jackknife1 and
Bootstrap) that yielded very similar results; the Chao1 richness
estimator was chosen because it is relatively independent of sample size and it is particularly informative for data sets that are skewed towards the low-abundance classes (Chao et al., 1992), as is the case for reads derived from a heterogeneous range of microorganisms. Sørensen’s similarity coefficient among samples was computed based on a presence/absence similarity matrix and was used to create cluster dendrograms and multidimensional scaling (MDS) with 50 random starts, using primer 6 (Clarke & Gorley, 2006). Using the same soft-ware, a similarity profile (‘SIMPROF’) permutation test, was performed on group-average cluster analysis to test whether meiobenthic samples differ from each other. In order to further test for significant differences in community assemblage among sampling sites, a permutational multivariate analysis of variance (‘PERMANOVA’) was performed. Analyses were based on Sørensen’s similarity coefficient on untransformed data of an OTU presence/absence matrix over the 22 sampled sites, with 1000 permutations. To test if there was an association between geographical distance and phylum community composition, a non-parametric Mantel-type test (‘RELATE’) based on distance matrices derived from geographical distance (calculated as the minimum coastal dispersal distance between sampling sites) and community composition (presence–absence data) was per-formed using primer. To further examine phylum community
composition in relation to potential drivers, environmental vari-ables such as seawater salinity, seawater surface temperature (SST) and sediment grain size were examined using the RELATE test for each environmental matrix, calculated based on Eucli-dean distances. Sequential Bonferroni corrections, which are more sensitive to false positives than the standard Bonferroni technique (Rice, 1988), were applied where appropriate. Addi-tionally, in order to find the combination of parameters (envi-ronmental and/or geographical) that best explained the patterns within each phylum, a partition multivariate analysis of variance was performed using the adonis function in VeganR (Oksanen
et al., 2010). This partitions dissimilarities into sources of
vari-ation, and uses permutation tests to inspect the significances of those partitions. Community-composition dissimilarities were calculated as Bray–Curtis distances for each phylum against the several parameters (sea water temperature, salinity, sediment grain size and latitude).
R E S U LT S
Sequence data and sampling efficiency
The total number of reads derived from the Roche 454 FLX platform for all sampled sites was 877,423; this was reduced to 694,802 sequences after denoising and chimera removal. Sam-pling saturation profiles varied between sample sites, showing that sequencing effort was sufficient for some samples, but far from complete for most samples (Appendix S3).
Community diversity (α and β), composition and richness
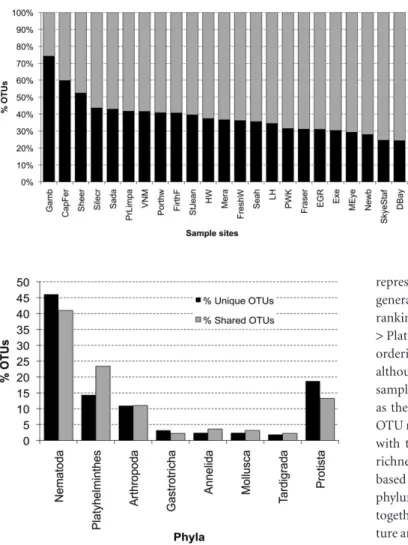
Comparing the frequency of shared versus unique OTUs showed that the majority of sampled sites had 25%–40% unique OTUs, corresponding on average to c. 60–70 unique OTUs per site within the UK and all sampling sites. Preliminary analyses also indicated that unique OTUs were uniformly distributed between taxa. Samples from Gambia (Africa), Cap Ferret (France) and Sheerness (UK) all exhibited high percentages of endemism, with 74%, 60% and 53% unique OTUs, respectively (Fig. 1). Addi-tional scrutiny of the 26% shared OTUs in the Gambia samples revealed, according to blast matches with 99% identity to acces-sions in public databases, that the most ubiquitous meiobenthic species within the sampled areas were likely to be conspecific with, or close relatives of, the nematodes Daptonema setosum and
Viscosia sp., Vannuccia platyhelminths and Paramenophia
copepods. Moreover, the percentages of shared and unique OTUs in all samples were highest in the Nematoda and the Platyhelminthes, with the remaining meiofauna OTUs repre-sentatives being equally distributed among phyla (Fig. 2).
The taxonomic distribution and richness of the main meiofauna representatives was explored (Fig. 3, Appendix S4). In total, across all sampled sites at a 96%-similarity cut-off, 1353 OTUs could be assigned to 23 different phyla, including 14
corresponding to marine meiofauna. Throughout the
no more than six OTUs (Cnidaria, Rotifera, Bryozoa, Brachiopoda, Nemertea, Apusozoa, Kinorhyncha, Orthonectida, Tunicata, Gnathostomulida, Porifera and Excavata). There were clear qualitative differences in community composition between geographical regions. Samples from the UK, for example, appeared to have a more homogeneous composition of phyla, whereas those from continental Europe proved to be more heterogeneous (Fig. 3). There was a significant positive associa-tion between the Nematoda and Platyhelminthes OTU richness across all samples (sequentially Bonferroni-corrected
Spear-man’s correlationρ = 0.0025; P < 0.05) but no other
relation-ships were uncovered between the meiobenthic phyla (Fig. 3). By far the most abundant phylum throughout all sample sites was the Nematoda, which typically represented up to 40% of all OTUs within the main meiobenthic phyla retrieved. Platyhelminthes was the second richest, followed by the Arthropoda (mainly
represented by Copepoda), with 20% and 10% representation in general, respectively. Overall, there is a clear community-richness ranking hierarchy among the dominant phyla (Nematoda > Platyhelminthes > Arthropoda), followed by more random ordering across the remaining meiofaunal phyla (Fig. 4), although exceptions existed in some continental European samples where Platyhelminthes or even Arthropoda were ranked as the richest phylum. No correlations were observed between
OTU richness and any of the environmental variables (P> 0.05),
with the exception of a negative correlation between mollusc
richness and latitude (ρ = −0.658; P = 0.0006). Further
Mantel-based tests (RELATE) revealed significant associations between phylum community composition and geographical distance, together with finer sediment grain size, seawater surface
tempera-ture and latitude, in most meiofaunal taxa (P< 0.05), but not for
the protist phyla (Appendix S5). The variance decomposition pattern of each phylum into environmental and geographical parameters showed that seawater temperature and latitude accounted for much of the variance in the community and were significantly correlated with community structure for the main
meiobenthic phyla (P< 0.001) (Table 1). The combination of
environmental and geographical factors that best explained com-munity structure were, in decreasing order, latitude, seawater temperature, sediment and salinity. Latitude and seawater tem-perature are highly correlated and so their influence could not be estimated simultaneously in the partition analysis, but they
exhibited the same level of significance and variance (R2). Much
of the variation in the communities was not explained by the
parameters analysed (residual R2> 0.70; Table 1).
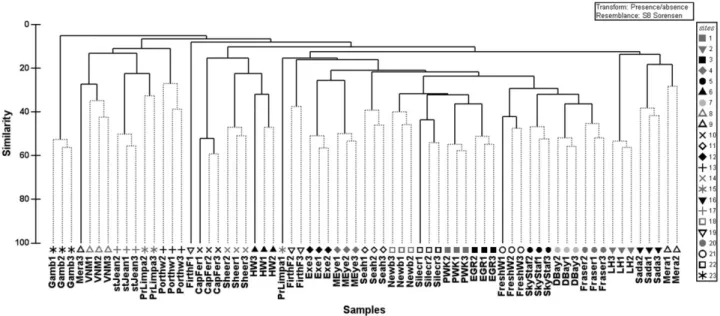
Clustering analysis revealed that the majority of independent samples from within each sampling station generally clustered together (Fig. 5). Of these, community composition was gener-ally significantly different between the majority of sites and displayed clear groupings, with some geographical coherence
throughout (PERMANOVA, P< 0.001). Communities that were
geographically further apart tended to be less similar, although samples from Spain, Portugal and France shared similarities with Littlehampton, Porthtowan and Sheerness from the UK. Unsurprisingly, samples from Gambia represented a completely disparate group of samples in terms of community composition (Fig. 5).
Figure 1 Relative percentages of shared and unique OTUs for each sample site from the standardized data (see Appendix S1 in Supporting Information for site abbreviations). Meiobenthic communities are niche driven but also show high levels of cosmopolitanism.
Figure 2 Relative proportions of shared and unique OTUs between all sampled sites for the main meiofauna representatives and protists, showing higher levels of shared OTUs in the most abundant phyla. The data set was normalized to the same number of reads per ecological sample; clustered OTUs that were only found in a single sampling location (i.e. among three ecological replicates per site) represent the ‘unique OTUs’, and OTUs common to all sampled sites are denominated as ‘shared OTUs’.
The slope of OTU rarefaction curves at the 96% cut-off for the main meiofauna phyla did not approach an asymptote and displayed a typically linear positive trend throughout the
Nematoda, Platyhelminthes, Arthropoda, Annelida and
Gastrotricha, suggesting an undersampling of these phyla (Fig. 6). Throughout the meiofauna, richness estimates were highest for Nematoda and lowest for the Annelida, with 827 and 71 OTUs, respectively. Almost 5% of the recovered OTUs gave
no significant match to known ribosomal databases [< 90%
identity; not assigned (NA)] and are likely to represent unsampled genetic diversity that is not available in public data-bases. Further manual analysis of these OTUs showed that the majority were placed within the Nematoda (43% OTUs, 5168 sequences) and around 14% corresponded to taxa that are tated simply as ‘environmental samples’. Of these, manual anno-tations of the 454 Roche reads showed that many were again likely to be derived from nematode worms.
D I S C U S S I O N
The prevailing paradigm in microbial macroecology is that, in general, the most abundant and dominant species are predicted to have higher dispersal rates and levels of ubiquity (Finlay, 2002). Interestingly, our study supports this idea, as the shared OTUs were not proportional in abundance amongst the differ-ent phyla, with higher levels of shared OTUs in the most abun-dant phyla (Nematoda and Platyhelminthes). Such an observation corroborates the accepted paradigm of how species’ ecology affects dispersal and suggests that the level of dispersal differs in relation to relative abundance, where more abundant taxa exhibit higher chances of dispersal. The Nematoda nearly always dominated the marine sediments, generally followed by decreasing numbers of Platyhelminthes and Arthropoda, accompanied by more random assemblages of Gastrotricha, Annelida, Mollusca, and so on. Such concordant geographical patterns support a previous smaller-scale study of alpha diver-sity (Fonseca et al., 2010) and indicate that the marine benthos
Figure 3 Taxonomic distribution of OTUs assigned to the main representatives of meiofauna phyla (with more than four OTUs) found in the 23 sampled sites, showing the highly conserved meiobenthic community structure. (See Appendix S1 in Supporting Information for the geographical distribution and abbreviations of the sample sites.)
Figure 4 OTU rank abundance for the main phyla recovered from the European sites (after data standardization), providing evidence that the marine benthos is not structured neutrally. The frequency of ranking (out of nine samples) is represented by the diameter of the symbol at each rank and the multiple symbols highlight variance in phylum rank order throughout the samples.
Table 1 Environmental and geographical factors that best explain meiobenthic community structure shown by variance-partitioning analysis. Values represent the variance partitioned by each factor (R2). Latitude and seawater temperature (SST), followed by
sediment grain size (S01) and salinity, represent the factors that best account for the variation in meiobenthic community structure. Much of the variation remains to be explained (residual
R2
).
Phylum Latitude/SST S01 Salinity Residual Nematoda 0.173*** 0.051 0.051 0.725 Platyhelminthes 0.103*** 0.058 0.048 0.791 Copepoda 0.127** 0.061 0.039 0.772 Gastrotricha 0.130** 0.046 0.127* 0.699 Annelida 0.099* 0.074 0.055 0.772 Mollusca 0.096** 0.069 0.028 0.806 Tardigrada 0.061 0.054 0.086 0.798 ***P< 0.001; **P < 0.01; *P < 0.05.
is not structured neutrally, at least amongst the dominant phyla. Further to this, the observed significant association between Nematoda and Platyhelminthes richness suggests that at a local scale, the most abundant vermiform phyla may compete for
niche space, with their corresponding impacts on meiobenthic community composition. Some members of the community might serve as ‘keystone’ or ‘driver’ species (Walker, 1992), with a crucial role in regulating community function. Thus, because
Figure 5 Clustering dendrogram for the sampled sites based on Sørensen’s similarity coefficient on a presence/absence similarity matrix (standardized data). Plotted are sixteen samples around the United Kingdom, two samples from each of France, Spain and Portugal, and one from Gambia (replicates are marked 1, 2 and 3; see Appendix S1 in Supporting Information for site abbreviations).
Figure 6 Rarefaction curves showing mean expected OTU numbers (Chao1) as a function of sample size, confirming that the bulk of meiofaunal diversity is yet to be discovered. Plots are shown for (a) all phyla, (b) Nematoda, (c) Platyhelminthes (solid line) and Arthropoda (dashed line), (d) Annelida (solid line) and Gastrotricha (dashed line) at 96% identity OTU cut-off from all European ecological samples, excluding Gambia. Curves were estimated from 100 randomizations without replacement using EstimateS 8.2.0.
nematodes are the most abundant metazoans in marine sedi-ments (Lambshead, 2004; Bhadury et al., 2006), they are likely to directly affect community dynamics, assemblage patterns and ecological function (Danovaro et al., 2008). Ecological grouping is often related in nematodes to substrate type (mud or sand) and feeding mode (e.g. microvores, predators) (Giere, 2009). Previous studies have corroborated associations between sedi-ment granulometry at a local scale (Fonseca et al., 2010; Pitcher
et al., 2012). This study has shown that at a macrogeographical
scale meiobenthic community composition, and in particular that of Nematoda and Platyhelminthes, was associated with sediment granulometry, with fine silt in particular affecting composition. This observation suggests that, at larger scales, it may be possible to identify specific phylum requirements and preferences for sediment texture and size, and maybe to further characterize community functional groups.
Regional differences in the composition of metazoan meiofauna along continental margins have generally been hard to detect, partly because of technical/taxonomic challenges related to the small size of specimens, but also because of pro-nounced local variations in the biotic and abiotic factors that influence community assemblages (Soltwedel, 2000). Here, we found extremely low levels of within-site variation and identi-fied highly conserved communities representative of the biogeo-graphical areas sampled. Nevertheless, certain samples shared OTUs between geographically disparate locations across the UK and France/Spain/Portugal that may reflect conspecific organ-isms with shared ecology, or different species sharing closely related 18S rDNA genotypes. The decrease in community simi-larity with geographical distance is a universal biogeographical pattern observed in communities from all domains of life (Green et al., 2004; Pitcher et al., 2012) and is a predominant feature of the current data derived from ‘animals’, rather than protists. More specifically, the Gambian samples exhibited high beta diversity but the lowest estimated OTU richness, which may be the result of skewed evenness levels both at the organism and genomic levels. Alternatively, communities showing high levels of both alpha and beta diversity, such as Cap Ferret, Sheerness and Harwich, suggest high species turnover on this scale of sampling, which is probably attributable to microscopic changes in spatial/trophic niche dynamics.
Apart from a clear association between geographical distance/ latitude and community similarity for eukaryotic marine meiofauna, dispersal cannot be considered a limiting factor for all species because a high proportion of shared OTUs was found in all phyla at all sites. Here, we provide evidence of a hetero-geneous meiobenthic local distribution where c. 40% of the taxa identified were endemic, similar to the 30% previously reported for protists (Foissner, 2006), clearly reflecting high species
turn-over among sites (β-diversity) and thus high regional diversity.
Our data reinforce the overall consensus view that some meiofauna are highly cosmopolitan (Giere, 2009), but they are also in alignment with the existence of metapopulations that are proposed to be characteristic of many coastal invertebrates (Harrison & Hastings, 1996), because a high level of endemism occurred among sites. A recent high-throughput study of
meiofauna revealed that deep-sea nematodes are mainly site-restricted, despite showing some degree of cosmopolitanism (Bik et al., 2012). In our study, the existence of unique OTUs with narrow range sizes independent of sample size, suggests that, in addition to spatially driven factors such as dispersal and isolation, biotic interactions and local adaptation also determine local patterns of structure and diversity of the meiobenthos.
An intensively debated issue in macroecology is whether dis-tribution patterns are caused by spatially limited dispersal or by niche-related factors. This issue has recently been challenged by a growing body of evidence showing that many microorganisms have restricted distributions with well-structured spatial pat-terns of assemblage composition (Green et al., 2004; Foissner, 2006; Ghiglione et al., 2012). Our analyses contribute to our understanding of the mechanisms underpinning the widespread distribution of meiobenthic species when compared to even smaller microorganisms such as protists. The evident selection for habitat found in meiobenthic communities, and thus high endemism, contrasts with the patterns found generally in protists, because most ‘microorganisms can be found every-where’ (Fenchel & Finlay, 2004). Of particular relevance to the microbial macroecology debate is that our data set did not show a community isolation-by-distance relationship among the fea-tured protist phyla. In addition, and at a much larger scale, Ghiglione et al. (2012) recently found that c. 80% of bacteria OTUs in the Arctic and Antarctic were unique to each pole. Such patterns of strong geographical isolation and low levels of dis-persal highlight the importance of abiotic barriers to gene flow in relation to divergent life-history characteristics. In fact, we found that niche features (habitat) probably have the same impact as dispersal limitation in shaping meiobenthic commu-nities, because the variation found in community structure was mainly determined by seawater temperature and geographical distance. Chust et al. (2013) observed similar patterns in phyto-plankton communities and thus, clearly, the ‘environment selects’ meiofaunal communities (Baas Becking, 1934). On the other hand, much of the variation in meiobenthic community structure remained to be explained by the parameters analysed, which is often seen in biogeographical studies with dispersal limitation (Nekola & White, 1999). Thus, apart from high levels of cosmopolitanism, abiotic and biotic factors, together with dispersal constraints at local scales, can determine the variation in meiobenthic community composition, i.e. the driving factors that contribute to beta diversity.
A fundamental problem in quantifying biodiversity in many taxa is that more species will be recorded as more individuals are sampled (Bunge & Fitzpatrick, 1993), which is probably also the case for small marine organisms such as meiofauna. Nonethe-less, with the advance of high-throughput techniques, it is now possible to enhance the accuracy of global marine biodiversity estimates, which are essential for an understanding of ecosystem ecology. More specifically, the present study indicates that meiobenthic diversity is likely to exceed contemporary con-servative estimates, because our rarefaction curves were far from saturation. In fact, in the majority of samples, site-specific eukaryotic diversity was characterized incompletely, indicating
that a ‘hidden’ component of community composition probably remained to be sampled. Taxonomic sequence saturation for 18S rDNA metagenetic data sets is likely to be a result of the dynamic interplay between species richness, evenness and the number of intragenomic repeats/variants present in each sample. The dominant species may also mask the detection of low-abundance OTUs in ultrasequencing data sets. Further to this, phylum-specific rarefaction estimators of richness suggest the existence of 2500 OTUs of meiobenthic eukaryotes and more than 830 OTUs just for nematodes from a single habitat (i.e. a narrow marine littoral range) along the UK coast, augmented by limited sampling from France, Spain and Portugal. Along the UK coast, we found an average of c. 60 unique OTUs per site within a minimum distance between sites of 20 km, yielding a gross richness estimate of around one million new marine meiofauna species that remain to be identified along the 356,000 km of the world’s coastline. Remarkably, these numbers apply to a very conservative 96% cut-off on a restricted inter-tidal marine benthos habitat and suggest that the recently pre-dicted 2.21 million eukaryote marine species may indeed be a gross underestimate (Mora et al., 2011). For marine Nematoda, there are c. 450 species estimated around the British Isles Giere, (2009) and Costello et al. (2006) estimates 1837 species for the Northern European marine nematodes. Lambshead & Boucher (2003) also report that 30%–40% of free-living Nematoda iden-tified in field surveys of European seas are new to science. Despite the controversy surrounding marine species richness, it is clear that richness is currently underestimated, and it is likely that microorganisms in less-explored areas such as the deep sea and soil make up the bulk of diversity yet to be discovered (Mora
et al., 2011).
Our study yields insights into the biodiversity of marine meiobenthic eukaryotes in terms of magnitude, novelty and organization. More specifically, it has revealed that some meiobenthic species are likely to be highly ubiquitous, whereas others exhibit local segregation in marine coastal environments along a discrete littoral habitat across Europe. Local drivers of global environmental biodiversity will be the result of the abiotic factors, in addition to other microclimatic properties such as sediment chemical properties interacting with organism life-history strategies in benthic environments. Acknowledging the environmental challenges that are likely to be imposed on all ecosystems in the current century, it is increasingly important to understand the macroecology and concomitant levels of local adaptation of functionally important microbial communities. Specifically, further refinements will be required to fully synthe-size the extent of community change, including the analysis of seasonal variation, direct analysis of relative abundance, addi-tional metadata and clarifying the taxonomic significance of molecular genetic OTUs.
A C K N O W L E D G E M E N T S
This work was supported by a Natural Environment Research Council (NERC) New Investigator Grant (NE/E001505/1), a Post Genomic and Proteomics Grant (NE/F001266/1) and a
Molecular Genetics Facility Grant (MGF-167) to S.C and a Por-tuguese Foundation for Science and Technology (FCT) grants (SFRH/BD/27413/2006 and SFRH/BPD/80447/2014) to V.G.F.; C.Q. is supported by an EPSRC Career Acceleration Fellowship EP/H003851/1; B.N. is supported by a BBSRC CASE studentship supported by Unilever. We would like to thank Lucy Price and David Wilcockson for sample collection in France/Spain and Gambia, respectively and the National Trust and the UK Coast-guard for providing site access and advice on sampling. Thanks to David Currie, Carlos Duarte, Chris Dixon and two anony-mous referees for providing comments and technically editing the manuscript. We would also like to thank Delphine Lallias for advice with primer and providing the sample-site map shown in the supplementary information using ArcGIS.
There are no competing financial interests.
R E F E R E N C E S
Baas Becking, L. (1934) Geobiologie of inleiding tot de
milieukunde. The Hague, the Netherlands: W.P. Van Stoc- kum
& Zoon.
Bhadury, P., Austen, M.C., Bilton, D.T., Lambshead, P.J.D., Rogers, A.D. & Smerdon, G.R. (2006) Development and evaluation of a DNA-barcoding approach for the rapid iden-tification of nematodes. Marine Ecology Progress Series, 320, 1–9.
Bik, H.M., Sung, W., de Ley, P., Baldwin, J.G., Sharma, J., Rocha-Olivares, A. & Thomas, W.K. (2012) Metagenetic com-munity analysis of microbial eukaryotes illuminates biogeo-graphic patterns in deep-sea and shallow water sediments.
Molecular Ecology, 21, 1048–1059.
Bunge, J. & Fitzpatrick, M. (1993) Estimating the number of species: a review. Journal of the American Statistical
Associa-tion, 88, 364–373.
Chao, A., Lee, S.-M. & Jeng, S.-L. (1992) Estimating population size for capture–recapture data when capture probabilities vary by time and individual animal. Biometrics, 48, 201–216. Chust, G., Irigoien, X., Chave, J. & Harris, R.P. (2013) Latitudinal phytoplankton distribution and the neutral theory of biodi-versity. Global Ecology and Biogeography, 22, 531–543. Clarke, K. & Gorley, R. (2006) PRIMER v6: user manual/tutorial.
PRIMER-E, Plymouth.
Colwell, R.K. (2013) Estimates: statistical estimation of species
richness and shared species from samples. University of
Con-necticut, Storrs, CT. Available at: http://viceroy.eeb.uconn .edu/estimates/
Costello, M.J., Bouchet, P., Emblow, C.S. & Legakis, A. (2006) European marine biodiversity inventory and taxonomic resources: state of the art and gaps in knowledge. Marine
Ecology Progress Series, 316, 257–268.
Creer, S., Fonseca, V.G., Porazinska, D.L., Giblin-Davis, R.M., Sung, W., Power, D.M., Packer, M., Carvalho, G.R., Blaxter,
M.L., Lambshead, P.J.D. & Thomas, W.K. (2010)
Ultrasequencing of the meiofaunal biosphere: practice, pit-falls and promises. Molecular Ecology, 19, Suppl. S1, 4–20.
Danovaro, R., Gambi, C., Dell’Anno, A., Corinaldesi, C., Fraschetti, S., Vanreusel, A., Vincx, M. & Gooday, A.J. (2008) Exponential decline of deep-sea ecosystem functioning linked to benthic biodiversity loss. Current Biology, 18, 1–8. Fenchel, T. & Finlay, B.J. (2004) The ubiquity of small species:
patterns of local and global diversity. BioScience, 54, 777–784. Finlay, B.J. (2002) Global dispersal of free-living microbial
eukaryote species. Science, 296, 1061–1063.
Foissner, W. (2006) Biogeography and dispersal of micro-organisms: a review emphasizing protists. Acta Protozoologica,
45, 111–136.
Fonseca, V., Power, D., Carvalho, G., Lambshead, J., Packer, M. & Creer, S. (2011) Isolation of marine meiofauna from sandy sediments: from decanting to DNA extraction. Protocol
Exchange. doi: 10.1038/nprot.2010.157.
Fonseca, V.G., Carvalho, G.R., Sung, W., Johnson, H.F., Power, D.M., Neill, S.P., Packer, M., Blaxter, M.L., Lambshead, P.J.D., Thomas, W.K. & Creer, S. (2010) Second-generation environ-mental sequencing unmasks marine metazoan biodiversity.
Nature Communications, 1, doi: 10.1038.
Fonseca, V.G., Nichols, B., Lallias, D., Quince, C., Carvalho, G.R., Power, D.M. & Creer, S. (2012) Sample richness and genetic diversity as drivers of chimera formation in nSSU metagenetic analyses. Nucleic Acids Research, 40, e66.
Gaston, K.J. (2009) Geographic range limits of species.
Proceed-ings of the Royal Society B: Biological Sciences, 276, 1391–1393.
Ghiglione, J.-F., Galand, P.E., Pommier, T., Pedrós-Alió, C., Maas, E.W., Bakker, K., Bertilson, S., Kirchman, D.L., Lovejoy, C., Yager, P.L. & Murray, A.E. (2012) Pole-to-pole biogeogra-phy of surface and deep marine bacterial communities.
Pro-ceedings of the National Academy of Sciences USA, 109, 17633–
17638.
Giere, O. (2009) Meiobenthology: the microscopic motile fauna of
aquatic sediments, 2nd edn. Springer, Berlin.
Green, J.L., Holmes, A.J., Westoby, M., Oliver, I., Briscoe, D., Dangerfield, M., Gillings, M. & Beattie, A. (2004) Spatial scaling of microbial eukaryote diversity. Nature, 432, 747–750. Hajibabaei, M., Shokralla, S., Zhou, X., Singer, G.A.C. & Baird, D.J. (2011) Environmental barcoding: a next-generation sequencing approach for biomonitoring applications using river benthos. PLoS ONE, 6, e17497.
Harrison, S. & Hastings, A. (1996) Genetic and evolutionary consequences of metapopulation structure. Trends in Ecology
and Evolution, 11, 180–183.
Hubbell, S.P. (2001) The unified neutral theory of biodiversity and
biogeography. Princeton University Press, Princeton, NJ.
Ji, Y., Ashton, L., Pedley, S.M. et al. (2013) Reliable, verifiable and efficient monitoring of biodiversity via metabarcoding.
Ecology Letters, 16, 1245–1257.
Lambshead, P.J.D. (2004) Marine nematode biodiversity.
Nema-tode morphology, physiology and ecology (ed. by Z.-X. Chen,
S.-Y. Chen and D.W. Dickson), pp. 438–492. Tsinghua Uni-versity Press, Tsinghua.
Lambshead, P.J.D. & Boucher, G. (2003) Marine nematode deep-sea biodiversity – hyperdiverse or hype? Journal of
Bio-geography, 30, 475–485.
Logares, R., Audic, S., Bass, D. et al. (2014) Patterns of rare and abundant marine microbial eukaryotes. Current Biology, 24, 813–821.
Mora, C., Tittensor, D.P., Adl, S., Simpson, A.G.B. & Worm, B. (2011) How many species are there on Earth and in the ocean?
PLoS Biology, 9, e1001127.
Nekola, J. & White, P. (1999) The distance decay of similarity in biogeography and ecology. Journal of Biogeography, 26, 867– 878.
Oksanen, J., Kindt, R., Legendre, P., O’Hara, B., Stevens, M. & Oksanen, M. (2010) vegan: community ecology package. Avail-able at: http://cran.r-project.org/web/packages/vegan Palumbi, S.R. (1994) Genetic divergence, reproductive isolation,
and marine speciation. Annual Review of Ecology and
System-atics, 25, 547–572.
Pitcher, R.C., Lawton, P., Ellis, N., Smith, S.J., Incze, L.S., Wei, C.-L., Greenlaw, M.E., Wolff, N.H., Sameoto, J.A. & Snelgrove, P.V.R. (2012) Exploring the role of environmental variables in shaping patterns of seabed biodiversity composition in regional-scale ecosystems. Journal of Applied Ecology, 49, 670– 679.
Platt, H.M. & Warwick, R.M. (1988) Free-living marine
nema-todes. Part II: British chromadorids. Synopses of the British
Fauna (new series) 38. Brill, Leiden.
Porazinska, D.L., Giblin-Davis, R.M., Faller, L., Farmerie, W., Kanzaki, N., Morris, K., Powers, T.O., Tucker, A.E., Sung, W. & Thomas, W.K. (2009) Evaluating high-throughput sequenc-ing as a method for metagenomic analysis of nematode diver-sity. Molecular Ecology Resources, 9, 1439–1450.
Quince, C., Lanzen, A., Davenport, R.J. & Turnbaugh, P.J. (2011) Removing noise from pyrosequenced amplicons. BMC
Bioinformatics, 12, 38.
Rice, W.R. (1988) Analyzing tables of statistical tests. Evolution,
43, 223–225.
Soltwedel, T. (2000) Metazoan meiobenthos along continental margins: a review. Progress in Oceanography, 46, 59–84. Stoeck, T., Bass, D., Nebel, M., Christen, R., Jones, M.D.M.,
Breiner, H.-W. & Richards, T.A. (2010) Multiple marker par-allel tag environmental DNA sequencing reveals a highly complex eukaryotic community in marine anoxic water.
Molecular Ecology, 19, 21–31.
Taberlet, P., Coissac, E., Pompanon, F., Brochmann, C. & Willerslev, E. (2012) Towards next-generation biodiversity assessment using DNA metabarcoding. Molecular Ecology, 21, 2045–2050.
Thomsen, P.F., Kielgast, J., Iversen, L.L., Wiuf, C., Rasmussen, M., Gilbert, M.T.P., Orlando, L. & Willerslev, E. (2012) Moni-toring endangered freshwater biodiversity using environmen-tal DNA. Molecular Ecology, 21, 2565–2573.
Tilman, D. (1982) Resource competition and community
struc-ture. Monographs in Population Biology 17. Princeton
Uni-versity Press, Princeton, NJ.
Walker, B.H. (1992) Biological diversity and ecological redun-dancy. Conservation Biology, 6, 18–23.
Yoder, M., De Ley, I.T., King, I.W., Mundo-Ocampo, M., Mann, J., Blaxter, M., Poiras, L. & De Ley, P. (2006) DESS: a versatile
solution for preserving morphology and extractable DNA of nematodes. Nematology, 8, 367–376.
Zinger, L., Amaral-Zettler, L.A., Fuhrman, J.A., Horner-Devine, M.C., Huse, S.M., Welch, D.B.M., Martiny, J.B.H., Sogin, M., Boetius, A. & Ramette, A. (2011) Global patterns of bacterial beta-diversity in seafloor and seawater ecosystems. PLoS ONE,
6, e24570.
S U P P O RT I N G I N F O R M AT I O N
Additional supporting information may be found in the online version of this article at the publisher’s web-site.
Appendix S1 Coordinates of the 23 sampled sites.
Appendix S2 Map of the 23 sampling stations of sandy
sedi-ments around the UK and France, Spain, Portugal and Gambia.
Appendix S3 Operational taxonomic unit saturation profiles.
Appendix S4 Number of total OTUs for all metazoan phyla
found in the 23 sampled sites.
Appendix S5 Spearman’s correlation (ρ) and significance test
(P) between community similarity and grain size, surface sea-water temperature, seasea-water salinity, geographical distance and latitude, derived from a Mantel test, for the main meiofauna and protist phyla.
B I O S K E T C H
The research team comprise molecular ecologists, tax-onomists, marine, evolutionary, genome, functional and computational biologists who share interests in defining and understanding biodiversity patterns and processes in the marine biosphere.