Mul ple correspondence analysis applied to the
study of the rela onship between traffic crashes and
precipita on on a highway in Brazil
Milena Arruda Silva1, Leandro Canezin Guideli2, Alessander C. M. Kormann3, Anselmo Chaves Neto4, Larissa de Brum Passini5
1Federal University of Paraná, Paraná, Brazil, [email protected] 2Federal University of Paraná, Paraná, Brazil, [email protected] 3Federal University of Paraná, Paraná, Brazil, [email protected] 4Federal University of Paraná Paraná, Brazil, [email protected] 5Federal University of Paraná, Paraná, Brazil, [email protected]
Recebido:
11 de maio de 2019
Aceito para publicação:
20 de novembro de 2019 Publicado: 31 de agosto de 2020 Editor de área: Flávio Cunto ABSTRACT
The incorpora on of meteorological data in road accident research has been considered essen al in studies that aim to analyze traffic crashes behavior. Thus, this paper intended to explore the rela onship between the occurrence of traffic crashes and weather condi ons, especially daily precipita on, in a selected segment of the BR-376 Highway (state of Paraná, Brazil). A mul ple correspondence analysis (MCA) was applied (Statgraphics so:ware) in order to determine the rela onship among crash data variables and precipita on. The MCA analysis allowed the crea on of a perceptual map, grouping variables that are similar among themselves, which revealed that rainfall intensity was not significant in determining the accident characteris cs. However, the presence/absence of rain was a condi oning circumstance. Concerning road safety, the study gives prac cal implica ons that can be used by traffic agencies as the implementa on of traffic and educa onal signs in specific points of the highway.
RESUMO
A incorporação de dados meteorológicos em pesquisas envolvendo o estudo de acidentes é considerada como essencial quando se obje va analisar o comportamento de acidentes rodoviários. Neste contexto, o presente trabalho pretendeu explorar a existência de correlação entre ocorrência de acidentes rodoviários e condições climá cas, em específico a precipitação diária, num trecho selecionado da Rodovia BR- 376 (Paraná, Brasil). Uma análise de correspondência múl pla (ACM) foi aplicada (so:ware Sta graphics) para determinar a relação existente entre as caracterís cas dos acidentes e a precipitação. A ACM permi u a criação de um mapa perceptual, agrupando as variáveis consideradas semelhantes de acordo com o método, o qual evidenciou que a intensidade da chuva não foi um fator significa vo para alterar as caracterís cas dos acidentes. Entretanto, a ocorrência de precipitação mostrou-se como uma circunstância condicionante. Com respeito à segurança da rodovia, a pesquisa indica aplicações prá cas que podem ser aplicadas pelas agências de tráfego, como a implementação de sinalização de tráfego e educacional em pontos específicos da rodovia. Keywords: Road accident. Rainfall. Qualita ve analysis. Palavras-chaves: Acidente rodoviário. Chuva.
Análise qualita va.
DOI:10.14295/transportes.v28i3.2044
1. INTRODUCTION
According to the World Health Organization (2018), in 2016 about 1.4 million people worldwide were killed by road injuries. In addition, road traf(ic injuries were among the 10 leading causes of death in low, middle and upper-middle-income countries.
Concerning this matter, different studies have been dealing with the main causes of road traf(ic crashes (Shankar et al., 1995; Smith, 2008; Wanvik, 2009; Bergel-Hayat et al., 2013; Mannering et al., 2016; Calef(i et al., 2016), among which some consider the relationship between weather conditions and crashes, including car and motorcycles (Black and Mote, 2015; Cheng et al., 2017). Martensen et al. (2016) presented that rain has a different effect on two-wheelers and car occupants victims. In the case of two-two-wheelers, the authors found a decrease in the number of victims, while for car occupants, an increase in this number due to the presence of rainfall was observed.
In this context, researches based in understanding the factors affecting the number of traf(ic road crashes, especially concerned to weather conditions such as precipitation, are essential to road safety. Most studies, nonetheless, focus on the quantity of crashes in(luenced by precipitation, leaving behind some important variables, i.e. the crash characteristics, such as injury severity and highway structure (straight segment, curve, bridge, among others).
Hence, this study aims at (inding a relationship between the characteristics of traf(ic crashes, more speci(ically in the segment between km 644+000 m and km 661+000 m in the BR-376 Highway (state of Paraná, Brazil), while focusing at precipitation analysis, due to availability of on (ield rain gauges.
A multiple correspondence analysis (MCA) was employed, which allowed exploring the relationship among the following variables: presence/absence of rain and amount of precipitation, crashes with injury and injury severity (minor and serious injuries or fatal), road direction (ascending or descending, in terms of road kilometers) and road structure (viaduct/bridge, return, roundabout, detour, and straight segment).
2. LITERATURE REVIEW
2.1. Traffic accident researches
In contrast with the analysis herein, several researches approached the subject with a quantitative analysis, and explored the effects of weather and its consequences in terms of injury severity (Mannering and Bhat, 2014).
Most results show that weather effects, such as rainfall, tend to have a positive relationship with the number of crashes (Theo(ilatos and Yannis, 2014), while these effects also do not seem to present an absolute positive/negative effect in respect to the severity. To this extent, in(luence in crash frequency can change by unit of analysis (Theo(ilatos and Yannis, 2014): while a daily approach may present a positive effect to precipitation, monthly data can also show a negative relationship to the same variable (Eisenberg, 2004). At the same time, other few studies remarked a negative relationship between daily precipitation and traf(ic crashes counts and severity (Karlaftis and Yannis, 2010). In addition to most of these studies taking place in climates that are very different from Brazil, it seems that, in overall, literature does not agree in the aspects of crash frequency and accident severity with respect to weather effects in accidents, giving path to further studies.
According to Das and Sun (2015), MCA has received special attention in French and Japanese researches, while in the English literature it is a method with a growing application. Moreover, its current greater usage is found in the (ield of marketing and social science.
However, literature also shows that the method can be applied in transportation engineering studies, and more speci(ically in the traf(ic crashes study (ield. These applications include the study of Fontaine (1995), which explored the factors contributing in vehicle pedestrian crashes.
The author produced a typology that showed correlations between these factors, without, however, establishing a causal link with crashes. The results allowed improving the understanding of the studied crashes, in addition to serve as basis to propose necessary strategies for crashes prevention. Factor et al. (2010) performed a study on the relationship between drivers’ communities’ characteristics and their involvement in collision types. In a pedestrian crashes study, Das and Sun (2015) indicated circumstances that tend to be related to this type of crash. One of these was the occurrence of injury in female pedestrians that was associated with either dawn or dusk, abnormal weather, and nighttime crashes in roadways with lighting. Also, Das and Sun (2016) analyzed fatal run off road crashes and, by using MCA, they pointed out contributing factors for their occurrence. The authors highlighted that, by using the MCA method, the creation of clouds of variables was of great value in determining factors that trigger fatal run-off-road crashes. For example, one of these factors was the combination of men driving car with passengers at dawn.
The present work differs from available studies in the literature in terms of focusing in the in(luence of precipitation and crash characteristics in triggering traf(ic crashes based on a qualitative basis, using MCA. Another remark is the usage of data from on (ield rain gauges, covering the speci(ic extension of the roadway analyzed, which allows the collection of more precise precipitation information.
2.2. Mul7ple correspondence analysis
MCA is a statistical approach applied for more than two variables in categorical data analyses and is known as an extension of the Correspondence Analysis (CA) (Das and Sun, 2016). According to Kaciak and Louviere (1990), CA belongs to the family of multidimensional scaling or perceptual mapping techniques and it permits to scale jointly a matrix of non-negative data to represent objects described by rows or columns as points in a dimensional space. Both methods enable the description of the relationship between two or more variables of empirical interest, when the variables are categorical instead of quantitative.
By the application of the MCA it is possible to analyze the relationship patterns between several categorical dependent variables (Abdi and Valentin, 2007). Das and Sun (2016) explained that the MCA permits the structure of categorical data discovery by presenting complicated relationships in a simple chart that demonstrates a combination of signi(icant variables through dimension analysis. By creating combination clouds, the method presents the correlation between the variables and their relationship to the interested resultant variable.
Le Roux and Rouanet (2010) described MCA as a powerful tool for analyzing full-scale research database, but the method is still rarely discussed and under-used. The MCA method provides maps that are frequently overpopulated with points that represent the variables in study, making them hard to be interpreted.
The main principle in the interpretation of the MCA method results is the centroid, a geometrical aspect of the method. This principle establishes that points close to each other tend to be similar among themselves, and vice-versa (Hoffman and Leeuw, 1992). In other words, in the interpretation of the MCA plot, or perceptual map, it should be considered that categories plotted with a greater relative closeness possess a certain relation with each other, in contrast to those categories with points located far away, which is the case where they tend to not be related.
MCA was chosen due to its ability of taking large datasets and giving them a visual interpretation. Additionally, the method does not require assumptions of speci(ic underlying distribution on the sample, and no relationship among the variables on the set needs to be hypothesized. This research used the commercial statistical software Statgraphics to perform the MCA due to the convenient functions available to perform multivariate statistical analysis.
2.3. MCA calcula7on rou7ne
Considering a database composed of categorical variables, MCA consists of a scheme that can take the information and reduce the variables to lesser dimensions, composed of these categorical variables. That is, if considering an individual entry (a row) denoted by i, which has three variables (represented by three columns) and three indicators (a1, b2, c3), the MCA can provide a spatial distribution of the points calculated by the dimensions which are based on the three categories. There are two types of distributions, i.e. clouds, which can be obtained by the method: cloud of variable category and cloud of individuals (Le Roux and Rouanet, 2010). It should be noted that the distribution obtained is not a simple graphical display, and, in fact, an analogy can be made with a geographical map with the same scale in all directions. Another important property of the map is its dimensionality. There can be a one-dimensional “cloud”, where the points can be distributed along a simple line - however, this version can be poor in matters of explaining the variance in the sample. Another possibility is a two-dimensional cloud, which allows visualization on the plane. Three dimensional maps can also be used, but their interpretation is more dif(icult due to inconveniences added by the third dimension.
Weller and Romney (1990) described the method used in MCA to obtain the graphical results based on the dimension and its coordinates. The brief overview of the MCA calculation method, presented as it follows, is based on these authors, as well as in Abdi and Valentin (2007) and Le Roux and Rouanet (2010).
The input in the analysis is a user-de(ined matrix, composed of I records and Q variables (“I by Q” matrix). The total number of categories J for all variables will be given by equation (1).
= ∑ ∈ (1)
Where Jq represents the number of categories for a given variable q. In order to contain all
categories in the table data, another matrix is constructed, composed of I columns and J rows, where the variables categories receive a true or false value. For example, one of the variables used in this work is “Precipitation”, which can have values of 0 or 1 (0 for no precipitation, 1 for precipitation). There will be two columns to indicate if “no precipitation” is true or the opposite, that is, “precipitation” is true. In this case, the number of categories Jq is two for this speci(ic variable.
Considering a number of single records, related to a category k, denoted by nk (with nk > 0),
and n the number of individual records, fk = nk/n is the relative frequency of cases associated
with the category k, the values of fk generates a new row pro(ile. The relative distance between
two single records is then created with respect to the variables that present different categories. That is, suppose for a q variable, with an individual record i, there will be a category k and for the individual record i' the category k’, which should not be noted to be the same as k. The squared distance between individual records i and i', for the single variable q will be given by equation (2).
( , ′) = +
By taking Q as the total number of variables in the analysis, the overall distance between i and i' will be de(ined by equation (3).
( , ′) = ∑ ∈ ( , ′) (3)
Then the complete set of the distances between individual entries will determine the cloud of individuals, which will consist of n points in a space that has dimensionality of L, which should follow L ≤ K – Q. It is also assumed that n ≥ L. Considering that Mi represents the point
corresponding to the individual record i, and G represents the mean point of the cloud, then the squared distance from point Mi to point G will be as given by equation (4).
( ) = ∑ ∈ (4)
Where Ki stands for the response pattern of individual i, which is linked to the set of
categorical variables for the individual record i. By its turn, the cloud of categories is made up of a weighted cloud of K points (for a category k, a point denoted by Mk with weight nk has its
representation in the cloud). 1/Q denotes the sum of a variable q categories point’s relative weights and nk the relative weight of the point Mk. The sum pk of the whole set is equal to 1, and
the sum of all weights is denoted by n. These relationships are presented in equations (5) through (7).
= = (5)
∑ ∈ = (6)
∑ ∈ = 1 (7)
By taking nkk’ as the number of individual records that present both categories (k and k’),
then the squared distance between Mk and Mk' will be given by equation (8).
′ = ′ ′
′ (8)
The numerator in equation (8) corresponds to the number of single records associated with either k or k'. Considering two different variables, such as q and q', the denominator represents the theoretical frequency for the entry (k, k') of the Kq x Kq’ matrix.
The eigenvalues, i.e., the variance corresponding to a dimension obtained in MCA, can be calculated from equation (9).
!= "# $ # ! $ % !> 0 % !≤
(9) Where cλl represents the corrected eigenvalues to be used on the MCA Burt Table analysis.
And λl indicates the values that can be obtained in an analysis made through an Indicator Table
(Abdi and Valentin, 2007). The eigenvalues are a very important measure once they are linked to how a dimension can explain the variance existing in the sample.
The cloud of individuals is derived from the Burt Table, which is a symmetric matrix of all cross-tabulations between the categorical variables. This cloud also presents an analogy to the covariance matrix of continuous (i.e., metric) variables. Burt Table analysis is a generalization of the simple CA method. In addition, it allows the inclusion of individuals or means from a group of individuals to the graphic display, aiding the results interpretation.
3. STUDY AREA DATA
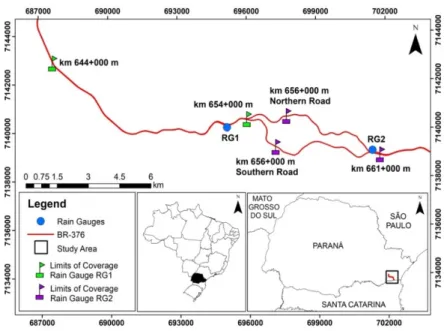
connects the states of Mato Grosso do Sul and Santa Catarina (Brazil). Considering all the highways from Paraná state, between 2009 and 2012, BR-376 showed the highest numbers and proportions of accidents; according to Sehaber (2013) 17,429 accidents were registered, involving 31,677 vehicles and drivers. In this work, the study area is located within the Serra do
Mar, between km 644+000 m to km 661+000 m of the BR-376 Highway, state of Paraná, Brazil.
The Serra do Mar is a Brazilian mountain range with an average extension of 2,000.0 km, from the Rio de Janeiro state to Santa Catarina state. The area is characterized by a strongly undulated relief and considerable number of natural and arti(icial slopes (Victorino et al., 2017). Moreover, BR-376 Highway is an important traf(ic route for Brazilian products and passenger transports. This region has great economical and strategical importance, since it connects the exporting and importing port area and the most industrialized and populated regions of Brazil. Therefore, the area is intensely transposed by highways, railways and oil pipelines (HASUI et al., 2012). It is important to highlight that, due to the region relief, the highways presented in the Serra do Mar have highly curved sections, which are considered as dangerous passages.
3.1. Precipita7on data
The precipitation data applied in this study was registered by two rain gauges denominated as RG1, which covers km 644 to km 654, and RG2, from km 656 to km 661, as illustrated in the map from Figure 1. The precipitation data is part of a research project focused on monitoring landslide risks (Victorino et al. 2017, Trevizolli et al. 2018 and Ferreira et al. 2018). Since the
Serra do Mar is a region with high annual average rainfall and prolonged periods of rain, it is
described as one of the places with the largest volume of rainfall in Brazil (Vieira and Gramani, 2015).
Figure 1. Study area location and limits of coverage for each rain gauge
The precipitation data is here applied considering a period of one year, from March 2017 to February 2018. The period was de(ined considering recent data and intervals when the rain gauges operated regularly, without gaps on data recording. Additionally, when considering a
period of one year, the study comprehends all four seasons of the year, reducing data variations caused by seasonality.
Even though one-year (03/01/2017 to 02/28/2018) of precipitation data may seem like biased and undersized sample, an Analysis of Variance (ANOVA) helped to overcome this apparent issue, with respect to variations between precipitations registered in different years. Therefore, it was performed a comparison of daily rainfall data from 2014 to 2018 for the summer season (December, January and February), showing that there was no signi(icant difference among data registered through these years, since the instruments were installed. This analysis pointed out that one-year sample may be representative of precipitation data for the considered region. The summer season is the wettest period in the study area and it was chosen as the worst scenario, that is, the period when the rain is supposed to have greater in(luence in the traf(ic crashes of the highway.
Precipitation data registered by the rain gauges showed similarity during the considered period (Figure 2). Monthly accumulated precipitation (mm/month) registered by the rain gauges showed the highest values during the month of May/2017, for both rain gauges, with 271.2 mm (RG1) and 283.8 mm (RG2). July/2017 was the month with the lowest precipitation registered, with values of 24.6 mm (RG1) and 25.4 mm (RG2).
Betweeen June and September, months that correspond to winter, lowest or no precipitation were registered while during other months precipitation occurred more pronounced, such as during the spring, summer and autumn. During all the analysis period, the accumulated precipitation was equal to 1,632.7 mm/year (RG1) and 1,757.9 mm/year (RG2).
Figure 2. Monthly accumulated precipitation registered for rain gauges RG1 and RG2
3.2. Traffic crashes data
Traf(ic crashes data were obtained on the public available database from the Polícia Rodoviária
Federal (PRF, 2019), which provided information regarding a total of 213 crash occurrences for
the same period of rainfall analysis (March 2017 to February 2018). Data includes crash day and time, crashes with or without injuries and injury severity (minor and serious injuries or fatal), presence of rain, crash location, i.e., km reference in the BR-376, presence of a curve at the accident location, road structure (viaduct/bridge, return, roundabout, detour, straight) and road direction (ascending or descending, in terms of kilometers), among others that were not
mar abr mai jun jul ago set out nov dez jan fev Month
0 100 200
applied in this study. These include municipality of the accident, type of road (single lane and double lane), road conditions (wet, dry or slippery), urban or rural area classi(ication, day of the week, day phases, damage to the environment, crash type, crash cause, vehicle type and conductor gender and age. It is important to emphasize that the data applied in this research were de(ined considering requests made by the Polícia Rodoviária Federal (PRF).
The average daily traf(ic volume in the segment from the BR-376 studied herein was equal to 34,613 vehicles in 2017, according to the registers of the toll stations from Garuva and São José dos Pinhais municipalities provided by the highway’s concessionaire (Arteris S/A). Also, the average daily traf(ic volume was 32,815 in 2014, 33,340 in 2015 and 32,544 in 2016. Therefore, it can be de(ined that the daily traf(ic volume is considerably similar between the years, as the highest difference (between 2014 and 2017) was of only 5%.
4. RESULTS AND DISCUSSIONS
4.1. Traffic crashes and precipita7on
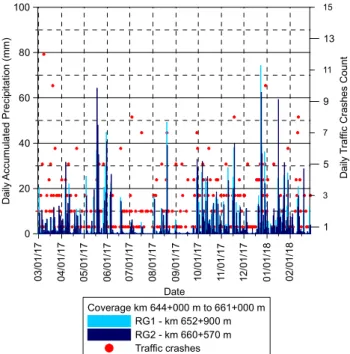
The daily traf(ic crashes are showed together with the daily accumulated precipitation (mm) for both rain gauges in Figure 3. It is observed that, in the study area, during the period in analysis, it was registered a maximum of 12 traf(ic crashes in one day. The maximum daily accumulated rainfall registered was 75 mm (December/2017) and the average was about 4.6 mm/day.
Figure 3. Daily accumulated precipitation and daily traffic crashes count for the segments covered by rain gauges RG1
and RG2
Daily rainfall data was classi(ied according to the following categories: No rain (N: 0.0 – 0.1 mm), Drizzle (Chu: 0.2 – 2.5 mm), Light (Fa: 2.6 – 10.0 mm), Moderate (Mo: 10.1 – 25.0 mm), Heavy (Fo: 25.1 – 50.0 mm) and Extreme (Ex: > 50.1 mm). The interval of “No rain” was based on the fact that, when rainfall is present, the rain gauge registers the precipitation with a 0.2 mm accumulated. In other words, for each 0.2 mm the rain gauge registers one reading. The other intervals were based on quantiles, evaluating the data series used in the analyses.
0 3 /0 1 /1 7 0 4 /0 1 /1 7 0 5 /0 1 /1 7 0 6 /0 1 /1 7 0 7 /0 1 /1 7 0 8 /0 1 /1 7 0 9 /0 1 /1 7 1 0 /0 1 /1 7 1 1 /0 1 /1 7 1 2 /0 1 /1 7 0 1 /0 1 /1 8 0 2 /0 1 /1 8 Date 0 20 40 60 80 100 D a ily A c c u m u la te d P re c ip it a ti o n ( m m ) Coverage km 644+000 m to 661+000 m RG1 - km 652+900 m RG2 - km 660+570 m Traffic crashes 1 5 9 13 3 7 11 15 D a ily T ra ff ic C ra sh e s C o u n t
Precipitation was present at most of the days during the year of analysis, being equal to 82.41% (RG1) and 93.75% (RG2). The drizzle (Chu) days represent 35.37% (RG1) and 36.25% (RG2), followed by light (Fa) and moderate (Mo) precipitation days with 18.52% and 19.44% (RG1) and 27.50% and 22.50% (RG2). The registration of heavy (Fo) precipitation was less pronounced, being equal to 8.70% (RG1) and 7.50% (RG2). The extreme (Ex) precipitation did not have a considerable frequency, with percentages of 0.37% (RG1) and 0.00% (RG2).
The crashes count during the period of one year (365 days) were evaluated. For the RG1 segment were registered 133 crashes and for the RG2 segment 80 crashes.
The segments showed a signi(icant difference in the number of crashes registered, with the segment RG1 containing 66,25% more crashes considering the total number from RG2, despite the RG2 segment being more winding as shown in Figure 1. This may be related to the fact that the segment covered by the rain gauge RG2 presents 5 speed radars, whereas in the segment from rain gauge RG1 the highway has only 1 speed radar installed, that force drivers to slowdown. It should be noted, however, that the distribution of crashes per kilometers is not homogeneous (Figure 4).
(a) (b)
Note: Datum SIRGAS 2000 UTM Zone 23S
Figure 4. Number of traffic crashes per kilometer (a) RG1 (b) RG2
It was veri(ied that crash without injury was majority, representing 63.15% (RG1) and 58.75% (RG2), during the year of analysis. From those who suffered injury, minor injuries were preponderant, being equal to 30.00% (RG1) and 31.25% (RG2), comparing with serious or fatal.
Furthermore, it was identi(ied the presence of a curve at the accident location, representing 67.96% (RG1) and 82.50% (RG2), corroborating this segment as more sinuous. About the road direction (in terms of kilometers), more crash occurrences were registered at the ascending way for RG1 dataset (56.85%) where drivers are going downhill at the highway; and at descending way for RG2 dataset (67.50%) where drivers are going uphill at the highway, this difference is also associated with the presence of speed radars (already mentioned) downhill.
4.2. Input data for MCA
The MCA analysis starts with the de(inition of the categorical variables. In this study the categorical variables were extracted from the described dataset, and were used as the input in the model. Table 1 contains the variables names that were included in the analysis, their notation and number of categories for each variable and their frequency. These variables were
split in principal variables (curve, precipitation, with or without injury and road direction) and supplementary variables (precipitation category, injury severity and road structure). The former are the ones which contribute to MCA statistics, whereas the latter are used only to be plotted in the 2-dimensional map, in order to provide insight to the interpretation of the results.
Table 1 – Summary of variables, categories, and frequency
Variable name Number of categories Frequency RG1 (%) Frequency RG2 (%) Frequency RG1_RG2 (%)
Principal variables Curve (Cr) 2 0 (no) 32.04 17.50 30.16 1(yes) 67.96 82.50 69.84 Precipita on (Chu) 2 0 (no) 17.59 6.25 16.77 1(yes) 82.41 93.75 83.23
With injury (Feri) 2
0 (no) 63.15 58.75 62.58 1(yes) 36.85 41.25 37.42 Road direc on (SV) 2 C (ascending) 56.85 32.50 53.71 D (descending) 43.15 67.50 46.29 Supplementary variables Precipita on category (PCT) 5 Ch (drizzle) 35.37 36.25 31.13
Fa (light precipita on) 18.52 27.50 25.48
Mo (moderate precipita on) 19.44 22.50 26.61
Fo (heavy precipita on) 8.70 7.50 0.00
Ex (extreme precipita on) 0.37 0.00 0.00
Injury Severity (GA) 3
Ll (minor injuries) 30.00 31.25 30.16
Lg (serious injuries) 4.63 5.00 4.68
F (fatal) 2.22 5.00 2.58
Road structure (EV) 5
Re (straight road) 27.96 16.25 26.45
Rtr (return) 0.92 0.00 0.81
Des (detour) 2.78 1.25 2.58
Rot (roundabout) 0.19 0.00 0.16
Via (bridge) 0.19 0.00 0.16
4.3. Results from MCA
The coordinates obtained from the MCA analysis, considering only the (irst two dimensions are presented at Table 2. These coordinates are used to plot the categories cloud. In the RG1 analysis, it was found that precipitation (Chu) and curve (Cr) were dominant in dimension 1, while in contrast, in dimension 2 the most in(luential variable was the road direction (SV). In the other hand, for RG2, the dominant variables in dimension 1 were precipitation (Chu) and curve (Cr), while in dimension 2 crash with injury (Feri) was the one variable with greater inertia. Finally, it can be checked on the RG1_RG2 combined analysis that the dominant variables in dimension 1 were also precipitation (Chu) and curve (Cr), while dimension 2 had as dominant variables crash with injury (Feri) and road direction (SV). It should be noted that the dominant variables in the dimension 2 of RG1_RG2 analysis were the combination of the dominant variables for the same dimension obtained on the RG2 and RG1 analysis separately.
Table 2 – Categories coordinates (principal variables)
Category RG1 RG2 RG1_RG2
Dim. 1 Dim. 2 Dim. 1 Dim. 2 Dim. 1 Dim. 2
Curve (Cr) 0 (no) 0.422 -0.081 0.824 0.039 0.469 0.039 1(yes) -0.372 0.071 -0.333 -0.016 -0.376 -0.031 Precipita on (Chu) 0 (no) 0.876 -0.186 1.605 0.441 0.954 -0.034 1(yes) -0.187 0.040 -0.107 -0.029 -0.192 0.007
With injury (Feri)
0 (no) -0.195 -0.231 -0.215 0.382 -0.169 0.283
1(yes) 0.327 0.387 0.291 -0.517 0.275 -0.46
Road direc on (SV)
C (ascending) 0.022 -0.371 0.717 0.147 0.168 0.358
D (descending) -0.029 0.489 -0.345 -0.071 -0.195 -0.416
MCA analysis based on a Burt matrix suggests that the number of dimensions should be considered by eigenvalues greater than 1/Q2, with Q representing the number of principal
variables (Abdi and Valentin, 2007). Therefore, in the analysis considered herein, with four principal variables, the value of the eigenvalues should be greater than 0.0625. Considering the eigenvalues for the (irst two dimensions it was enough to construct a two-dimensional plot, as found in the literature (Das and Sun, 2016; Abdi and Valentin, 2007). Moreover, this type of map can accommodate more easily a visual interpretation on the categorical data than three-dimensional maps.
Both the eigenvalues and percentages of variance in respect to the variables obtained are presented at Table 3. By factor analysis, it can be determined the dominant variables that occur in the dimensions, that is, the variables which are responsible for explaining the variance. It can also be checked that, the percentage of variance explained by two dimensions had the lowest value (65.08%) in the case of RG1 dataset, the highest value (81.38%) in the case of RG2 dataset and the intermediated value (68.72%) for the combination dataset RG1_RG2.
Table 3 – Eigenvalues and percentage of variance in the dimensions created by the model Dimension Eigenvalues Percentage (%) Cumula7ve percentage (%)
RG1 1 0.0963 37.47 37.47 2 0.0710 27.61 65.08 3 0.0490 19.06 84.14 4 0.0408 15.86 100.00 RG2 1 0.1889 62.90 62.90 2 0.0555 18.47 81.37 3 0.0372 12.38 93.75 4 0.0188 6.25 100.00 RG1_RG2 1 0.1097 41.92 41.92 2 0.0701 26.80 68.72 3 0.0461 17.59 86.31 4 0.0358 13.69 100.00
4.4. Perceptual maps from MCA
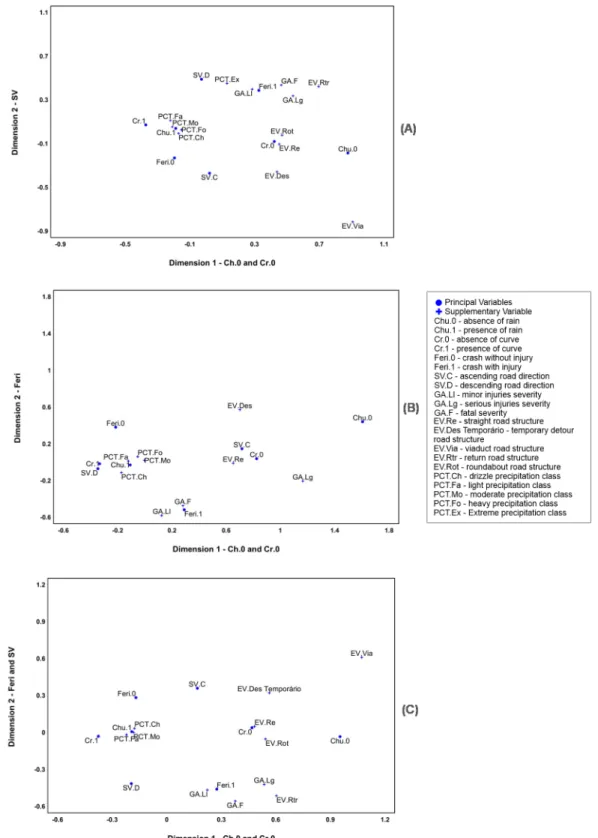
The perceptual maps, i.e, MCA plots, obtained show the categories cloud for the three considered areas (RG1, RG2 and RG1_RG2). It can be interpreted with respect to the relative
closeness of the input variable categories, including supplementary variable categories (Figure 5).
Concerning the results that were similar in the three obtained maps, it can be veri(ied that precipitation categories tend to stay close to the point that represent presence of rain (Chu.1). In addition to that, these points are located aside from the category no precipitation (Chu.0). This is not only coherent, but also suggests that the amount of precipitation tends to have a reduced impact on the crash circumstances considered in the analysis herein. That is to say, the presence or absence of precipitation seems to have in(luence on the crash characteristics, which is highlighted by the distance between the Chu.0 and Chu.1 categories. Nonetheless, this aspect differs from the number of crashes registered, a fact that could not be explained by the MCA analysis.
The only exception is the supplementary category extreme rain (PCT.Ex) on the RG1 analysis, which was located much more distant to the presence of rain category (Chu.1). That is coherent because this class of precipitation is much less frequent (0.37%), thus (iguring as an outlying point. The category extreme rain (PCT.Ex) on the RG2 analysis did not appear because it was not registered.
Another insight concerning precipitation veri(ied in all analyses is that crashes that occurred in the presence of rain (Chu.1) are related to the ones that took place in curves (Cr.1). This observation may seem trivial, but the statistical approach gives it a numerical con(irmation. One possible reason for it is that the rain affects the slipperiness of the road, as explained by Mannering and Bhat (2014), because a thin oily layer is formed in the pavement after the rain falls. On curves, the slipperiness is the same as on straight segments, but on curves this factor enhances the crash probability as the car changes its trajectory. As the grip is lower, the car tends to follow a straight path.
This conclusion can, in addition, lead to practical implications concerning road safety, especially in a highway with sinuous segments such as the one considered in this study. Since it was found that crashes taking place in curves tend to be related to the presence of rain, road traf(ic agencies should take special care when implementing traf(ic signs, alerting drivers of slipperiness in the road, as well as accentuated crash risk in the presence of rain. For example, a road sign that could be implemented in these conditions is the “slippery road” (Brasil, 2007). Educative signs should also be considered, alerting for the same increased accident risk in the presence of rainfall.
Another practical application of these issues is that highway emergency services, which in Brazil includes PRF and the Military Fire Department, corroborate for their necessity of alert status during rainfall periods, in spite of the precipitation amount.
Concerning the results from injury severity, it can be veri(ied that the categories (Ga.Ll, GA.Lg and GA.F) tend to stay close to the point that represent crash with injury (Feri.1). In addition to that, these points are located aside from the category crash without injury (Feri.0). This is also coherent, and as the category crash without injury (Feri.0) is close to presence of rain (Chu.1), it suggests that the amount of precipitation tends to have a reduced impact on the presence of injuries, it this case.
An additional remark is that crashes without injuries (Feri.0) seemed to be surprisingly linked to the circumstances of curve (Cr.1) and precipitation (Chu.1). One could expect the opposite, but the fact could possibly be explained by risk compensation (Mannering and Bhat, 2014). This concept describes that drivers, while facing environmental issues, such as the case
of rainfall, tend to enhance their attention and reduce their speed, when compared to the ideal situation (that is, without precipitation). Cheng et al. (2017) found a negative relationship between rain and motorcycle crash probability. The authors described that the wet road surfaces during rainfall act as a deterrent for the riders to indulge and then the chances of a crash tend to drop. Thus, the crash could tend towards lesser injuries severity. However, one should consider that risk compensation factor does not alter road slipperiness: accidents still tend to happen at curves, even though without injured individuals.
Furthermore, the presence of curve (Cr.1) does not seem to in(luence injury incidence (Feri.0) for RG1 segment at ascending direction (SV.C), and the descending direction of the road (SV.D) is more related to the incidence of injuries (Feri.1). For RG2 segment, crashes were related to curve (Cr.1) and precipitation (Chu.1) on descending direction (SV.D), whereas for ascending (SV.C) they seem to be more linked to situations outside curves (Cr.0) and without precipitation (Chu.0).
Finally, results from all (ive road structures (EV), such as straight road (EV.Re), return (EV.Etr), detour (EV.Des), roundabout (EV.Rot) and bridge (EV.Via) could not be analyzed qualitatively, because of their low frequency at the three considered areas (RG1, RG2 and RG1_RG2).
At last, it is important to highlight that this work is somehow limited, as all researches at some point. For instance, the dataset of precipitation applied in the analysis was based on a period of one year, which might be seen as a poor crashes-precipitation sample over years. Nonetheless, as previously stated, an ANOVA showed that there was not any statistical difference between the rain data registered in years before the considered study period. In addition, this period of one year was de(ined to consider recent data and encompass a period without interruption in data recording, while also covering the four seasons, reducing seasonality effects.
Furthermore, another limitation is the composition of variables chosen to be used in the statistical analysis, from all the accident dataset documented by PRF. The principal variables were de(ined considering that the percentage of variance had to be explained by the (irst two dimensions with a considerable percentage. In the presented maps and results, this percentage was not less than 65%. Indeed, more variables could have been included, but that choice would lead to a decrease in the variance explained by the created model (Das and Sun, 2016).
As a (inal point, this study was based in a qualitative approach to de(ine the relationship of precipitation and traf(ic crashes characteristics in the BR-376 Highway. The results are very useful to de(ine the patterns of the accident characteristics in the road extensions. In order to quantify the weather effects on traf(ic crashes frequency, future studies in the same study area should be encouraged to take a quantitative approach, as for example count regression techniques (which include Poisson or Negative Binomial models).
5. CONCLUSIONS
This study presented a multivariate analysis of traf(ic crashes data (from March 2017 to February 2018) with a focus on precipitation due to the available information coming from two rain gauges installed along a speci(ic segment of the BR-376 Highway, located in the Paraná State, Brazil. MCA was used to analyze crash qualitative data, especially with respect to rainfall and crash characteristics. The study showed that precipitation tends to shape characteristics of the crashes, although increased rainfall intensity did not seem to affect crash severity. It was also observed that, crashes without injuries are linked to characteristics of curve and precipitation. Furthermore, presence of accidents located in curves seemed to be related to the precipitation occurrence, which may be linked to the slipperiness of the road, alerting that this should be a concerning issue to traf(ic authorities. To this extent, these results could also be of help to the traf(ic agencies to implement modi(ications on traf(ic signs and traf(ic engineering measures to increase road safety.
REFERENCES
Abdi, H.; D. Valentin. (2007). Multiple correspondence analysis. Encyclopedia of measurement and statistics, p. 651-657. Bergel-Hayat, R.; M. Debbarh; C. Antoniou; G. Yannis. (2013). Explaining the road accident risk: Weather effects. Accident
Analysis and Prevention, Elsevier, n. 60, p. 456-465. https://doi.org/10.1016/j.aap.2013.03.006
Black, A. W.; T. L. Mote. (2015). Effects of winter precipitation on automobile collisions, injuries, and fatalities in the United States. Journal of Transport Geography, n. 48, p. 165-175. DOI: 10.1016 / j.jtrangeo.2015.09.007.
Brasil. Código de Trânsito Brasileiro (CTB). Lei Nº 9.503, de 23 de setembro de 1997 que institui o Código de Trânsito Brasileiro. Presidência da República. Casa Civil. Subche(ia para Assuntos Jurı́dicos. Brası́lia: 2007.
Calef(i, F.; S. T. Lucchesi; M. J. Anzanello; H. B. B. Cybis. (2016). In(luência das condições climáticas e de acidentes na caracterização do comportamento do tráfego em rodovias. Transportes, v. 24, n. 4, p. 57-63. DOI: 10.14295 / transportes.v24i4.1104.
Cheng, W.; G. S. Gill; T. Sakrani; M. Dasu; J. Zhou. (2017). Predicting motorcycle crash injury severity using weather data and alternative Bayesian multivariate crash frequency models. Accident Analysis and Prevention, n. 108, p. 172-180. DOI: 10.1016 / j.aap.2017.08.032.
Das S.; X. Sun. (2015). Factor association with multiple correspondence analysis in vehicle–pedestrian crashes. Transportation Research Record, v. 2519, n. 1, p. 95-103. DOI: 10.3141 / 2519-11.
Das, S.; X. Sun. (2016). Association knowledge for fatal run-off-road crashes by Multiple Correspondence Analysis. IATSS Research, v. 39, n. 2, p. 146-155. DOI: 10.1016 / j.iatssr.2015.07.001.
Eisenberg, D. (2004). The mixed effects of precipitation on traf(ic crashes. Accident Analysis and Prevention, v. 36, n. 4, p. 637-647. DOI: 10.1016 / S0001-4575(03)00085-X.
Factor, R.; G. Yair; D. Mahalel. (2010). Who by accident? The social morphology of car accidents, Risk Analysis: An International Journal, v. 30, n. 9, p. 1411-1423. DOI: 10.1111 / j.1539-6924.2010.01423.x.
Ferreira, K. S. de M.; L. P. Sestrem; A. M. G. Acevedo; A. C. M. Kormann; V. P. Faro. (2018). Instrumentação geotécnica como ferramenta de gestão de riscos rodoviários: um estudo de caso no trecho de Serra do Mar da BR 376/PR. Revista Técnico-Cientı́(ica do CREA-PR, v. 1, n. 11.
Fontaine, H. (1995). A typological analysis of pedestrian accidents. In: 7th workshop of ICTCT, Paris, p. 26–27. Hasui, Y.; C. D. R. Carneiro; F. F. M. de Almeida; A. Bartorelli. (2012). Geologia do Brasil. Beca, p. 900.
Hermans, E.; T. Brijs; T. Stiers; C. Offermans. (2006). The impact of weather conditions on road safety investigated on an hourly basis. Transportation Research Board.
Hoffman, D. L.; J. Leeuw. (1992). Interpreting multiple correspondence analysis as a multidimensional scaling method. Marketing Letters, v. 3, n. 3, p. 259-272.
Kaciak, E.; J. Louviere. (1990). Multiple correspondence analysis of multiple choice experiment data. Journal of Marketing Research, v. 27, n. 4, p. 455-465. DOI: 10.1177 / 002224379002700407.
Karlaftis, M.; G. Yannis. (2010). Weather effects on daily traf(ic accidents and fatalities: a time series count data approach. In: Proceedings of the 89th Annual Meeting of the Transportation Research Board, January 10 14, Washington DC, USA. Le Roux, B.; H. Rouanet. (2010). Multiple Correspondence Analysis, Sage Publications, Washington D.C.
Mannering, F. L.; C. R. Bhat. (2014). Analytic methods in accident research: Methodological frontier and future directions. Analytic Methods in Accident Research, v. 1, p. 1-22.
Mannering, F. L.; V. Shankar; C. R. Bhat. (2016). Unobserved heterogeneity and the statistical analysis of highway accident data. Analytic Methods in Accident Research, v. 11, p. 1-16.
Martensen, H.; N. Focant; K. Diependaele. (2016). Let’s talk about the weather – interpretation of short term changes in road accident outcomes. Transportation Research Procedia, v. 14, p. 96-104. DOI: 10.1016 / j.trpro.2016.05.045.
Polı́cia Rodoviária Federal (PRF). Acidentes de trânsito. <https://www.prf.gov.br/portal/dados-abertos/acidentes>. Accessed Jan., 2019.
Sehaber, V. F. (2013). Análise estatı́stica multivariada dos acidentes de trânsito da BR-376 no perı́odo entre os anos de 2009 e 2012. Master dissertation – Numerical Methods in Engineering, Federal University of Paraná, Curitiba.
Shankar, V.; F. Mannering; W. Bar(ield. (1995). Effect of roadway geometrics and environmental factors on rural freeway accident frequencies. Accident Analysis and Prevention, v. 27, n. 3, p. 371-389. DOI: 10.1016 / 0001-4575(94)00078-Z. Smith, K. (2008). How seasonal and weather conditions in(luence road accidents in Glasgow. Scottish Geographical Magazine,
v. 98, n. 2, p. 103-114. DOI: 10.1080 / 00369228208736523.
Theo(ilatos, A.; G. Yannis. (2014). A review of the effect of traf(ic and weather characteristics on road safety. Accident Analysis and Prevention, v. 72, p. 244-256. DOI: 10.1016 / j.aap.2014.06.017.
Trevizolli, M. N. B.; A. C. M. Kormann; V. P. Faro; L. P. Sestrem; L. D. B. Passini. (2018). Análise de registros históricos de precipitações e rupturas de encostas para composição de limiares pluviométricos visando monitoramento de taludes rodoviários. Revista Técnico-Cientı́(ica do CREA-PR, v. 1, n. 11.
Victorino, M. M.; L. P. Sestrem; A. C. M. Kormann. (2017). De(inição de uma faixa pluviométrica crı́tica para de(lagração de movimentos de terra em taludes rodoviários localizados no trecho da serra do mar da rodovia BR 376/PR. Transportes, v. 25, n. 1, p. 113-120. DOI: 10.14295 / transportes.v25i1.1038.
Vieira, B. C.; M. F. Gramani. (2015). Serra do Mar: The most “tormented” relief in Brazil. Landscapes and Landforms of Brazil, p. 285-297. DOI: 10.1007 / 978-94-017-8023-0_26.
Wanvik, P. O. (2009). Effects of road lighting: An analysis based on Dutch accident statistics 1987-2006. Accident Analysis and Prevention, v. 41, n. 1, p. 123-128. DOI: 10.1016 / j.aap.2008.10.003.
World Health Organization. The top 10 causes of death. <www.who.int/news-room/fact-sheets/detail/the-top-10-causes-of-death>. Accessed July, 2018.
Zhang, C.; J. N. Ivan; W. M. ElDessouki; E. N. Anagnostou. (2005). Relative risk analysis for studying the impact of adverse weather conditions and congestion on traf(ic accidents. In: 84th annual meeting of the Transportation Research Board, Washington, USA.