A Bayesian approach to
NDT Data Fusion for St.
Torcato Church
DECLARATION
Name: Mayank MISHRA
Email: [email protected]
Title of the
Msc Dissertation: A Bayesian approach to NDT Data Fusion for St. Torcato Church
Supervisor(s): Prof. Luís F. Ramos and Prof. Tiago Filipe Silva Miranda
Year: 2012 / 2013
I hereby declare that all information in this document has been obtained and presented in accordance with academic rules and ethical conduct. I also declare that, as required by these rules and conduct, I have fully cited and referenced all material and results that are not original to this work.
I hereby declare that the MSc Consortium responsible for the Advanced Masters in Structural Analysis of Monuments and Historical Constructions is allowed to store and make available electronically the present MSc Dissertation.
University: University of Minho, Portugal
Date: July 2013
ACKNOWLEDGEMENTS
This thesis involves support of so many people directly or indirectly right from beginning till end of my thesis. I can’t possibly write all forms of support I got over this SAHC masters so please spare me if I missed someone. Among all of support, I would like to express by special thanks to:
• Professor Luís Ramos, my supervisor who guided me throughout the thesis by giving his ideas and support to me and the interesting discussions we had helped me a lot to make my thesis go in right direction. He provided me with all the data from St Torcato church and kept giving me suggestions from time to time on how to include every single piece of information to arrive to a more confident value of parameter.
• Professor Tiago Filipe Miranda, my co-supervisor who helped me a lot with Bayesian updating which I had no idea from beginning but he patiently explained me his research paper and excel sheets. After he explained me his excel sheets which he had done for Bayesian updating then it was very easy for me to put into Matlab the algorithm he explained me and making Graphical User Interface was simple from that point.
• Erasmus Mundus consortium whom I owe the most as they provided me full support throughout the course and without them it won’t be even possible for me to finish this course.
• PhD student Marisa Pinheiro who helped me to calculate weightage factors for different NDT data and explaining me her research which modified my approach to find elastic modulus. Elizabeth manning who helped me figuring out the data from St. Torcato church and giving her suggestions and some advice about how to deal with it.
• For the coursework I would thank Professors who taught me in Padova Paolo Franchetti, Paulo Lourenço, Carlo Pellegrino, Flippo Casarin, Pere Roca, Luca Pela, Petr Kabele, Luigia Binda, Enrico Garbin, Claudio Modena, Milo˘s Drdácký, Graça Vasconcelos, Enric Vázquez, Ji˘rí Bláha, SA3 tutor Michele Frizzarin and SA7 guide Giulia Bettiol.
• Ana Fonseca, SAHC Secretariat for helping me in solving all the problems I faced in Guimarães. Elisa Trovo from University of Padova for her support to complete all my paperwork in Italy and serving as a mentor right from the start.
My dear parents Shri Vijay Kant Mishra and Kavita Mishra who encouraged me to go for further studies whom I missed them throughout out the year. My brother Shashank who kept me motivated by making me smile. My grandmother Priyamvada Mishra in heaven, for all support she gave me throughout my life and all the memories she has left in my heart will keep me motivated throughout my life. My fellow SAHC friends which I met during this programme in Padova and Guimarães which will I will remember all my life and how this course helped me to learn their culture from different countries. Last but not the least typesetting program LATEXwhich made formatting of the thesis much easy. The SAHC Masters was no
ABSTRACT
The main objective of this thesis is to combine information gathered from different Non Destructive tests (NDT) (direct and indirect) and fuse it by using Bayesian approach. Many time practitioners working with NDT data want to choose parameters based on results of different NDT tests with different levels of reliability and uncertainty quantification. As suggested by literature the use of a single technique might not suffice to gain information and the combination of different techniques is recommended. Also for the case of masonry structures it might not be possible to perform destructive tests but since the parameter has to be estimated based on information provided by various NDT data sources coupled with literature information.
NDT data from San Torcato Church was used in this thesis to test a Methodology to transform the data into a single and uniform format by the help of Bayesian approach. A simple Matlab Toolbox NDT_FUSION was developed and tested with different models available and modified later by using a Trust Factor which takes into account the weightage of different NDT tests. The developed toolbox is very easy to use since it has Graphical user interface (GUI) and does not required practitioner to learn the complex mathematics involved in calculation behind the Bayesian black box. The data fusion was done at different levels and steps so every time an updating takes place we arrive to a more realistic value of parameter.
Two geomechanical parameters namely the Elastic modulus (E) and compressive strength ( fc) of granite
blocks from St. Torcato Church were studied in this thesis. The normal probability distribution function for the parameter of interest was calculated by using Jeffrey’s Prior and Conjugate Prior, considering different levels of initial knowledge. The Elastic modulus (E) was updated by using data from Literature knowledge, sonic, ultrasonic and direct compressive strength tests to arrive to a more certain value in form of a posterior distribution. In both the cases the raw data from direct and indirect sources was processed and combined with data fusion toolbox to transform values into statistical distribution. The reliability confidence intervals of parameters were updated every time a new data becomes available providing more broad information. Different levels of uncertainty are present in data fusion system proposed in this report starting from the literature knowledge to direct compression test core data which were quantified and addressed in this thesis.
The tests of different reliability levels were weighed by circulating a survey form among professors and graduate students experts in the field to take their opinion. The results of the surveys come was the calculation of Trust Factor to update the spread of the parameters and incorporate in the model to obtain better predication of the parameters. The application developed comes with a Matlab compiler runtime (MCR) installer which allows the application to run on computers without the prerequisite of having Matlab installed.
RESUMO
Quando na inspeção e diagnóstico de estruturas se utilizam diferentes métodos de ensaios destrutivos e não destrutivos, pela natureza dos seus resultados (qualitativos e/ou quantitativos), existem muitas incertezas associadas na quantificação de parâmetros mecânicos essenciais para as análises estruturais. Tal como a literatura da especialidade sugere, o uso de uma técnica de inspeção isolada pode não ser suficiente para obter-se a informação desejada, tornando-se recomendável a utilização de diferentes técnicas ou métodos para corroborar os resultados. No caso de construções históricas muitas vezes não é possível realizar ensaios destrutivos, sendo apenas realizados ensaios não destrutivos que, muitas vezes, oferecem apenas resultados qualitativos, sendo usual combinar métodos e ensaios com valores de referência existentes na literatura mas caracterizados por terem grande dispersão de resultados.
O objetivo principal da presente dissertação é combinar os resultados obtidos por via de diferentes ensaios não-destrutivos (diretos e indiretos) e fundi-los usando uma metodologia com recurso á inferência bayesiana e a técnicas de fusão de dados. Os ensaios não destrutivos realizados na igreja de S. Torcato em Guimarães foram usados para validar a metodologia. Como resultado foi elaborada uma toolbox no software Matlab que permite a fusão de diferentes dados para a estimativa de parâmetros mecânicos, tais como o módulo de elasticidade ou a resistência à compressão do granito utilizado na construção da igreja. A toolbox tem uma interface gráfica simples de utilizar e permite uma análise incremental, obtendo-se no final valores médios, desvios padrão e intervalos de confiança para cada parâmetro em estudo.
Tendo em consideração as incertezas e as diferenças entre os diferentes métodos de ensaio, foi também adicionado à metodologia um fator de confiança aplicável a cada método de ensaio. Para tal foi realizado um inquérito a um conjunto de especialista e utilizadores de ensaios não-destrutivos. Esse inquérito permitiu aferir a confiança do utilizador perante a utilização de um método na quantificação de um parãmetro estrutural, quando comparado com outros diferentes métodos. À metodologia adotada inicialmente foi então aplicado o fator de confiança majorando ou minorando as incertezas associadas a cada método.
Contents
Page 1 INTRODUCTION 1 1.1 General considerations . . . 1 1.2 Objectives . . . 1 1.3 Chapter-wise breakup . . . 22 TESTING AND MONITORING TECHNIQUES FOR MASONRY CONSTRUCTIONS 5 2.1 Non-Destructive Techniques (NDT) . . . 6
2.1.1 Visual Inspection . . . 6
2.1.2 Sonic Testing . . . 6
2.1.3 Cover meter / Ferroscan Tests . . . 8
2.1.4 Schmidt Hammer . . . 9
2.1.5 Coin tap test . . . 9
2.1.6 Ultrasonic Testing . . . 10 2.1.7 Acoustic Emission . . . 11 2.1.8 Resistivity measurements . . . 12 2.1.9 Infrared measurements . . . 12 2.1.10 Georadar . . . 13 2.1.11 Conductivity Measurements . . . 14 2.2 Minor-Destructive Testing (MDT) . . . 14
2.2.1 Single and Double Flat jack tests . . . 14
2.2.2 Dilatometer techniques . . . 16
2.2.3 Endoscopy . . . 16
2.3 Destructive tests . . . 17
2.3.1 Compression tests . . . 17
2.4 Crack Monitoring . . . 18
2.4.1 Glass Crack Meters . . . 18
2.4.2 Crack Meters . . . 18
2.5 Computers in NDT . . . 19
2.6 Discussion of NDT methods used for St Torcato case study . . . 19
2.7 Conclusions . . . 20
3.1 Data Collection for S. Torcato church . . . 23
3.1.1 Schmidt Hammer Tests . . . 23
3.1.2 Granite Sonic Tests . . . 24
3.1.3 Granite Ultrasonic tests . . . 26
3.1.4 Granite cylinder compression tests . . . 27
3.2 Data Fusion . . . 28
3.2.1 Definition and General overview . . . 28
3.2.2 Levels of Data fusion . . . 30
3.2.3 Different techniques of data fusion . . . 30
3.2.3.1 Probabilistic Fusion . . . 30
3.2.3.2 Data fusion using Artificial Intelligence (AI) . . . 30
3.2.4 Performed Data fusion using S. Torcato as case study . . . 31
3.2.4.1 Data Fusion from Direct and Indirect data sources . . . 32
3.3 Introduction to Bayesian Statistical theory . . . 34
3.3.1 Bayesian inference . . . 35
3.3.2 Bayesian inference using Jeffreys prior . . . 36
3.3.3 Bayesian inference using conjugate prior . . . 37
3.4 Dealing with different uncertainties . . . 38
4 BAYESIAN RELATIONSHIPS FOR ESTIMATING COMPRESSIVE STRENGTH AND ELASTIC MODULUS OF STONE GRANITE BLOCKS 41 4.1 Estimation of mean granite strength ( fc) when only core compressive strength testing data is available using approach by Kryviak et al. . . 42
4.1.1 Prior information . . . 42
4.1.2 Bayesian updating and test results . . . 43
4.2 Estimation of mean granite strength when only core compressive strength testing data is available using Jeffreys prior . . . 44
4.3 Estimation of mean granite strength when only core compressive strength testing data is available using conjugate prior . . . 45
4.3.1 Conclusions and Results . . . 47
4.4 Update of Elastic Modulus of Granite E using Bayesian Technique . . . 48
4.4.1 Determination of Posterior using Jeffreys prior for Elastic Modulus of granite . . . 48
4.4.2 Bayesian Model Incorporating data from sonic tests using conjugate prior . . . 49
4.4.3 Bayesian Model Incorporating data from sonic and ultrasonic tests . . . 51
4.4.4 Conclusions from Bayesian model to calculate Elastic modulus (E) . . . 53
5 DESCRIPTION OF MATLAB TOOLBOX MADE FOR DATA FUSION AND CALCULATIONS OF TRUST FACTOR (T) 55 5.1 Description of Matlab toolbox NDT_FUSION and NDT_FUSION_TRUST . . . 55
5.2 Need for trust factor for NDT tests . . . 56
5.2.2 Methodology for calculating weightage of each NDT test . . . 57
5.2.3 Calculations Explained- The weighting factor determination . . . 59
5.2.4 Weightage factor for for NDT tests used in calculating elastic modulus of granite block 59 5.3 Weightage factor for NDT tests used in calculating granite compressive strength . . . 61
5.3.1 The Weighting factor determination for calculating compressive strength . . . 61
5.4 Proposal for Trust Factors . . . 62
5.5 Calculated trust factors for two NDT tests . . . 62
5.5.1 Compressive strength of granite blocks including proposed trust factor . . . 62
5.5.2 Modified Algorithm for data fusion . . . 63
5.5.3 Results including trust factor for compressive strength ( fc) of granite block . . . 63
5.5.4 Elastic modulus of granite blocks including proposed trust factor . . . 65
5.6 Conclusion including trust factor . . . 66
6 CONCLUSIONS AND FUTURE RESEARCH 69 6.1 Conclusions . . . 69
6.2 Future Research . . . 70
A Supplementary Material for Simulation Algorithm and MCMC 75
B MATLAB CODES FOR DIFFERENT BAYESIAN MODELS 77
C FORM for Survey for preference of NDT tests 83
D Calculation to calculate weightage of each NDT test 95
List of Figures
1.1 San Torcato Church [1] . . . 1
2.1 Classification of different tests used in masonry and historical constructions . . . 5
2.2 Hammer to generate pulse for sonic test [2] . . . 7
2.3 Installation of Grid for sonic test [2] . . . 7
2.4 Distribution of sonic velocities [2] . . . 7
2.5 Histogram of velocities [2] . . . 7
2.6 Direct Test [3] . . . 7
2.7 Semi-Direct test [3] . . . 7
2.8 Indirect Test [3] . . . 7
2.9 Hilti Ferroscan PS200 - Scanner [2] . . . 8
2.10 Testing of wall by ferroscan [2] . . . 8
2.11 Display on Ferroscan screen [2] . . . 8
2.12 Details of imported Ferroscan survey file on computer [2] . . . 8
2.13 Scmidt Hammer [6] . . . 9
2.14 Sonic resonance method/coin tap test [8] . . . 10
2.15 a) A Scan plot b) Typical Ultrasonic pulse echo system [9] . . . 10
2.16 Ultrasonic Test setup [10] . . . 11
2.17 Performing Ultrasonic Test [10] . . . 11
2.18 Ultrasonic Test crack values [10] . . . 11
2.19 Acoustic Emission system [12] . . . 12
2.20 Set up for resistivity measurement [13] . . . 12
2.21 Detection of hidden tie rods using thermal vision [10] . . . 13
2.22 Target wall [10] . . . 13
2.23 Radargram profile showing several voids [10] . . . 13
2.24 Detection of hidden tie rods using thermal vision [10] . . . 14
2.25 Procedure flat jack test [10] . . . 15
2.26 a) Double flat jack test on regular stone masonry b) Stress strain curve [10] . . . 15
2.27 Phases of the dilatometer test [15] . . . 16
2.28 Execution of endoscopic investigation (left) and it’s endoscopic picture (right) [16] . . . 17
2.29 Compression testing on a concrete specimen [17] . . . 18
2.31 Different types of Crack Meters a) Manual Crack Meters b) Electronic Crack Meter (LVDT)
[18] . . . 19
3.1 Figure showing correlation of Schimdt Hammer rebound number and compressive strength of granite [22] . . . 24
3.2 Figure showing different stages of Compression test on a granite cylinder a)Stone 2 b)Drilling of sample c) Setup to measure elastic modulus d)Failure during compression test [20] . . . 27
3.3 Illustration of human data fusion system [24] . . . 28
3.4 Illustration of Data Fusion system combining diverse data sets into a unified (fused) data set 29 3.5 Figure Illustrating a two layer Perceptron neural network . . . 31
3.6 Illustration of Data Fusion system using Bayesian approach for San Torcato Church . . . 32
3.7 Illustration of Data Fusion system using Bayesian approach in case of indirect and direct sources of data [28] . . . 33
3.8 Ven Diagram representing the Probability of two events . . . 34
3.9 Scheme of the updating process [34] . . . 36
3.10 The decision cycle [30] . . . 36
3.11 Figure showing various types of uncertainties addressed . . . 38
4.1 Different researches done in geomechanical parameters using Bayesian approach . . . . 42
4.2 Prior and Posterior density functions for Granite compressive strength fc in MPa using core data only [31] . . . 44
4.3 Posterior density functions for Granite compressive strength fc in MPa using Jeffreys Prior for sample size n=6 & n=25 . . . 45
4.4 Prior and Posterior density functions for Granite compressive strength fc in Mpa using conjugate distribution . . . 46
4.5 Data Fusion system using Bayesian approach for updating Compressive strength fc in case of data from Literature and core compressive strength data for granite . . . 47
4.6 The Normal distribution for Literature values of Elastic Modulus (E) of granite . . . 48
4.7 Posterior density functions for Granite Elastic Modulus for normal case using Jeffreys Prior 49 4.8 Posterior density functions for Granite Elastic Modulus E before and after updating considering data from Literature, sonic and direct compressive strength data . . . 50
4.9 Data Fusion system using Bayesian approach for updating Elastic modulus E in case of data from sonic tests and compressive strength data . . . 51
4.10 Posterior density functions for Granite Elastic Modulus E before and after updating considering data from Literature, Sonic, Ultrasonic and direct compressive strength data . 52 4.11 Data Fusion system using Bayesian approach for updating Elastic modulus E in case of data from sonic, Ultrasonic and compressive strength data . . . 52
4.12 Elastic modulus updating after different steps without trust factor . . . 53
5.1 Graphical User Interface (GUI) for updating elastic modulus . . . 55 5.2 Graphical User Interface (GUI) for updating elastic modulus using trust factors T1and T2 . 56
5.3 Membership function of fuzzy delphi method [40] . . . 58
5.4 Weighing factors for NDT test used to find Elastic modulus . . . 60
5.5 Weighing factors for NDT test used to find compressive strength of granite block . . . 62
5.6 Proposed trust factor for NDT tests . . . 63
5.7 Weighing factors for NDT test used to find compressive strength of granite block without schmidt hammer . . . 63
5.8 Prior and Posterior density functions for Granite compressive strength fc in MPa using conjugate distribution including trust factors . . . 64
5.9 Data Fusion system using Bayesian approach for updating Compressive strength fc in case of data from Literature and core compressive strength data for granite including trust factors for n=6 samples . . . 65
5.10 Posterior density functions for Granite Elastic Modulus E before and after updating considering data from Literature, Sonic, Ultrasonic and direct compressive strength data including trust factors . . . 66
5.11 Data Fusion system using Bayesian approach for updating Elastic modulus E in case of data from sonic, Ultrasonic and compressive strength data including trust factors . . . 66
5.12 Plot showing update for elastic modulus after each data step with trust factor . . . 67
6.1 Prior 1 (X1) with and without trust factor . . . 69
6.2 Prior 2 (X2) with and without trust factor . . . 69
6.3 Posterior distribution (X) with and without trust factor . . . 69
E.1 Screenshot showing data fusion results of Figure 5.11 for last step including trust factors 98 E.2 Bayes estimator . . . 98
List of Tables
2.1 Different possibilities to use NDT or MDT according to parameter of interest . . . 20
2.2 Summary of NDT Methods adapted from [19] . . . 21
3.1 Table showing Schmidt hammer test results for San Torcato Church [20] . . . 24
3.2 Granite sonic test results (Block and in-situ) [20] . . . 24
3.3 Granite Stone Block 1 Direct sonic test results [20] . . . 25
3.4 Granite Stone Block 2 Direct sonic test results [20] . . . 25
3.5 Torcato church granite Direct sonic test results In-situ [20] . . . 25
3.6 Granite Stone Block 1 Semi-Direct sonic test results [20] . . . 25
3.7 Granite Stone Block 2 Semi-Direct sonic test results [20] . . . 25
3.8 Granite Stone Block 1 Indirect sonic test results [20] . . . 25
3.9 Granite Stone Block 2 Indirect sonic test results [20] . . . 25
3.10 Granite Ultrasonic test results (Block and in-situ) [20] . . . 26
3.11 Granite Stone Block 1 Direct Ultrasonic test results [20] . . . 26
3.12 Granite Stone Block 2 Direct Ultrasonic test results [20] . . . 26
3.13 Granite Stone Blocks Semi-Direct Ultrasonic test results [20] . . . 26
3.14 Granite Stone S. Torcato Semi-Direct Ultrasonic test [20] . . . 26
3.15 Granite Stone Block 1 InDirect Ultrasonic test results [20] . . . 27
3.16 Granite Stone Block 2 InDirect Ultrasonic test results [20] . . . 27
3.17 Granite compression test results [20] . . . 28
3.18 Range of parameter values for granite [Engineering Toolbox] . . . 33
4.1 Prior and posterior values for granite strength fcin MPa using constant mean and variance 43 4.2 Posterior values for granite strength fcin MPa using Jeffreys prior . . . 44
4.3 Prior and Posterior estimates of compressive strength fcin MPa using Conjugate prior . . 46
4.4 Guideline table for choosing Elastic Modulus for Rocks [38] . . . 48
4.5 Posterior values for granite Elastic modulus(E) using Jeffreys prior . . . 49
4.6 Values for granite Elastic modulus (E) for sonic velocity data (Block) generated using Monte Carlo simulation with uncertainty in Poisson ratio ν and Density ρ . . . 50
4.7 Prior and Posterior estimates of E (Normal Distribution) in GPa . . . 50
4.8 Values for granite elastic modulus (E) for sonic velocity data (block) generated using Monte Carlo simulation with uncertainty in Poisson ratio ν and density ρ . . . 51
4.9 Values for granite elastic modulus (E) for ultrasonic velocity data (block) generated using Monte Carlo simulation with uncertainty in Poisson ratio ν and density ρ . . . 51
4.10 Prior and Posterior estimates of E (Normal Distribution) in GPa considering sonic and ultrasonic data . . . 51 5.1 Sample question of the form . . . 57 5.2 Sample question of the form [40] . . . 57 5.3 All acceptable responses for survey: Part 1 . . . 59 5.4 All acceptable responses for survey . . . 61 5.5 Proposed Trust Factor for NDT tests used to find Compressive strength ( fc) . . . 64
5.6 Proposed Trust Factor for NDT tests used to find Compressive strength ( fc) without Schmidt
Hammer test . . . 64 5.7 Prior and Posterior estimates of compressive strength fc in MPa using Conjugate prior and
including trust factors . . . 64 5.8 Proposed Trust Factors for NDT tests used to find Elastic Modulus (E) . . . 65 5.9 Prior and Posterior estimates of E (Normal Distribution) in GPa considering sonic and
ultrasonic data including trust factors . . . 65 E.1 Posterior estimates of E (normal distribution) in GPa . . . 98
1
INTRODUCTION
1.1
General considerations
In many cases it is not possible to carry on destructive tests on historical constructions and one has to rely on data got from non-destructive tests and convert them into meaningful information. Data sources might also vary from qualitative to quantitative, so it becomes difficult for practitioner to arrive at some reasonable value of parameter due to so many complexities in data. This thesis takes Saint Torcato church (Figure 1.1) which is located in a small village near Guimãraes as a case study to fuse data using Bayesian inference.
Figure 1.1: San Torcato Church [1]
Several ND tests have already been carried out in the church and a monitoring system has been installed to control the current condition and to assess the success of the future intervention. This thesis aims at analyzing the recent ND test carried out on Saint Torcato church. The main objective of this thesis is to combine the information gained from different ND techniques using Bayesian approach to arrive to a more certain value of parameter for helping the practitioners in their decision making. Instead of choosing some random value for the modelling purposes for example for a parameter the model incorporates some criteria to select a more certain value with less uncertainty in it.
1.2
Objectives
The main aim is the development of methodologies for merging the information gained with different NDT methods, by means of data fusion and sensitivity analysis. As indicated in the literature review, most
researchers confirm that the use of single and isolated non-destructive techniques might not be sufficient to reliably detect or confirm a particular feature (object, feature, damage, etc.) with the exception of simple cases, which is not the case of historic masonry constructions. Therefore, it is necessary to apply different techniques within the same area or object. Secondly, different techniques use different theories and different results, which imply a large knowledge of all these techniques by the practitioner. Therefore, the objective of this thesis is to combine data produced by all different techniques, or a suitable combination of techniques, convert them into a single and uniform format and process them as a whole (or in steps) using data fusion methodologies (bayesian approach in this case).
1.3
Chapter-wise breakup
The thesis has been divided into several chapters:
Chapter 1: Introduction and Objectives of the thesis are presented.
Chapter 2: Literature review on different ND testing and monitoring techniques that can be used for
monuments and historical constructions mentioning if they are direct/indirect and what parameter they measure. Also, how different NDT techniques can be used to correlate with geomechanical parameters like Elastic modulus (E) and compressive strength ( fc) of granite blocks is studied.
Chapter 3: Bayesian interface to combine data from different tests is presented and explained. The
formulation to model uncertainties on uncertainties is presented along with its modified form including trust factor.
Chapter 4: Collecting data form different ND testing, monitoring reports of S. Torcato Church related to its
structural condition and conservation. The Chapter will includes the identification of the level of information available about the construction safety and conservation. Also this chapter proposes a method to combine information in different stages of data collection and finally update the posterior to its final form.
Subsequently, the raw data is fused in an attempt to have in a single result the contributions from different techniques. The choice of the techniques to fuse will depend on their ability to contribute positively to a feature the other techniques will fail or whose contribution is not relevant, or, on the possibility to confirm with high reliability a particular feature. The aim of this task is to look for a combination of analytical and in situ techniques capable providing broad information of the structure/construction with reliable confidence intervals.
Chapter 5: This chapter mentioned the calculation of Trust Factor. Before this proposed factor weightage of
each NDT test with respect to each other is calculated by using AHP- Analytic Hierarchy Process. Results got from Chapter 5 are again recalculated to include the result of trust factor and see how it affects the results.
A simple Graphical User Interface (GUI) was also presented in Matlab to explain and carry out this fusion process of combining data. The data is considered from St. Torcato church used as a case study and finally the Elastic modulus (E) and compressive strength of granite blocks ( fc) is estimated by this method.
Chapter 6: The previous task will lead to recommendations for designers and practitioners. Results will
be regularly analysed and re-implemented during Chapters 1 to 7 and they will be reported. Also future research work is presented in this chapter which can be done after calculating the parameters compressive strength ( fc) and elastic modulus of stone (E). A need for use of Trust factor is emphasised in this approach
2
TESTING AND MONITORING TECHNIQUES FOR MASONRY
CONSTRUCTIONS
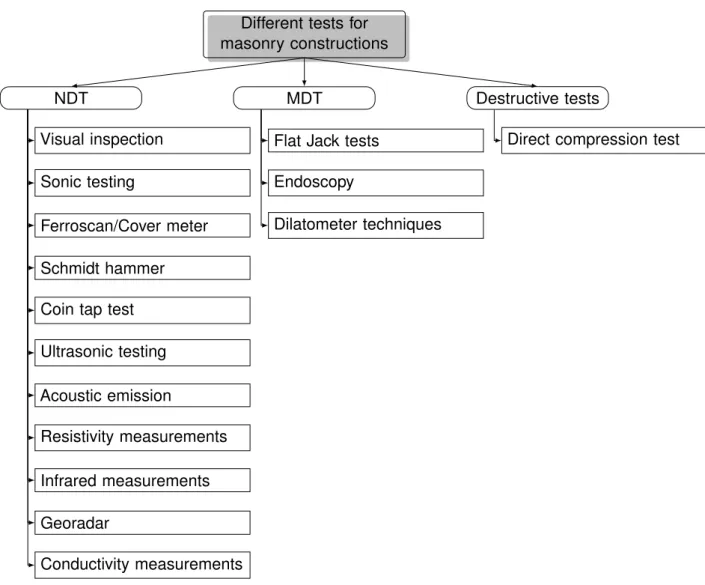
The structural monuments and Historical constructions needs to be inspected since they posses risk owing to their old construction for ensuring safety of the people. The testing methods come into two classes-Destructive in which there is some damage in the building tested and Non-destructive testing (NDT) which as such poses no damage to component being inspected. In this chapter, a list of NDT tests (See figure 2.1) will be presented and how they can be correlated to get geomechanical properties of the material.
Different tests for masonry constructions NDT MDT Destructive tests Visual inspection Sonic testing Ferroscan/Cover meter Schmidt hammer Coin tap test Ultrasonic testing Acoustic emission Resistivity measurements Infrared measurements Georadar Conductivity measurements
Flat Jack tests Endoscopy
Dilatometer techniques
Direct compression test
Since in monuments and historic constructions many things needs to be conserved like art work, graffiti and painting, NDT is a good option as far as inspection is concerned. Many tests are defined for investigating the quality of masonry some of which are explained later in this chapter.The most common NDT techniques for monuments are used in tandem to provide information about hidden characteristics and state of degradation of masonry structures.These tests can be used to evaluate many important information like detection of voids and discontinuities inside masonry, location of reinforcement, determination of physical properties of a material like compressive strength, elastic modulus, width of cracks, corrosion etc. The defects mentioned above start with minor flaws at early stage and develop into more severe flaws if not detected in time and intervened.
These tests can vary from the type of data they provide i.e. qualitative and/or quantitative and often the combination of these tests is needed to reach a conclusion. For example sonic tests can give qualitative information about a void present inside masonry or the sonic velocities can be correlated to some other property like elastic modulus or compressive strength. For example in case of Schmidt hammer results a correlation like is used to convert rebound number into equivalent compressive strength ( fc). This list
mentioned in this chapter is not exhaustive but contains most of them which are frequently used in case of masonry structures.
2.1
Non-Destructive Techniques (NDT)
2.1.1 Visual Inspection
This is most widely used of all the nondestructive tests for preliminary survey as its simple and easy to apply, quickly carried out with minimal equipments and usually lowest in cost. This is one of the most basic methods to get a rough idea depending upon what scale we want to look in. For example visual inspection can be used to detect wide prominent cracks by naked eye or with help of some supplemental aids like magnifying glass. Tools like image processing can be used in tandem to improve the quality of visual inspection. Also the images obtained can also be enhanced by using smoothing and filtering facilities.The test is very qualitative in nature and doesn’t provide any value to a parameter of interest.
2.1.2 Sonic Testing
The is done by constructing a square grid 80 cm x 80 cm (see Figure 2.3) spacing 20 cm in horizontal direction and 20 cm in vertical on a masonry wall in both inside and outside faces of the wall. A hammer (Figure 2.2) is used to generate pulse which is received by the receiver at the other end of the wall of known thickness. After this test sonic velocity contours (Figure 2.4) and sonic velocity histograms (Figure 2.5) are plotted to get an idea of masonry wall characteristics. Sonic testing can be interpreted that if the distribution of velocities is not homogeneous which is indicative of a masonry with remarkable voids and defects. Further research needs to be done on correlation like this to get a better understanding of the knowledge of level of the building. This method has been used to evaluate homogeneity of the material, depth of surface cracks, presence of voids and to get an estimate of average compressive strength and
elastic modulus of the material. The basis for determining the sonic velocity goes by measuring the time difference between the signal between the transmitter and receiver. The three set up of the tests can be seen from Figures 2.6, 2.7 and 2.8 depending upon location of transmitter and receiver.
Figure 2.2: Hammer to generate pulse for sonic test
[2] Figure 2.3: Installation of Grid for sonic test [2]
Figure 2.4: Distribution of sonic velocities [2] Figure 2.5: Histogram of velocities [2]
The test can be done in several transmission modes namely direct, indirect and semidirect tests shown in Figure 2.6, 2.7, and 2.8. The test data can be related to compressive strength and elastic modulus to get some quantitative information about the parameter of interest.
Figure 2.6: Direct Test [3]
2.1.3 Cover meter / Ferroscan Tests
The instrument commercially known as cover meter uses electromagnetic methods to determine the location and thickness of concrete above the reinforcement bars. The principle is based on the fact that steel rods embedded in concrete change electromagnetic field around the coils positioned in iron-core inducted in covermeter. It is a battery power equipment which determines the position of reinforcement, measures depth of the concrete cover and estimates the diameter of the rebar [4] in a structure in a non-destructive manner (Figure 2.9) . Its principle of operation is based on generation and detection of electromagnetic fields by conductive material. The intensity of the field generated depends on the depth and diameter of the rebar. Figure 2.10 demonstrates how the scanner is moved along the grid in horizontal and vertical directions to obtain a scan image (Figure 2.12) which in turn can be viewed in the monitor (Figure 2.11) and then later on computer screen.
Figure 2.9: Hilti Ferroscan PS200 - Scanner [2] Figure 2.10: Testing of wall by ferroscan [2]
Figure 2.11: Display on Ferroscan screen [2] Figure 2.12: Details of imported Ferroscan survey
It is a very useful equipment to find out problems when the depth of the concrete cover is inadequate and where rebar is corroded. Also when engineering defects are present from the beginning it can be used to test the distance of rebars without use of traditional drilling techniques which are destructive in nature. This is a very good test for building inspection and quality control. This scan helps in cases where construction drawings get lost or we need to find the reinforcement positions and sizes since load carrying capacity depends solely on them. There might be some error in cases when concrete is penetrated with saline water since it may effect the electrical conductivity of concrete.
2.1.4 Schmidt Hammer
Schmidt hammer test shown in Figure 2.13 is a non-destructive test which measures hardness of a material (Rebound value R) which can be correlated to the Compressive strength ( fc) by help of conversion charts .
The test is an indirect test since it doesn’t give compressive strength value directly. The rebound reading (10-100) is affected by the orientation of hammer, when used in a vertical position (on the underside of a suspended slab for example) gravity will increase the rebound distance of the mass and vice versa for a test conducted on a floor slab. The test is more useful when comparison is made between samples. For example in San Torcato church test was performed on granite which came from similar quarry and compared with original sample to prove that they are similar in characteristics. Attention must be paid to BS 1881 Point 202 [5] which states that the use of universal calibrations, such as those produced by the manufacturers of rebound hammers, can lead to serious errors and should be avoided. The conversion charts are mostly available for concrete only and for new material they need to be calibrated by doing tests.
Figure 2.13: Scmidt Hammer [6]
2.1.5 Coin tap test
This is a simple variation of impact echo method to detect defect or cavities behind linings of tunnels or areas of rendered wall where rendering has separated from stonework. The procedure is very simple in which the wall is tapped with a lightweight hammer and the ringing or echo change in frequency is
observed in the defected area. The method is very effective since human ear is much sensitive to resonant frequencies. One application of this test was to identify debonding of metal plates [7] glued to underside of concrete deck on a bridge in scotland.
Figure 2.14: Sonic resonance method/coin tap test [8]
2.1.6 Ultrasonic Testing
This method uses ultrasonic waves ( f > 20 KHz) for material examination and detection of internal flaws. As shown in Figure 2.15 by measuring the time difference betwenn the two waves the thickness or the location of the defect can be easily measured.
do= vt1/2 (2.1)
where
do= distance of the defect from specimen,
v= Speed of ultrasonic wave in the medium, t1= Time measured between the two peaks.
Also by measuring the velocity it can be correlated to other properties of the material like Elastic modulus (E) etc. The technique can range from pulse echo in which single probe is used to measure and transmit the signal (pulse echo) and pitch catch in which two transducers are used (through transmission) and both have their advantages and disadvantages. The velocity results can be related to geomechanical parameters to obtain some estimate of Elastic modulus. The Figures 2.16, 2.17 and 2.18 show the steps to carry out a Ultrasonic test on a crack and interpret the result. As seen from Figure 2.18 it can be interpreted that crack can go up to 40 cm at some location of wall being inspected.
Figure 2.16: Ultrasonic Test setup
[10]
Figure 2.17: Performing Ultrasonic Test [10]
Figure 2.18: Ultrasonic Test crack
values [10]
2.1.7 Acoustic Emission
Acoustic emission works in the principle that when a crack opens, the energy released in form of acoustic emission and high frequency stress waves can be recorded and analysed. Its main application comes in the area of crack monitoring and defect localisation [11]. Sources of AE vary from natural events like earthquakes and rockbursts to the initiation and growth of cracks, slip and dislocation movements, melting, twinning, and phase transformations in metals. It has to be supplemented with techniques like signal processing and filtering to obtain good optimum results. The methods finds its applicability in laboratory much better than on site monitoring since it can be time consuming. Unfortunately, AE systems can only qualitatively gauge extent of damage is contained in a structure. In order to obtain quantitative results about size, depth, and overall acceptability of a part, other NDT methods (often ultrasonic testing) are necessary. They allow us to estimate the depth of all important cracks observed through crack pattern survey (See Figure 2.19). However it is difficult to interpret the results of acoustic emission tests with the geomechanical parameters.
Figure 2.19: Acoustic Emission system [12]
2.1.8 Resistivity measurements
This method is a version of electrical resistivity method (See figure 2.20) used to find corrosion rates within a reinforced concrete structure. In this method the electrode is used to map the electrical resistivity through out the length of the beam. The changes of resistivity can be related to the ability of corrosion currents to flow though the reinforced concrete beam which can be function of water cement (w/c) ratio, moisture and salt content. Some precautions should be used like the contact must be very good to use this method which can be accomplished by drilling of small holes.
Figure 2.20: Set up for resistivity measurement [13]
2.1.9 Infrared measurements
In Infra-red thermography the heat at any temperature is converted into a thermal image using Infra-red cameras. The buildings with defects (cavities, moisture presence, change of material etc) differ in amounts
of infra-red radiation. For example the building free with defects and concrete surface even colour will appear uniform when viewed from infra-red camera. If the concrete surface has cracks then they will heat up faster under solar radiation and hot spots will appear on thermal scan. These areas which appear as hot spots can be examined more closely for further investigation. This methods has gained much popularity in assessment of large buildings with high rise apartment blocks [14] . Figure 2.21 shows the detection of hidden tie rods using thermovision. The method can be active of passive depending upon if forced heating is applied to structure or not.
Figure 2.21: Detection of hidden tie rods using thermal vision [10]
2.1.10 Georadar
This is also a NDT method used for masonry and to locate presence of large voids, inclusion of different materials, presence of moisture levels and morphology of the wall section in multiple leaf masonry. Figure 2.22 and Figure 2.23 shown below shows the interpretation of radar gram test results on a target wall for one value of depth slice showing presence of a local void due to the energetic reflection.
Figure 2.22: Target wall [10]
Figure 2.23: Radargram profile showing several
2.1.11 Conductivity Measurements
As we know electrical conductivity depends on degree of water saturation and their electrical properties. Electromagnetic waves propagated inside structure can give information on materials investigated. The equipment can be non-contacting but some problems might be caused when reinforcing rods are inside. As ingress of water inside masonry is of great engineering importance it needs to be monitored. They can be used to give various measurements like moisture content, salt content and presence of metal reinforcements, pipes, etc in the wall.
Figure 2.24: Detection of hidden tie rods using thermal vision [10]
2.2
Minor-Destructive Testing (MDT)
2.2.1 Single and Double Flat jack tests
Strength of masonry is an important consideration in finding out the condition of the building. In case of heritage building removing parts of the masonry is unacceptable and requires some tests which do not alter building. Testing of masonry strength by flatjacks is a minor destructive testing (since some portions of mortar have to be removed for testing) plus instead of loading the whole wall only a small portion of wall is loaded by a small hydraulic jack instead of whole wall. The things that we can measure using flatjack are: (1). compressive strength of masonry if it is allowed to test until masonry fails. (2). Elastic modulus (in linear part) since the stress (σ ) vs strain relation (ε) is given. and (3). in plane shear strength.
To start the test first a layer of mortar is cut from the masonry wall and then a thin flat jack is inserted into the mortar layer which has been cut. Since there is some cut so it comes into minor destructive testing. Because of the cut there is stress relaxation since distance will be less than before. The flat jack will slowly try to increase the pressure so as to restore it into old settings. The extensometer can be used to measure displacement after cutting and then during the testing process.
(a) Rectangular flat jack (b) Drilling of the mortar joint
Figure 2.25: Procedure flat jack test [10]
The Figure 2.25 shows how a cut is made in brick masonry since its easy to make rectangular cut for this type (as opposed to irregular stone masonry where it is difficult to find joints). Then after this step a second cut is made from 40-50 cm from first one and 2nd jack is inserted in that cut. Then since the masonry sample is delimited by these two jacks so it can perform axial compression test on this part of sample sandwiched between two jacks. The LVDTs can give axial and transverse strains attached to this masonry sample. Various loading and unloading cycles have to be performed to give a better idea of elastic modulus and if test allows we can continue it to find ultimate strength of sample until it collapses.
The state of stress in a flat jack test is given by : [10]
Sf = KjKaPf (2.2)
where:
Sf = calculated stress value,
Kj = jack calibration constant (≤ 1),
Ka= jack/slot area constant (≤ 1),
Pf = flat-jack pressure.
Interpretation of Data of Flatjack tests can be in terms of Elastic modulus values. The double flat-jack test allows to measure the modulus of elasticity which can be used to classify different kinds of masonries. For example, Levels of masonry according to elasticity modulus are Masonry of rural buildings E < 900 N/mm2,
Masonry of Civil buildings 900 N/mm2<E < 1500 N/mm2, and Masonry of Monumental buildings E > 2000 N/mm2[10].
2.2.2 Dilatometer techniques
In this test shown in Figure 2.27 the perforation is made by the help of drill and then a cylindrical tube conforming with the dimensions of the specimen is introduced in it so it can expand inside the hole. After getting test data of the curve pressure given by the tube and increase of volume obtained can be used to estimate the module of deformation of the masonry. This is a quantitative test as it gives us directly the value of deformability modulus of masonry.
Figure 2.27: Phases of the dilatometer test [15]
2.2.3 Endoscopy
Endoscopy is simply an extension of the essential visual survey (Section 2.1.1) into areas inaccessible to the naked eye. The equipment ranges from relatively simple borescopes consisting of a light source, a small diameter rigid tube with built-in optics and an eye-piece to complex controllable systems with numerous specialised attachments. By drilling a hole (normally less than 12 mm) and inserting the tube, it
is possible to inspect voids under floors or behind panelling for example. Any hidden problems such as fungal growth can, in theory, be identified. The more sophisticated and expensive equipment is fully flexible and can be steered by wires built into the casing. Systems are available down to 6 mm diameter, and more specialised systems down to less than 2 mm. It is possible to attach still or closed-circuit television camera (CCTV) to the eye-piece to record the findings on a videotape (Video boroscopy). The theory is fairly simple, but in practice it can be very difficult to retain a sense of scale of the image observed, and keep track of the location and orientation of the tip. The focal range, depth of field and strength of light is greatly reduced in the smaller diameter systems.
Figure 2.28: Execution of endoscopic investigation (left) and it’s endoscopic picture (right) [16]
Endoscopic technique allows one to observe, inspect and document masonry panels in their section and generally hidden portions of structures. Endoscopy can be applied for a lot of different uses: documentation of structural elements (walls, floors, vaults) in order to investigate their materials, techniques and construction phases; analysis of degradation and instability (moisture, cracks); evaluation of effectiveness of intervention in progress. However, endoscopy requires execution of a small hole, it is therefore a micro-invasive test, but sometimes it provides detailed and reliable information difficulty to obtain using other techniques, especially if non-invasive.
2.3
Destructive tests
2.3.1 Compression tests
This tests are Destructive in nature and requires samples to be take out from core or casted and then tested with Universal Testing Machine (UTM). They are direct tests since they give directly the compressive strength of the material. These tests can also be used to find Young’s modulus of the material by placing LVDTs at approximately one third and two thirds of the specimen’s height. The Figure 2.29 shows a test performed on a concrete sample to measure its strength against compression. This test for concrete
specimen is most widely used test to measure its compressive strength with concrete specimen ranging from cubes & cylinders.
Figure 2.29: Compression testing on a concrete specimen [17]
2.4
Crack Monitoring
2.4.1 Glass Crack Meters
This is a very qualitative way to monitor cracks. It consists of pieces of glass installed (See Figure 2.30) where the crack propagates and if the glass cracks or shows any damage then it means that the crack has opened.
Figure 2.30: Glass pieces inserted into the wall to monitor cracks [2]
2.4.2 Crack Meters
The displacement transducers (LVDT) are available with different operating ranges and the square of the frequency signal is directly proportional to the amount of displacement. These units are used in crackmeters and rod extensometers. The crackmeters allows us to measure displacement of a crack in
different axes up-to accuracy of 0.1 to 1.00 mm. These crackmeters (Figure 2.31) are quick and easy to read, adaptable to data loggers or data acquisition system.
Figure 2.31: Different types of Crack Meters a) Manual Crack Meters b) Electronic Crack Meter (LVDT)
[18]
2.5
Computers in NDT
Visualisation of NDT data can be very tedious job and time consuming. But with advent of softwares for data analysis the task is becoming more simpler and less prone to misinterpretation. Many visualisation tools available for different NDT tests: for example Surfer for sonic tests, FerroScan software for Ferroscan data to mention a few. Graphic possibilities of computers enable us to get us a overall view in different NDT tests. There has been a continuos development in visualisation of NDT techniques and display of information with enhance data analysis tools. Quality images are produced to ease the communication of data and interpretation with other scientists working in this area. The use of colours have been a very efficient development for data visualisation and readability of an image. The coloured images (Example see Figure 2.4) can be seen much easier in identifying stress points, locating extremes and defective regions of material.
2.6
Discussion of NDT methods used for St Torcato case study
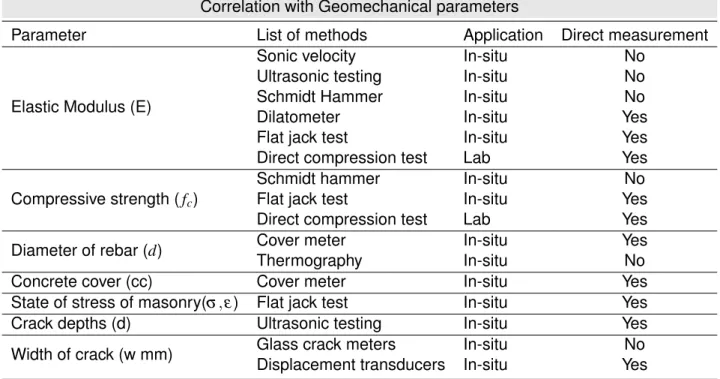
Certainly the advent of computers (See Section 2.5) and data loggers have decreased the time of performing NDT survey but the results must be interpreted with great care. Also there is a urgent need in scientific community to develop some standards for NDT surveys for interpretation of results in relation to structures. One of the challenges can be to combine the results of different NDT techniques with different reliability techniques and fuse them together to obtain value for engineers and scientists for decision making. So, to summarise a wide range of NDT methods can be used depending on what kind of information is required, on which scale, economy, ease of use etc.However in the case study data from St. Torcato was used to calculate the parameter of interest (Elastic modulus and compressive strength of granite blocks). There are different possibilities of using NDT/MDT tests according to parameter desired. The list is summarized in table 2.1. In this table many tests correlate with the geomechanical properties of the material and each test can vary in their complexity to reliability of data one gets from these tests.
Table 2.1: Different possibilities to use NDT or MDT according to parameter of interest
Correlation with Geomechanical parameters
Parameter List of methods Application Direct measurement
Elastic Modulus (E)
Sonic velocity In-situ No
Ultrasonic testing In-situ No
Schmidt Hammer In-situ No
Dilatometer In-situ Yes
Flat jack test In-situ Yes
Direct compression test Lab Yes
Compressive strength ( fc)
Schmidt hammer In-situ No
Flat jack test In-situ Yes
Direct compression test Lab Yes
Diameter of rebar (d) Cover meter In-situ Yes
Thermography In-situ No
Concrete cover (cc) Cover meter In-situ Yes
State of stress of masonry(σ , ε) Flat jack test In-situ Yes
Crack depths (d) Ultrasonic testing In-situ Yes
Width of crack (w mm) Glass crack meters In-situ No
Displacement transducers In-situ Yes
In most of cases the data with low reliability will show a large standard deviation than with data which has more reliability. Series of data coming at different times from St. Torcato church was used in to get a reliable estimate of the parameter. For this thesis we have only used literature knowledge, schmidt hammer with direct compression test to evaluate the compressive strength ( fc) of the granite block. And for second
parameter literature knowledge, sonic, ultrasonic tests and direct compression tests were used to calculate the value of elastic modulus (E) for the granite block. Summarised Table 2.2 discusses the advantages and disadvantages of NDT methods and how we can use these methods to calculate the desired parameter.
2.7
Conclusions
The ND tests and the laboratory tests should be used in sequence to characterize the masonry typology and mechanical behaviour of masonry material. In some cases in monuments when its not possible to remove material so the parameters have to be deduced by carrying only NDT tests and the data coming from these tests needs to be combined in a logical way to arise to a conclusion. In some cases when no direct relation is available to characterize masonry then some range can be used on previous studies carried out on other masonry samples. Also some minimum number of tests should be carried out to get data with some reliability keeping in mind the budget allocated to the testing scheme. Still a great deal of research is necessary for the interpretation of the NDT results and for their correlation to masonry characteristics.
Table 2.2: Summary of NDT Methods adapted from [19]
Inspection method
Parameter measured Advantage Disadvantage Cost
Visual Surface condition Quick; modest skills
required
Superficial Low
Sonics Wave velocity;
tomographic cross-sections Moderately slow; gives useful information on major elements Requires skill to interpret data Moderate High
Cover meter Concrete cover and
diameter of rebars
Relatively quick Error when concrete is
penetrated with saline water
Moderate High Schmidt
hammer
Rebound number Simple to use,
equipment inexpensive and readily available No direct relationship to strength or deformation properties Low
Coin tap test Change in frequency Procedure to perform
test very simple
Superficial Low
Ultrasonics Wave velocity, location of defect High penetrating power,Greater accuracy, portable equipment technical knowledge
is required for the
development of inspection procedures, Couplants needed Moderate High Acoustic emission Energy released in form of stress waves
High sensitivity,
localisation of failure zone by time of arrival measurement
Only estimate
qualitatively how
much damage is in the material
High
Resistivity Changes in resistivity Shallow investigations are rapid
Deep investigations
require long cables
and much time, data interpretation difficult Moderate Infrared measurement Amounts of infrared radiation
Visual image easy
to interpret, located hidden tie bars
Qualitative image,
not much information
gained about other
things
High
Radar Electromagnetic wave
velocity
Quick; can give good penetration; can give good image of internal structure
Poor penetration
through clay infill and
salt contaminated
fill; requires skill to understand data
Moderately high
Conductivity Relative conductivity Quick; gives relative
conductivities over a large area to a maximum depth of 1.5 m Limited depth penetration of 1.5 m; complements radar Low Dilatometer Modulus of deformation of Quantitative test,
gives direct estimate
Requires skill to
interpret data
3
DATA COLLECTION, DATA FUSION AND INTRODUCTION OF
BAYESIAN STATISTICS
The objective of this chapter is to explain how Bayesian approach can be applied to combine data from different ND tests. St Torcato church was used as a case study to see how the bayesian model can be adapted to different data sets. Mainly in this study two granite stone blocks were studied and different tests were performed on it to get an estimate of geomechanical parameters of granite used in the church. Many minor details like the places where data was collected is not mentioned since this thesis emphasises more on data values then on locations where data was fetched.
3.1
Data Collection for S. Torcato church
Data collection was done by reading and going through several testing reports of San Torcato church [20], and also though several excel data sheets. Two types of data were collected in this case : one was experimental data (Direct and Indirect) obtained from testing and another type was monitoring data obtained from continuous monitoring of San Torcato church. But only the experimental data was used in this thesis and the monitoring data count not be used. In data collection, two blocks were taken from the site to the lab and tested. We had the information that the blocks came from the same quarry, but they uses two quarries to build the church. So, there is an uncertainty related with this aspect.
3.1.1 Schmidt Hammer Tests
The data from blocks was obtained to make sure that the granite has come from same quarry. However schmidt hammer provides surface hardness it is poorly be related to Elastic modulus of the stone block. It can be related to compressive strength of granite but the value obtained were so close and needs some empirical relationship as suggested by Ang [21] to be used as a prior for combining it with initial level of Knowledge. The relationships developed to relate compressive strength of granite with schmidt hardness value in paper of Graca Vasconcelos fc= 12.24N − 739.94 [22] were not suited for this data because of lower
range as can be seen by comparison of Figure 3.1 and Table 3.1. Further information about conducting this test can be found in Chapter 2, Section 2.1.4. The average value of the rebound number for in-situ tests is 63.0 with a standard deviation of 2.8 and a coefficient of variation of 4.4. The value obtained by this correlation was around 31.2 MPa and was discarded as its too low for granite compressive strength.
Figure 3.1: Figure showing correlation of Schimdt
Hammer rebound number and compressive strength of granite [22]
Stone No Rebound No.
Stone no 1. 62.6
Stone no 2. 62.5
Stone no 3. 63.3
Stone no 4. 63.7
Table 3.1: Table showing Schmidt hammer test
results for San Torcato Church [20]
3.1.2 Granite Sonic Tests
The sonic tests were done on 5 points on northwest wall of west tower and the same comparison was made with the granite blocks. Some values shown in table 3.5 are a bit low which shows discontinuity in rubble masonry with voids. The same sample taken from the quarry was used to perform three types of tests: direct, semi-direct and indirect. The velocity can be used as a indicative to get an idea about the voids present inside the wall. The table 3.2 gives an idea about what test was performed on granite blocks and what was done on masonry wall. For carrying out the data fusion process, results of direct sonic tests of granite stone blocks from Table 3.3 and 3.4 were taken into account since they show less coefficient of variation than the other indirect and semi-direct tests. The velocities obtained from Table 3.8 and 3.9 were lower since there were difficulties in distinguishing P-wave from R-wave. The table 3.2 shows which tests were available for sonic tests for blocks and in-situ for comparison in both cases. However only direct test data was used in the model. Other data from the table can also be used with some additional uncertainty.
Table 3.2: Granite sonic test results (Block and in-situ) [20]
Results from sonic testing
Serial number Test Type Lab In-situ
1 Direct sonic 3 3
2 Semi-direct sonic 3 7
Table 3.3: Granite Stone Block 1 Direct sonic
test results [20]
Results from sonic testing Stone Block 1
Surfaces velocity [m/s] COV
A-C 4751 15.3
D-E 5332 16.7
ALL 4945 15.8
Table 3.4: Granite Stone Block 2 Direct sonic
test results [20]
Results from sonic testing Stone Block 2
Surfaces velocity [m/s] COV
A-C 4542 16.1
D-E 4508 18.6
ALL 4530 17.0
Table 3.5: Torcato church granite Direct sonic test results In-situ [20]
Results from sonic testing S.Torcato In-situ Direct
S.No Location Avg. Velocity [m/s] COV
1 P1 2073 1.84 2 P2 4220 4.54 3 P3 3244 2.39 4 P4 3821 3.38 5 P5 3322 2.39 Mean 3336 2.91
Table 3.6: Granite Stone Block 1 Semi-Direct
sonic test results [20]
Results from sonic testing Stone Block 1
Surfaces Distance b/w points (m) velocity [m/s] COV B2-C2 0.14 3737 57.7 B2-C4 0.22 4523 37.8 B4-C2 0.22 6016 33.9 B4-C4 0.28 4589 21.8 ALL 4716 20.1
Table 3.7: Granite Stone Block 2 Semi-Direct
sonic test results [20]
Results from sonic testing Stone Block 2
Surfaces Distance b/w points (m) velocity [m/s] COV B5-B1 0.14 5875 28.3 B5-B2 0.22 4779 16.9 B5-B3 0.22 3872 39.5 B4-B3 0.283 4854 38.1 ALL 4845 30.7
Table 3.8: Granite Stone Block 1 Indirect sonic
test results [20]
Results from sonic testing Stone Block 1
Surfaces Distance b/w points (m) velocity [m/s] COV B6-B1 0.25 2714 29.5 B6-B2 0.20 4133 42.8 B5-B2 0.15 4279 48.7 B5-B3 0.10 3083 46.2 ALL 3552 21.7
Table 3.9: Granite Stone Block 2 Indirect sonic
test results [20]
Results from sonic testing Stone Block 2
Surfaces Distance b/w points (m) velocity [m/s] COV B5-B1 0.20 3116 26.9 B5-B2 0.15 2066 15.2 B5-B3 0.10 3167 50.8 B4-B3 0.05 4500 24.8 ALL 3212 31.1
3.1.3 Granite Ultrasonic tests
The same kind of tests which were performed on sonic were repeated for ultrasonic range details of which are explained in Report no 6 [20]. Also these tests were not good since the analysis of signal was done internally making it impossible to know which wave form was used in determining the results. The table 3.10 shows which tests were available ultrasonic for blocks and in-situ for comparison in both cases.
Table 3.10: Granite Ultrasonic test results (Block and in-situ) [20]
Results from Ultrasonic tests
Serial number Test Type Lab In-situ
1 Direct Ultrasonic 3 7
2 Semi-direct Ultrasonic 3 3
3 Indirect Ultrasonic 3 7
Table 3.11: Granite Stone Block 1 Direct Ultrasonic test results [20]
Results from Ultrasonic testing Stone Block 1
Surfaces velocity [m/s]
A-C 3836
D-E 3885
ALL 3852
Table 3.12: Granite Stone Block 2 Direct Ultrasonic test results [20]
Results from Ultrasonic testing Stone Block 2
Surfaces velocity [m/s]
A-C 3694
D-E 3849
ALL 3750
Table 3.13: Granite Stone Blocks Semi-Direct
Ultrasonic test results [20]
Semi-Direct Ultrasonic testing Stone Blocks
Surfaces velocity [m/s] COV
B2-C2 3720 4.3
B2-C4 3589 4.0
B4-C2 3862 0.7
B4-C4 3742 2.2
ALL 3728 3.6
Table 3.14: Granite Stone S. Torcato Semi-Direct Ultrasonic test [20]
Ultrasonic testing Insitu San Torcato
Surfaces velocity [m/s] COV
A2-B2 4729 5.6
A2-B4 4422 10.1
A4-B2 4671 9.8
A4-B4 4438 11.7
ALL 4565 8.7
The other test data with high coefficient of variation (COV) was discarded due to more variability and less reliability. The same argument can be used as the tests can also be incorporated with additional uncertainty making the model more complex.
Table 3.15: Granite Stone Block 1 InDirect
Ultrasonic test results [20]
Results from Ultrasonic testing Stone Block 2
Surfaces Distance b/w points (m) velocity [m/s] C1-C2 0.05 4630 C1-C3 0.10 3922 C1-C4 0.15 2650 C1-C5 0.20 2747 C1-C6 0.25 2283 C1-C7 0.30 2627 C1-C8 0.35 2513 ALL 3053
Table 3.16: Granite Stone Block 2 InDirect
Ultrasonic test results [20]
Results from Ultrasonic testing Stone Block 1
Surfaces Distance b/w points (m) velocity [m/s] C1-C2 0.05 4630 C1-C3 0.10 3257 C1-C4 0.15 3119 C1-C5 0.20 3106 C1-C6 0.25 3153 C1-C7 0.30 2290 ALL 3259
3.1.4 Granite cylinder compression tests
Since in Section 3.1.1 it was presented that granite blocks from same quarry have similar hardness values. It is reasonable to assume that the compression tests and young’s modulus values on cylinders should be almost similar [20]. The six cores were drilled from Stone block 2 with a diameter of 75 mm and a height equal to 155 mm. Also 3 LVDT’s were placed at approximately one third of specimen height to measure the Elastic Modulus. This test is a direct test to measure the compressive strength and elastic modulus.
Figure 3.2: Figure showing different stages of Compression test on a granite cylinder a)Stone 2 b)Drilling
Table 3.17: Granite compression test results [20]
Results from core testing
Core number Compressive
strength Young’s Modulus 2nd Cycle (GPa) Young’s Modulus 3rd Cycle (GPa) 1 79.6 – – 2 87.2 31.4 32.5 3 85.2 29.8 33.3 4 66.9 32.1 33.2 5 77.8 32.8 33.3 6 73.8 31.4 33.3 Average 78.4 31.5 33.1 Std Deviation 7.5 1.1 0.3 COV% 9.5 3.5 1.1
3.2
Data Fusion
3.2.1 Definition and General overview
Data fusion (data integration) sometimes known as information fusion is the process to combine different sources and different points in time into a representation that provides effective support for human or automated decision making. Moving from Biology to technology the most simple example of data fusion system can be given by the human brain (Figure 3.3). It integrates information from different senses (sensors) for e.g. eyes, ear, nose etc to arrive to a conclusion. For example while watching television sound of a voice combined with visual information helps in identifying a person. For sensor level data fusion any type of sensor data can be fused with the condition they should represent the same measurement and if not then it has to be processed to obtain an identical format. Most of the data fusion is done to integrate information from multiple sensors. Chair and Varshney [23] produced an optimised data fusion algorithm to weight each signal coming from sensors according to their reliability. Same kind of technique is applied in this report in which different NDT tests are weighed according to survey from experts and then fused using Bayesian methodology.
The information coming from different sources can be conflicting, incomplete or vague and needs to be combined from different sources to help practitioners in decision making. Data fusion is defined as synergistic use of information coming from different sources to understand the phenomenon [24]. The Flowchart shown in Figure 3.4 shows the concept of data fusion when the information is combined using Bayesian techniques to reach to a higher confidence level. The whole methodology behind Data Fusion process is to combine information from Literature and multiple NDT tests of different reliability levels to get a more accurate picture and assessment of parameters of interest than possible with a single NDT method. A Bayesian approach is used to combine data from different indirect and direct tests for San Torcato in this case study. The role of data fusion is its use to manage uncertainty and improve accuracy and provide a rational and mathematically valid approach to fuse the data from different test to help in the decision making process of selecting proper parameters. There is some difference between data fusion and data integration which is used to describe the combining of data, whereas data fusion is integration followed by reduction or replacement. Data integration might be viewed as set combination wherein the larger set is retained, whereas fusion is a set reduction technique with improved confidence.
Data Source 1
Data Source 2
Data Source 3
Bayesian FUSED DATA
Data Sources
R R
R
Figure 3.4: Illustration of Data Fusion system combining diverse data sets into a unified (fused) data set
The different NDT techniques used for monuments were described in Chapter 2 with their advantages and disadvantages. In addition the efficiency of different models to incorporate data is also presented in this thesis. In brief different NDT techniques were studied with different probability approaches to NDT data fusion and their efficiency in combining information was assessed using different statistical models. The main role of Data fusion through several publications is its ability to manage uncertainties and improve the accuracy of the system. In this study for fusion center we can get, for e.g.. information from sonic tests that can be supplemented from core testing data to obtain the missing information.
Data fusion in the field of NDT is still a new concept and it still needs to be understood and practised by engineers. Some research papers using NDT data fusion using Bayesian techniques related to geomechanical parameters include:
1. Assessment of bridges using Bayesian updating in which yield strength of reinforcement bars and concrete cover was updated using NDT tests [25].
2. Bayesian assessment of the characteristic concrete compressive strength using combined vague informative piers for updating strength distribution of concrete [26].
![Figure 2.13: Scmidt Hammer [6]](https://thumb-eu.123doks.com/thumbv2/123dok_br/17758019.835243/31.892.234.686.640.941/figure-scmidt-hammer.webp)
![Figure 2.20: Set up for resistivity measurement [13]](https://thumb-eu.123doks.com/thumbv2/123dok_br/17758019.835243/34.892.266.654.692.977/figure-set-up-for-resistivity-measurement.webp)
![Figure 2.24: Detection of hidden tie rods using thermal vision [10]](https://thumb-eu.123doks.com/thumbv2/123dok_br/17758019.835243/36.892.276.646.324.619/figure-detection-hidden-tie-rods-using-thermal-vision.webp)
![Figure 2.26: a) Double flat jack test on regular stone masonry b) Stress strain curve [10]](https://thumb-eu.123doks.com/thumbv2/123dok_br/17758019.835243/37.892.139.751.764.1044/figure-double-regular-stone-masonry-stress-strain-curve.webp)
![Figure 2.28: Execution of endoscopic investigation (left) and it’s endoscopic picture (right) [16]](https://thumb-eu.123doks.com/thumbv2/123dok_br/17758019.835243/39.892.86.861.364.652/figure-execution-endoscopic-investigation-left-endoscopic-picture-right.webp)
![Figure 2.30: Glass pieces inserted into the wall to monitor cracks [2]](https://thumb-eu.123doks.com/thumbv2/123dok_br/17758019.835243/40.892.319.604.739.956/figure-glass-pieces-inserted-wall-monitor-cracks.webp)
![Figure 2.31: Different types of Crack Meters a) Manual Crack Meters b) Electronic Crack Meter (LVDT) [18]](https://thumb-eu.123doks.com/thumbv2/123dok_br/17758019.835243/41.892.148.772.194.403/figure-different-crack-meters-manual-crack-meters-electronic.webp)
![Figure 3.1: Figure showing correlation of Schimdt Hammer rebound number and compressive strength of granite [22]](https://thumb-eu.123doks.com/thumbv2/123dok_br/17758019.835243/46.892.109.441.119.443/figure-figure-showing-correlation-schimdt-hammer-compressive-strength.webp)