Dynamics of water and carbohydrate content
in branches of peach tree during the winter in
South Region of Brazil
Leticia Neutzling Rickes
1, Fabiano Simões
2, Robson Ryu Yamamoto
3Luciano do Amarante
1, Flavio Gilberto Herter
11 Universidade Federal de Pelotas, Avenida Eliseu Maciel, Campus Universitário, s/nº, Capão do Leão, RS.
CEP 96010-900. E-mail: leticiarickes@hotmail.com, lucianodoamarante@yahoo.com.br, flavioherter@gmail.com
2 Universidade Estadual do Rio Grande do Sul, Avenida Antônio Ribeiro Branco, 1060, Parque dos Rodeios, Vacaria, RS.
CEP 95200-000. E-mail: fabiano-simoes@uergs.edu.br
3 Universidade Federal de São Carlos, Rodovia Lauri Simões de Barros, SP-189, km 12 – Aracaçú, Buri, SP.
CEP 18290-000. E-mail: yamamoto@ufscar.br
ISSN 2448-0479
Abstract - The objective of this work was to determine the water and carbohydrate content in peach tree branches during the winter in South region, Brazil. Fortnightly collections of branches of peach trees ‘Jubileu’ and ‘Eldorado’ were done every 15 days between the months June and August of 2010. These branches were divided into three portions: basal, median, and apical, for determination of the water content, these were divided into two tissues: bark and wood. For carbohydrate content, in the portions of the branches, the contents of total soluble sugars, sucrose and starch were analyzed by the anthrone method. The water content in the bark tissue showed no alterations in the two cultivars over the period investigated. It was found that the dynamics of the water (tissue wood) and carbohydrate presented a great increase mainly in the apical portion of the branch close to sprouting. It follows that the water content and carbohydrate dynamics may be considered physiological markers for resumption of growth for temperate climate fruit trees.
Keywords - Branch. Bark. Wood. Temperate climate fruit trees. Total soluble sugars.
Resumo - O objetivo deste trabalho foi determinar o conteúdo de água e de carboidratos em ramos de pes-segueiro durante o inverno, na região Sul do Brasil. Foram realizadas coletas quinzenais de ramos do ano de pessegueiros ‘Jubileu’ e ‘Eldorado’, entre os meses
de junho e agosto/2010. Os ramos foram divididos em três secções: basal, mediana e apical, sendo que para determinação do conteúdo de água, estes foram divididos em dois tecidos: casca e lenho. Para o teor de carboidratos, foram analisados nas secções dos ra-mos o conteúdo de açúcares solúveis totais, sacarose e amido pelo método antrona. O conteúdo de água no tecido da casca não mostrou alterações nas duas cultivares ao longo do período analisado. Verificou-se que a dinâmica do conteúdo de água (tecido lenho) e de carboidratos apresentou um grande aumento principalmente na secção apical do ramo próximo à brotação. Concluem-se que a dinâmica do conteúdo de água e carboidratos podem ser considerados mar-cadores fisiológicos para a retomada do crescimento para frutíferas de clima temperado.
Palavras-chave - Ramo. Casca. Lenho. Frutíferas de clima temperado. Açúcares solúveis totais.
Recebido em: 02 de dezembro de 2015
Aprovado em: 15 de março de 2016
1 INTRODUCTION
The field-cultivated plants will always be targets of different environmental conditions, affecting both their growth and metabolism and bringing about reductions in the crop yield (WANG et al., 2007). The south region of Brazil enables the growing of
temperate climate fruit species, but the climate is characterized for being subtropical and presenting great irregularities of environmental factors, within a same season and over the diff erent years.
One of the characteristics of the temperate climate fruit species is the need of accumulating cold for the overcoming of dormancy. During that period, the accumulation of cold is associated with the changes in carbon hydrate content among other substances (WANG et al., 2007). In addition to carbohydrates, the water dynamics is of great importance to the tissues of temperate climate fruit plants, mainly during the dormancy period and sprouting induction, acting upon the biochemical processes, like the mobilization of the reserves and of activation of enzymatic processes (CITADIN et al., 2009; MARAFON et al., 2011a, SIMÕES et al., 2014) since, the translocated solutes, chiefly, carbohydrates are dissolved in water. Water displacement has been the focus of several studies in temperate climate fruit plants (CITADIN et al., 2009; YAMAMOTO et al., 2010; MARAFON et al., 2011a; SIMÕES et al., 2014).
Th e objective of this study was to determine the water and carbohydrate content in peach tree branches during the resting phase under the mild winter conditions region in the state of Rio Grande do Sul.
2 MATERIAL AND METHODS 2.1 Plant Material
Th e experiment was conducted during the 2010 winter in the Palma Agricultural Center (Centro Agropecuário da Palma) orchard of Faculdade de Agronomia Eliseu Maciel, UFPel, in the municipality of Capão do Leão, with geographic coordinates of latitude 31°52’00” S, longitude 52°21’24” O and altitude of 13 m. Th e climate is of the Cfa subtype according to the Koeppen classifi cation. Two cultivars of peach tree (Prunus persica L.), namely Jubileu, with requirement of 300 hours of cold (HF) ≤ 7,2°C and Eldorado, with requirements of 350 HF ≤ 7,2°C
were utilized. Th e collections were carried out in
the months of June (day 18), July (days 1, 16 and 30) and August (day 13). Six plants of each cultivar were sorted, from which four branches one year old, about 30 cm, arranged at the median height in all the quadrants of the plant, were collected. Th e collections were done always around 10h in the morning.
2.2 Meteorological data
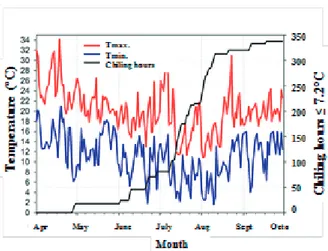
Th e meteorological data were obtained by Estação Agroclimatológica de Pelotas, Terras Baixas Weather Station, situated at about 13 km away from the experiment site. Th e daily maximum and minimum temperatures as well as the HF ≤ 7.2°C accumulated are represented in Figure 1.
Figure 1 – Daily maximum (__), minimum (__) temperatures and chiling hours ≤7.2°C (__) accumulated, obtained in the
Pelotas Weather Station (Capão do Leão) - Terras Baixas Weather Station during the months of April to September of
2010. UFPel, Pelotas, RS- Brazil. 2010. 2.3 Determination of water content
Th e freshly collected branches were packed into closed plastic packages to avoid the dehydration and taken to the Plant Physiology Laboratory (Laboratório de Fisiologia Vegetal) of UFPel for determination of water content (WC). Each branch was segmented into three portions: basal, median and apical, separating the bark and wood. From each position a 1 cm branch sample was taken off .
Immediately after the separation of each tissue of each sample, the fresh biomass (FB) was determined by using an analytical balance of 0.1 mg (model AAA-250/L). Soon after the preparation, the samples were stored into paper packages and placed into oven under forced ventilation at 65°C until constant weight.
Th e determination was conducted according to the formula: WC = (FB-DB)/DB, being WC = water content, FB = fresh biomass and DB = dry biomass,
expressed in g g-1 DM.
2.4 Carbohydrate extraction
For extraction of carbohydrates, 300 mg of BMS of each sample (bark+wood) together, were utilized, which were ground in cutting mill
(model CE-430/Mini) till a sample of extremely fine particle size was obtained. The extraction of total soluble sugars and sucrose were carried out using 80% of ethanol repeated for three times. The precipitate retained in that extract was dried in oven at 65°C for 48h for determination of starch. The precipitate was re-suspended in 5 mL of perchloric
acid (HCIO4) at 30% and put into water bath at
80°C for 10 min and centrifuged at 6000 rpm for 10 min. This procedure was repeated once more (DISCHE, 1962).
2.5 Determination of total soluble sugars
Aliquots of 200 µL of the extracts were transferred to test tubes followed of the addition of 3 mL of
solution of 0.15% anthrone in concentrated H2SO4
(DISCHE, 1962) in ice bath followed of agitation in vortex. Afterwards, the tubes were taken to water bath for 10 min at 100ºC. The absorbance readings were conducted in spectrophotometer (Biospectro, model SP-22) at 620 nm and the results were expressed in
mg g-1 MS.
2.6 Sucrose determination
In the quantification of sucrose were utilized aliquots of 200 µL of the extract, transferred to each tube, followed of the addition of 200 µL of 15% potassium extract. Next, the tubes were led to water bath at 100ºC for 10 min. Afterwards, 3 mL of the
reagent anthrone (0.15% p/v in 70% H2SO4) were
added slowly to each tube and again taken to water bath at 40ºC for 15 min. The absorbance readings were recorded in spectrophotometer (Biospectro, model SP-22) at 620 nm and the results were
expressed in mg g-1 MS.
2.7 Starch determination
The starch quantification was carried out by the anthrone method. Aliquots of 200 µL of the extracts were added to 3 mL of anthrone solution,
0.15% H2SO4 maintaining the test tubes in ice
bath. After that stage, the tubes were boiled for 10 minutes at 100°C and then cooled in ice bath. The absorbance readings were recorded in spectrophotometer (Biospectro, model SP-22) at 620 nm and the results were multiplied by the factor of correction 0.9 for conversion into starch contents according to McCready et al. (1950) and
expressed in mg g-1 MS.
2.8 Experimental design and statistical analysis
The experimental design utilized was completely randomized containing six replications. The factorial arrangement to analyze the variable WC was (2x5), obtained from the combination of the factors tissue (2 part of branches: wood and bark) and collection data (5 collection dates), and variables related to carbohydrates was (3x5) obtained from the combination of the factors (3 parts of branches: basal, median and apical) and collection data (5 collection data) for each cultivar.
The means were submitted to the analysis of variance (p<0.05) and the significant variables were compared by the Tukey test at 5% of probability.
3 RESULTS AND DISCUSSION
In the year of 2010, according to data made available by Estação Agroclimatológica de Pelotas, the amount of hours of cold ≤ 7.2ºC accumulated in the region was approximately 350 HF during the months of April to September. The month of July presented temperatures close to 30ºC, the monthly mean of maximum temperature was of 18.4ºC followed by the minimum of 8.2ºC (Figure 1).
These variations in temperature affect very important physiological processes of the plant, for example, changes in cellular structure, enzymatic changes (MARAFON et al., 2011a), carbohydrates flow (YAMAMOTO et al., 2010; MARAFON et al., 2011a; SIMOES, 2011), water content (MARAFON et al., 2011b; YAMAMOTO et al., 2010; SIMOES, 2011), among others.
The cultivars Jubileu and Eldorado presented similar behavior relative to the WC in the bark, considering the different portions on the branch along the winter period (Figure 2A e 2C), having been similar to the one observed by Citadin et al. (2009) on walnut tree (Juglans regia), where rehydration was less visible at the basal and median section of the branch, both for the bark and for the wood. The meteorological data may have influenced in the decrease of the WC verified at the third collection (16/July) and fourth collection (30/July) at the apical position of the wood in both cultivars (Figures 2B and 2D).
In the wood, the differences were more expressive, stressing a great increase of the WC at the apical portion in both cultivars studied at the fifth collection (13/August), this period being close to sprouting.
An opposite situation was found by Simões et al. (2014) in a study with pear trees ‘Housui’ in two different regions of Brazil, São Joaquim/SC and Vacaria/RS, where the WC in the wood tissue presented no differences over the period evaluated (May to September).
Figure 2 - Water content (g g-1 DM) in peach tree cultivars Jubileu (A and B) and Eldorado (C and D), in the bark (A and C) and wood (B and D) during dormancy.UFPel, Pelotas, Brazil, 2010. Means compared by Tukey test at 5% probability,
± SE (n=6).
In both cultivars, greater WC at the apical portion of the wood was found in the second collection (02/July), followed of the fifth collection (13/August), the same behavior can be found for the dynamics of total soluble sugars, sucrose and starch for cultivar Eldorado (Figures 3, 4 and 5 respectively). That dynamics from the latest collection on represents the increase of the xylem sap, to which water migration is ascribed, together with soluble sugars in the phase of induction to sprouting, which confirms the hypothesis of this study that both the WC and the carbohydrate contents are physiological indicators of the growth resumption. This growth of the WC and of carbohydrates found from the fourth collection (30/July) at the apical portion of the branches in the cultivars of the present study, are ascribed to the hydration status of them and has a strong relation with increased metabolic activity and processes of dormancy overcoming, consequently with the sprouting capacity (MARAFON et al., 2011a)
In general, the soluble total sugar content at the apical portion was higher than the other portions in both cultivars, with the exception of the first (18/June) and third collections (16/July) for cultivar Jubileu (Figure 3A), where the three portions investigated presented quite similar soluble total sugar contents. The behavior dynamics was observed for sucrose (Figure 4A) and starch (Figure 5A).
Figure 3 - Total soluble sugar content (mg g-1 DM) in peach trees cultivar Jubileu (A) and Eldorado (B) at the basal, median and apical portions during dormancy. UFPel, Pelotas, Brazil, 2010. Means compared by Tukey test at 5% probability, ± SE (n=6).
Figure 4 - Sucrose content (mg g-1 DM) in peach trees cultivar Jubileu (A) and Eldorado (B) at the basal, median and apical portions during dormancy. UFPel, Pelotas, Brazil, 2010. Means
compared by Tukey test at 5% probability, ± SE (n=6).
Figure 5 - Starch content (mg g-1 DM) in peach trees cultivars Jubileu (A) and Eldorado (B) at the basal, median and apical portions during dormancy. UFPel, Pelotas, Brazil, 2010. Means
compared by Tukey test at 5% probability, ± SE (n=6).
During winter, starch is the most abundant reserve carbohydrate in woody plants of temperate climate and it is broken down by amylases and converted into smaller molecules such as sucrose for cold protection (YOSHIOKA et al., 1988). The sucrose produced in the reserve tissues is transported by the phloem pathway and hydrolyzed into glucose and fructose for the furnishing of energy and carbon precursors (YOSHIOKA et al., 1988). However, a clear response of this conversion of reserve substances in that work was not found, since a constant dynamics in the three portions till the third collection (16/ July) for cultivar Jubileu was verified (Figure 5A), which can also be reinforced as obtained in relation to the total soluble sugar content. That behavior can be associated with the high temperatures during dormancy, which would upset cold accumulation, disturbing the mobilization of these carbohydrates (HONJO et al., 2002).
ÉPOCA basal median apical ÉPOCA basal mediana apical
18/jun 7,647 7,671 8,001 18/jun 8,467 9,58 10,11
01/jul 9,257 9,458 11,006 01/jul 8,764 10,091 14,021
16/jul 9,586 9,361 9,365 16/jul 8,715 9,801 12,472
30/jul 8,329 9,31 13,588 30/jul 9,051 9,258 12,156
13/ago 10,636 15,32 24,671 13/ago 9,756 15,19 20,379
Figure 3 - Total soluble sugar content (mg g-1 DM) in peach trees cultivar Jubileu (A) and Eldorado (B) at the basal, median and apical portions during dormancy. UFPel, Pelotas, Brazil, 2010. Means compared by Tukey test at 5% probability, ± SE (n=6)
EPOCA basal mediana apical EPOCA basal mediana apical
18/jun 2,94 3,09 3,124 18/jun 3,194 3,598 4,038
01/jul 3,193 3,204 3,905 01/jul 3,514 3,962 5,31
16/jul 2,677 2,748 3,123 16/jul 3,273 3,669 4,731
30/jul 3,004 3,251 4,927 30/jul 3,233 3,288 4,196
13/ago 2,708 4,047 6,038 13/ago 2,55 4,348 5,176
Figure 4 - Sucrose content (mg g-1 DM) in peach trees cultivar Jubileu (A) and Eldorado (B) at the basal, median and apical portions during dormancy. UFPel, Pelotas, Brazil, 2010. Means compared by Tukey test at 5% probability, ± SE (n=6).
Época basal mediana apical Época basal mediana apical
18/jun 2,725 2,598 2,636 18/jun 2,238 2,187 2,167
01/jul 1,878 1,802 2,234 01/jul 2,214 2,77 3,98
16/jul 2,325 2,341 2,429 16/jul 2,365 2,438 3,376
30/jul 1,813 2,072 3,601 30/jul 2,019 2,157 3,177
13/ago 3,182 5,128 8,215 13/ago 2,199 4,163 5,866
Figure 5 - Starch content (mg g-1 DM) in peach trees cultivars Jubileu (A) and Eldorado (B) at the basal, median and apical portions during dormancy. UFPel, Pelotas, Brazil, 2010. Means compared by Tukey test at 5% probability, ± SE (n=6).
0 2 4 6 8 10 18/6 2/7 16/7 30/7 13/8 Star ch co nten t ( m g. g -1D M)
basal median apical
A 0 2 4 6 8 10 18/6 2/7 16/7 30/7 13/8
basal median apical
B 0 2 4 6 8 18/6 2/7 16/7 30/7 13/8 Su cr os e co nten t ( m g. g -1 D M)
basal median apical
A 0 2 4 6 8 18/6 2/7 16/7 30/7 13/8
basal median apical
B 0 5 10 15 20 25 18/6 2/7 16/7 30/7 13/8 To tal so lu ble s ug ar s co nten t (m g.g -1D M)
basal median apical
0 5 10 15 20 25 18/6 2/7 16/7 30/7 13/8
basal median apical
A B
ÉPOCA basal median apical ÉPOCA basal mediana apical
18/jun 7,647 7,671 8,001 18/jun 8,467 9,58 10,11
01/jul 9,257 9,458 11,006 01/jul 8,764 10,091 14,021
16/jul 9,586 9,361 9,365 16/jul 8,715 9,801 12,472
30/jul 8,329 9,31 13,588 30/jul 9,051 9,258 12,156
13/ago 10,636 15,32 24,671 13/ago 9,756 15,19 20,379
Figure 3 - Total soluble sugar content (mg g-1 DM) in peach trees cultivar Jubileu (A) and Eldorado (B) at the basal, median and apical portions during dormancy. UFPel, Pelotas, Brazil, 2010. Means compared by Tukey test at 5% probability, ± SE (n=6)
EPOCA basal mediana apical EPOCA basal mediana apical
18/jun 2,94 3,09 3,124 18/jun 3,194 3,598 4,038
01/jul 3,193 3,204 3,905 01/jul 3,514 3,962 5,31
16/jul 2,677 2,748 3,123 16/jul 3,273 3,669 4,731
30/jul 3,004 3,251 4,927 30/jul 3,233 3,288 4,196
13/ago 2,708 4,047 6,038 13/ago 2,55 4,348 5,176
Figure 4 - Sucrose content (mg g-1 DM) in peach trees cultivar Jubileu (A) and Eldorado (B) at the basal, median and apical portions during dormancy. UFPel, Pelotas, Brazil, 2010. Means compared by Tukey test at 5% probability, ± SE (n=6).
Época basal mediana apical Época basal mediana apical
18/jun 2,725 2,598 2,636 18/jun 2,238 2,187 2,167
01/jul 1,878 1,802 2,234 01/jul 2,214 2,77 3,98
16/jul 2,325 2,341 2,429 16/jul 2,365 2,438 3,376
30/jul 1,813 2,072 3,601 30/jul 2,019 2,157 3,177
13/ago 3,182 5,128 8,215 13/ago 2,199 4,163 5,866
Figure 5 - Starch content (mg g-1 DM) in peach trees cultivars Jubileu (A) and Eldorado (B) at the basal, median and apical portions during dormancy. UFPel, Pelotas, Brazil, 2010. Means compared by Tukey test at 5% probability, ± SE (n=6).
0 2 4 6 8 10 18/6 2/7 16/7 30/7 13/8 Star ch co nten t ( m g. g -1D M)
basal median apical
A 0 2 4 6 8 10 18/6 2/7 16/7 30/7 13/8 basal median apical
B 0 2 4 6 8 18/6 2/7 16/7 30/7 13/8 Su cr os e co nten t ( m g. g -1 D M)
basal median apical
A 0 2 4 6 8 18/6 2/7 16/7 30/7 13/8 basal median apical
B 0 5 10 15 20 25 18/6 2/7 16/7 30/7 13/8 To tal so lu ble s ug ar s co nten t (m g.g -1D M)
basal median apical 0 5 10 15 20 25 18/6 2/7 16/7 30/7 13/8 basal median apical
A B
ÉPOCA basal median apical ÉPOCA basal mediana apical
18/jun 7,647 7,671 8,001 18/jun 8,467 9,58 10,11
01/jul 9,257 9,458 11,006 01/jul 8,764 10,091 14,021
16/jul 9,586 9,361 9,365 16/jul 8,715 9,801 12,472
30/jul 8,329 9,31 13,588 30/jul 9,051 9,258 12,156
13/ago 10,636 15,32 24,671 13/ago 9,756 15,19 20,379
Figure 3 - Total soluble sugar content (mg g-1 DM) in peach trees cultivar Jubileu (A) and Eldorado (B) at the basal, median and apical portions during dormancy. UFPel, Pelotas, Brazil, 2010. Means compared by Tukey test at 5% probability, ± SE (n=6)
EPOCA basal mediana apical EPOCA basal mediana apical
18/jun 2,94 3,09 3,124 18/jun 3,194 3,598 4,038
01/jul 3,193 3,204 3,905 01/jul 3,514 3,962 5,31
16/jul 2,677 2,748 3,123 16/jul 3,273 3,669 4,731
30/jul 3,004 3,251 4,927 30/jul 3,233 3,288 4,196
13/ago 2,708 4,047 6,038 13/ago 2,55 4,348 5,176
Figure 4 - Sucrose content (mg g-1 DM) in peach trees cultivar Jubileu (A) and Eldorado (B) at the basal, median and apical portions during dormancy. UFPel, Pelotas, Brazil, 2010. Means compared by Tukey test at 5% probability, ± SE (n=6).
Época basal mediana apical Época basal mediana apical
18/jun 2,725 2,598 2,636 18/jun 2,238 2,187 2,167
01/jul 1,878 1,802 2,234 01/jul 2,214 2,77 3,98
16/jul 2,325 2,341 2,429 16/jul 2,365 2,438 3,376
30/jul 1,813 2,072 3,601 30/jul 2,019 2,157 3,177
13/ago 3,182 5,128 8,215 13/ago 2,199 4,163 5,866
Figure 5 - Starch content (mg g-1 DM) in peach trees cultivars Jubileu (A) and Eldorado (B) at the basal, median and apical portions during dormancy. UFPel, Pelotas, Brazil, 2010. Means compared by Tukey test at 5% probability, ± SE (n=6).
0 2 4 6 8 10 18/6 2/7 16/7 30/7 13/8 Star ch co nten t ( m g. g -1D M)
basal median apical
A 0 2 4 6 8 10 18/6 2/7 16/7 30/7 13/8
basal median apical
B 0 2 4 6 8 18/6 2/7 16/7 30/7 13/8 Su cr os e co nten t ( m g. g -1 D M)
basal median apical
A 0 2 4 6 8 18/6 2/7 16/7 30/7 13/8
basal median apical
B 0 5 10 15 20 25 18/6 2/7 16/7 30/7 13/8 To tal so lu ble s ug ar s co nten t (m g.g -1D M)
basal median apical
0 5 10 15 20 25 18/6 2/7 16/7 30/7 13/8
basal median apical
A B
época basal mediana apical época basal mediana apical
18/jun 0,910 1,053 1,258 18/jun 1,344 1,3 1,347
01/jul 0,952 1,091 1,445 01/jul 1,427 1,373 1,337
16/jul 0,829 0,842 0,966 16/jul 1,416 1,374 1,276
30/jul 0,770 0,805 0,598 30/jul 1,41 1,43 1,447
13/ago 0,986 1,093 1,529 13/ago 1,549 1,561 1,589
época basal mediana apical
época basal mediana apical 18/jun 0,848 0,862 0,951
18/jun 1,520 1,27 1,365 01/jul 1,016 1,285 1,446
01/jul 1,35 1,378 1,424 16/jul 0,767 0,929 1,232
16/jul 1,403 1,309 1,502 30/jul 0,788 0,827 0,666
30/jul 1,489 1,496 1,384 13/ago 1,066 1,459 2,286
13/ago 1,593 1,568 1,591
Figure 2 - Water content (g g-1 DM) in peach tree cultivars Jubileu (A and B) and Eldorado (C and D), in the bark (A and C) and wood (B and D) during dormancy.UFPel, Pelotas, Brazil, 2010. Means compared by Tukey test at 5% probability, ± SE (n=6). 0
1 2 3
basal mediana apical
C 0 1 2 3 W ater co nten t ( g. g -1D M)
basal mediana apical
A 0 1 2 3 18/6 2/7 16/7 30/7 13/8 W ater co nten t ( g. g -1D M)
basal median apical
B 0 1 2 3 18/6 2/7 16/7 30/7 13/8 basal median apical
A starch re-synthesis was found, this starch-sugar interconversion, this occurring in the penultimate collection (30/July) when both cultivars presented increases in the content of total soluble sugars and starch simultaneously. In this period, the occurrence of quite high temperatures was verified, there being no need of maintenance of high levels of soluble sugars to protect from possible damages to the sensitive organs caused by cold, causing them to convert the sugars into starch.
4 CONCLUSIONS
The increase of the WC in the wood close to the sprouting period is related to the mobilization of reserves for the resumption of growth after the meeting in cold during endodormancy.
The dynamics of the WC and carbohydrates in peach tree branches close to the budding period presented in the following variation sequence: apical> median> basal.
5 REFERENCES
BONHOMME, M.; RAGEAU, R.; GENDRAUD, M.; LACOINTE, A. Influences of cold deprivation during dormancy on carbohydrate contents of vegetative and floral primordia and nearby structures of peach buds (Prunus
persica L. Batch). Scientia Horticulturae, Amsterdam, v. 105, n.2, p. 223-240, 2005.
BONHOMME, M.; PEUCH, M.; AMEGLIO, T.; RAGEAU, R.; GUILLIOT, A.; DECOURTEIX, M.; ALVES, G.; SAKR, S.; LACOINTE, A.; Carbohydrate uptake from xylem vessels and its distribution among stem tissues and buds in walnut (Juglans regia L.). Tree
Physiology, Oxford, v. 30, p. 89-102, 2010.
DISCHE, Z. General colors reactions In: WHISTLER, R.L.; WOLFRAM, M.L. Carbohydrate Chemistry. New York: Academic Press, p. 477-520, 1962.
HONJO, H.; KOBAYASHI, M.; WATANABE, M.; FUKUI, R. Effect of intermittent periods on bud break and carbohydrate content of Japanese pear (Pyrus
pyrifolia Nakai) in different endodormancy stages. Acta
Horticulturae, Amsterdam, v. 587, p. 397-403, 2002. MARAFON, A.C.; HERTER, F.G.; HAWERROTH, F.J. Umidade ponderal em tecidos de pereira durante o período de dormência sob condições de inverno ameno.
Pesquisa Agropecuária Brasileira, Brasília, v. 46, n. 9, p. 1-7, 2011a.
MARAFON, A.C.; CITADIN, I.; AMARANTE, L.; There was a great increase of these carbohydrates
at the apical section from the fourth collection (30/ July) for cultivar Jubileu, but for Eldorado, the same was found only in the fourth collection (13/August). That difference of the dynamics among the branch portions is due to increased capacity of breaking down starch at the apical part of the branch as compared with the base of this same branch, implying into a greater capacity of mobilizing starchy reserves at the apical part of the branch and being able to be related to the acropetal mechanism (CITADIN et al., 2009).
According to Bonhomme et al. (2010), close to sprouting, the strong increase of hexoses towards the apical portion seems to be closely linked to the decrease of both sucrose and starch, but that was not found in the present work in both cultivars, where there was a great increase of these carbohydrates at the apical portion. The same dynamics was observed for the sucrose content (Figure 3). The basal and median portions of the branch present a great sucrose-exporting capacity due to fact that an increase of this content takes place at the apical portion of the branch. Sucrose is exported from the
parenchyma cells to the xylem vessels through H+-
sucrose cotransporters, being displaced along with the water towards the buds, where it is absorbed directly or then hydrolyzed in the apoplast, supporting its importation (YOSHIOKA et al., 1988).
The increase of soluble sugars, sucrose and starch towards the apical portion of the branches during the winter period clearly demonstrate the accumulation of nutrients toward the buds for sprouting and this displacement of nutrients would be directly involved with the WC, which in turn is closely linked to sugar mobilization. Although the contents of total soluble sugar and sucrose have increased mainly close to budding, this increase was not accompanied by the reduction in starch, contradicting the results obtained by Bonhomme et al. (2005) in peach tree and by Marafon et al. (2011b) in pear tree, who found a parallelism between starch hydrolysis and the increase in the content of total soluble sugars in branches during the winter. Maurel et al. (2004) in studies with peach tree, found a decreasing concentration of sucrose and sorbitol during the winter and an increase of glucose and fructose a little before sprouting, the same was found in this study with respect to total soluble sugars, where there was a large increase of the same ones close to the sprouting period.
HERTER, F.G.; HAWERROTH, F.J. Chilling privation during endodormancy period disturbs carbohydrate mobilization in Japanese pear. Scientia Agricola, Piracicaba, v. 68, n. 4, p. 462-468, 2011b.
MAUREL, K.; SAKR, S.; GERBE, F.; GUILLIOT, A.; BONHOMME, M.; RAGEAU, R.; PETEL, G. Sorbitol uptake is regulated by glucose through the hexokinase pathway in vegetative peach tree bud. Journal of
Experimental Botany, London, v. 55, n.398, p. 879-888, 2004.
McCREADY, R.M.; GUGGOLZ, J.; SILVEIRA, V.; OWENS, H.H. Determination of starch and amylose in vegetables Analytical Chemistry, Washington, v. 22, p. 1156-1158, 1950.
SIMÕES, F.; HAWERROTH, F.J.; YAMAMOTO, R.R.; HERTER, F.G. Water Content and carbohydrate dynamics of pear trees during dormancy in Southern Brazil. Acta
Horticulturae, Wageningen, v. 1058, p. 305-312, 2014. WANG, H., WANG, F., WANG, G., MAJOURHAT, K. The responses of photosynthetic capacity, chlorophyll fluorescence and chlorophyll content of nectarine (Prunus
persica var. nectarina Maxim.) to greenhouse and field grown conditions Scientia Horticulturae, Amsterdam, v. 112, n.1, p. 66-72, 2007.
YAMAMOTO, R.R.; HORIGANE, A.K.; YOSHIDA, M.; SEKOZAWA, Y.; SUGAYA, S.; GEMMA, H. “Floral primordia necrosis” incidence in mixed buds of Japanese pear (Pyrus pyrifolia (Burm.) Nakai var. culta) ‘Housui’ grown under mild winter conditions and the possible relation with water dynamics. Journal of the Japanese
Society for Horticultural Science, Kyoto, v. 79, n. 3, p. 246-257, 2010.
YOSHIOKA, H.; NAGAI, K.; AOBA, K.; FUKUMOTO, M. Seasonal changes of carbohydrates metabolism in apple trees. Scientia Horticulturae, Amsterdam, v. 36, n. 3/4, p. 219-227, 1988.