Psychophysiology. 2020;00:e13662.
|
1 of 26https://doi.org/10.1111/psyp.13662 wileyonlinelibrary.com/journal/psyp
O R I G I N A L A R T I C L E
Tears of joy, aesthetic chills and heartwarming feelings:
Physiological correlates of Kama Muta
Janis H. Zickfeld
1,2|
Patrícia Arriaga
3|
Sara Vilar Santos
3|
Thomas W. Schubert
1,3|
Beate Seibt
1,3This is an open access article under the terms of the Creative Commons Attribution-NonCommercial License, which permits use, distribution and reproduction in any medium, provided the original work is properly cited and is not used for commercial purposes.
© 2020 The Authors. Psychophysiology published by Wiley Periodicals LLC on behalf of Society for Psychophysiological Research 1Department of Psychology, University of
Oslo, Oslo, Norway
2Mannheimer Zentrum für Europäische
Sozialforschung, University of Mannheim, Mannheim, Germany
3Departamento de Psicologia Social e das
Organizações (ECSH), ISCTE-Instituto Universitário de Lisboa, CIS-IUL, Lisbon, Portugal
Correspondence
Janis H. Zickfeld, Department of Psychology, University of Oslo, Oslo, Norway.
Email: [email protected]
Funding information
Fundação para a Ciência e a Tecnologia, Grant/Award Number: PTDC/CCI-INF/29234/2017
Abstract
Situations involving increased closeness or exceptional kindness are often labeled as
moving or touching and individuals often report bodily symptoms, including tears,
goosebumps, and warmth in the body. Recently, the kama muta framework has been proposed as a cross-cultural conceptualization of these experiences. Prior research on kama muta has mostly relied on subjective reports. Thus, our main goal of the present project was to examine the pattern of physiological responses to kama muta inducing videos and compare it to the patterns for the similar, though distinct emotions
of sad-ness and awe. One hundred forty-four Portuguese and Norwegian participants were
individually exposed to all three emotion conditions. Several psychophysiological indexes of the autonomic nervous system were collected continuously during expo-sure, including cardiovascular, respiratory, and electrodermal activity, facial EMG, skin temperature, as well as piloerection and lachrymation using cameras. Overall, the results partly replicated previous findings on being moved experiences and self-report studies. Strong self-self-reported experiences of kama muta were associated with increased phasic skin conductance, skin temperature, piloerection, and zygomaticus activity, while they were associated with reduced heart rate, respiration rate, and tonic skin conductance. The physiological profile of kama muta was successfully distinguished from sadness and awe, partly corroborating self-report evidence. We obtained no clear evidence of a kama muta association with the occurrence of lachry-mation or heart rate variability. Our findings provide a systematic overview of psy-chophysiological response to experiences of kama muta, and help to inform future research on this emotion and positive emotions in general.
K E Y W O R D S
1
|
INTRODUCTION
People often say that they are moved or touched, sometimes even to tears. A number of theories have recently concep-tualized such being moved experiences, discussing, and ex-ploring its antecedents, motivations, and its physiological responses (Cova & Deonna, 2014; Haidt, 2003; Menninghaus et al., 2015). One particular framework accounting for emo-tional experiences often labeled as moving is the concept of
kama muta (Fiske, Seibt, & Schubert, 2019). According to
kama muta theory, appraising sudden increases in commu-nality and closeness (communal sharing) evokes a distinctive positive social relational emotion that motivates devotion to communal relationships. The emotion is often accompanied by tears, chills, and feelings of warmth, and is denoted with terms such as moving, touching, or heartwarming in English vernacular (e.g., Zickfeld, Schubert, Seibt, Blomster, et al., 2019).
Recent studies on being moved commonly explored its co-occurrence with tears and goosebumps, and have observed increases in autonomic nervous system (ANS) responses for peak moments of being moved, including increased heart rate (HR), respiration rate (RR), or depth (RD), and continuous phasic skin conductance responses (SCRs; e.g., Benedek & Kaernbach, 2011; Wassiliwizky, Jacobsen, Heinrich, Schneiderbauer, & Menninghaus, 2017). However, no study has systematically explored the psychophysiology of kama muta and compared it to other emotional experiences.
The present study tests the physiological correlates of kama muta and compares them to two similar, though distinct emotions: sadness and awe. In order to enhance the cross- cultural validity of our findings, the studies were conducted using Norwegian and Portuguese participants.
1.1
|
Being moved
Experiences of being moved have been subsumed under vari-ous psychological concepts (see Zickfeld, Schubert, Seibt, & Fiske, 2019 for a review). Already mentioned by Darwin (1872) and McDougall (1919) as the tender emotion, experi-ences of feeling moved were later explored under the concept of empathic concern (Batson, Fultz, & Schoenrade, 1987) and elevation (Haidt, 2003). Empathic concern is argued to occur when observing another person in need, while the emotion of elevation occurs when observing morally supe-rior actions. In addition, recent theorizations have provided more philosophical (Cova & Deonna, 2014; Deonna, 2018) and aesthetic perspectives (Hanich, Wagner, Shah, Jacobsen, & Menninghaus, 2014; Konečni, 2005; Menninghaus et al., 2015, 2017) on the phenomena of being moved. Cova and Deonna conceptualize being moved as a positive emo-tion that occurs when positive core values arise against a
backdrop of negativity (see Strick & Van Soolingen, 2017). Menninghaus and colleagues (2015, 2017; see also Kuehnast, Wagner, Wassiliwizky, Jacobsen, & Menninghaus, 2014) re-gard being moved as a mixed emotion, that often occurs in response to art reception but also as a more general response to highly moral situations that are compatible with self-ideals or prosocial norms, and significant aspects in relationships.
1.2
|
Kama Muta—Being moved by love
The present study uses kama muta theory, which argues that the typical being moved experience is an instance of the theorized emotion kama muta (Sanskrit for moved by love). Based on Relational Models Theory (RMT; Fiske, 2004), the theory assumes that kama muta is evoked by observing or experiencing sudden intensifications of communal
shar-ing (Fiske et al., 2019). In communal sharshar-ing relationships,
resources are shared according to need and ability, and relational partners believe they share essential characteristics. Communal sharing relations are indexed by touch, commen-salism or synchrony (Fiske, 2004). Intensification of com-munal sharing means that agents are perceived as coming closer together, getting more connected and forming a unit. Additionally, the aspect of suddenness refers to a temporal contrast (a shift in salience) that strengthens the emotion. Although it often co-occurs with other emotions, including negative ones (e.g., sadness), kama muta itself is experienced as positive (Fiske et al., 2019). In addition, kama muta is as-sumed to motivate communal action such as hugging, tak-ing care, or helptak-ing others and it is often labeled with terms such as moved, touched, or heartwarming in English ver-nacular (Fiske et al., 2019). The kama muta framework has been supported by several empirical studies in various cul-tures (Blomster Lyshol, Seibt, & Thomsen, 2020; Schubert, Zickfeld, Seibt, & Fiske, 2018; Seibt, Schubert, Zickfeld, & Fiske, 2017; Seibt et al., 2018; Steinnes, Blomster, Seibt, Zickfeld, & Fiske, 2019; Zickfeld, Schubert, Seibt, Blomster, et al., 2019; Zickfeld, Schubert, Seibt, & Fiske, 2017).
There is a high degree of overlap between kama muta and other conceptualizations of being moved experiences, espe-cially with regard to sensations and physiology (Zickfeld, Schubert, Seibt, & Fiske, 2019). Thus, previous studies tar-geting self-report or actual physiological responses of being
moved are informative for kama muta, and the present
re-search is informative for rere-search on being moved. We will, therefore, refer to studies exploring other conceptualizations of being moved, when discussing the physiological responses to kama muta.
However, we note that being moved and kama muta are not the same. Other conceptualizations consider everything that is linguistically labeled as moving (e.g., Menninghaus et al., 2015), or everything that is labeled as moving and
experienced as positive (e.g., Cova & Deonna, 2014), as part of the respective being moved concept. In contrast, there is no definite lexeme denoting kama muta, as no label has a one-to-one overlap across languages, situations, or historical time periods (Schubert, Seibt, Zickfeld, Blomster, & Fiske, 2017). Moved often denotes states of kama muta, but does not always (see Schubert et al., 2017; Zickfeld, Schubert, Seibt, & Fiske, 2019). In fact, the emotion of kama muta is defined by the interplay of the appraisal (i.e., sudden communal sharing intensification), valence, moti-vation, sensations, and label components. In order to avoid mistaking lexical categories for psychological ones (a lexi-cal fallacy, Fiske, 2019), we, therefore, refer to a scientific term, kama muta.
1.3
|
The physiology of Kama Muta
Several studies have provided self-report evidence that in-dividuals experience physiological sensations within their body when they are moved or feeling kama muta, and these findings are largely undisputed across different theorizations (Zickfeld, Schubert, Seibt, & Fiske, 2019).
First, claims that individuals get moist eyes or shed tears in response to being moved (Cova & Deonna, 2014; Fiske et al., 2019; Fiske, Schubert, & Seibt, 2017; Gračanin, Bylsma, & Vingerhoets, 2018; Haidt, 2003; Konečni, 2005; Menninghaus et al., 2015; Miceli & Castelfranchi, 2003; Pohling & Diessner, 2016; Tan, 2009; Tan & Frijda, 1999; Thomson & Siegel, 2016) have been supported by self-re-port evidence (e.g., Landmann, Cova, & Hess, 2019; Mori & Iwanaga, 2017; Schubert et al., 2018; Wassiliwizky, Jacobsen, et al., 2017; Zickfeld, Schubert, Seibt, Blomster, et al., 2019). Relatedly, a feeling of being choked up or hav-ing a lump in the throat, which might be accompanied by intense crying has been identified (Cova & Deonna, 2014; Fiske et al., 2019; Konečni, 2005).
Second, the experience of goosebumps or chills has been mentioned frequently (Benedek & Kaernbach, 2011; Fiske et al., 2019; Menninghaus et al., 2015; Panksepp, 1995) and is supported by self-report evidence (Bannister, 2018; Landmann et al., 2019; Panksepp, 1995; Schubert et al., 2018; Wassiliwizky, Wagner, Jacobsen, & Menninghaus, 2015; Zickfeld, Schubert, Seibt, Blomster, et al., 2019). These find-ings include objective evidence assessing piloerection with the use of a recording device (Benedek & Kaernbach, 2011; Wassiliwizky, Jacobsen, et al., 2017).
Third, experiences of warmth in the body, espe-cially in the center of the chest, have been reported (Cova & Deonna, 2014; Landmann et al., 2019; Pohling & Diessner, 2016; Schnall, Roper, & Fessler, 2010; Schubert et al., 2018; Tan & Frijda, 1999; Thomson & Siegel, 2016; Zickfeld, 2015). All these findings have been obtained using
self-report evaluation, and there exist no studies objectively measuring whether body or skin temperature increases during episodes of kama muta.
1.3.1
|
Autonomic nervous system activity of
Kama Muta
There have been few studies testing ANS responses and other objective psychophysiological measures related to being
moved experiences. Importantly, to our knowledge only four
of these studies were directly related to being moved (i.e., by measuring it through self-report; Benedek & Kaernbach, 2011; Kimura, Haramizu, Sanada, & Oshida, 2019; Wassiliwizky, Jacobsen, et al., 2017; Wassiliwizky, Koelsch, Wagner,
Jacobsen, & Menninghaus, 2017),1 while the remaining
stud-ies focused mostly on responses typical (though not exclu-sive) of being moved experiences, including (aesthetic) chills or tears. From most of these studies it is not clear to what extent kama muta is evoked by the specific stimuli, espe-cially as they are sometimes framed to induce a different emotion (i.e., sadness, attachment love). Those studies, therefore, provide mostly indirect evidence for the ANS re-sponse of kama muta. An overview of the identified studies and their outcomes is provided in Table 1. We will briefly summarize the general pattern of empirical findings regard-ing the different ANS systems and take into consideration theoretical predictions with regard to kama muta.
Cardiovascular activity
Direct and indirect evidence for cardiovascular activity suggests an acceleration of heart rate (HR) activity in re-sponse to moving stimuli. Studies targeting being moved (Wassiliwizky, Jacobsen, et al., 2017), chills (Salimpoor, Benovoy, Longo, Cooperstock, & Zatorre, 2009), and tears (Gross, Fredrickson, & Levenson, 1994) found an increase in HR for strong emotional reactions (compared to a control condition). Consistently, pulse volume amplitude decreases (Salimpoor, Benovoy, Larcher, Dagher, & Zatorre, 2011). However, two studies focusing on being moved reported no differences in HR activity in response to moving stimuli (Benedek & Kaernbach, 2011; Kimura et al., 2019). From a theoretical viewpoint, it is not immediately obvious what cardiovascular reaction strong episodes of kama muta should elicit.
Empirical findings on heart rate variability (HRV) have been mixed. On the one hand, a study comparing the 1As mentioned earlier, although these studies are not directly targeting
kama muta they are relevant as evidence for it, since a person labelling her affective state as being moved is one of the indicators for diagnosing a kama muta experience (though not a sufficient nor necessary one; Fiske, Seibt, & Schubert, 2019).
TABLE 1
Review of physiological findings on being moved and similar responses (chills, tears)
Study n ( n females) Construct Stimuli Comparison
Type of system Cardiovascular
Respiratory Electrodermal fEMG Other HR PVA/ BVP HRV (IBI/RSA) RR RD SCL SCR Zyg Corr ST Goose Tears g
Direct evidence for being moved Benedek and Kaernbach (2011)
50 (43)
Being moved
Audio from music and film Piloerection versus no piloerection
o – o + o + + f
Wassiliwizky, Jacobsen, et al. (2017)
25 (22)
Being moved
Film clips
Goosetears versus control
+ + + + + + f
Wassiliwizky, Koelsch, et al. (2017)
27 (19)
Being moved
Audio from poems Piloerection versus control
+ + o + + f Kimura et al. (2019) 28 (16) Being moved Film clips
Being moved versus neutral
o
+
o
o
c
Indirect evidence for being moved Kraemer and Hastrup (1988)
48
Tears
Film clip
Criers versus non-criers
+ + Gross et al. (1994) 150 Tears Film clip
Criers versus non-criers
+ + e o + – d
Rottenberg, Gross, Wilhelm, Najmi, and Gotlib (2002)
33
a (23)
Tears
Film clips
Criers versus non-criers
+ o o + o d Rottenberg et al. (2003) 31 a Tears Film clip
Criers versus non-criers
+ + – + Hendriks et al. (2007) 60 Tears Film clip
Criers versus non-criers
h + + – o Salimpoor et al. (2009) 32 (17) Chills Music
Pleasurable versus neutral songs
+ – + + – d Salimpoor et al. (2011) 10 (5) Chills Music
Pleasurable versus neutral songs
+ – + + – d Shiota et al. (2011) 37
Attachment/ nurturant love
Film clips
Attachment/nurturant love versus neutral
–
o
b
o
Mori and Iwanaga (2014)
32 (18)
Chills
Music
Self-selected versus control songs
+
Sumpf, Jentschke, and Koelsch (2015)
58 (34)
Chills
Music, film clips Piloerection versus no piloerection
+
o
+
f
physiological reactions of individuals crying to non-criers found an increase in respiratory sinus arrhythmia for cri-ers (RSA; Rottenberg, Wilhelm, Gross, & Gotlib, 2003). On the other hand, a different study comparing reactions to film clips characterized as nurturant or attachment love to neutral films resulted in a decrease of RSA activity for those in the nurturant or attachment love condition (Shiota, Neufeld, Yeung, Moser, & Perea, 2011). From a theoretical viewpoint, kama muta has been found to be experienced as overall positive (Zickfeld, Schubert, Seibt, Blomster, et al., 2019) and positive emotions in general have been associated with increased HRV, as measured by specific time and fre-quency domains of HRV that are highly influenced by the parasympathetic system such as the time domain square root of the mean squared differences of successive heart periods (RMSSD) and the High Frequency (HF) of HRV (Duarte & Pinto-Gouveia, 2017; Oveis et al., 2009).
Respiratory activity
Direct and indirect evidence for changes in respiration rate (RR) have been mixed, ranging from findings showing an increase (Wassiliwizky, Jacobsen, et al., 2017), or no differ-ence (Benedek & Kaernbach, 2011), to findings observing a decrease (Rottenberg et al., 2003) in RR in response to mov-ing or similar stimuli. In addition, RR has been negatively linked to HRV (Song & Lehrer, 2003).
More specific evidence has been found for responses of respiratory depth (RD) or tidal volume. Across most stud-ies (Benedek & Kaernbach, 2011; Mori & Iwanaga, 2017; Rottenberg et al., 2003) being moved or crying responses in-creased RD (though see Gross et al., 1994). Indeed, taking a deep breath has been argued to be typical of kama muta, which would be in line with the presented empirical findings (Fiske et al., 2019). Hence, from a theoretical and empiri-cal view kama muta should be associated with increases in RD, while RR activity should not be affected or even show a decrease.
Electrodermal activity
Direct and indirect findings regarding electrodermal activity (EDA) are somewhat consistent. EDA has been generally di-vided into the tonic component (skin conductance level), re-ferring to slower changes in arousal over time, and the phasic component (skin conductance response), referring to more immediate changes in arousal to specific stimuli (Benedek & Kaernbach, 2010). Indirect evidence starting from tears or chills has provided evidence that skin conductance level, and thereby arousal, shows an increase for tears or chills (e.g., Gross et al., 1994; Salimpoor et al., 2009). However, the only study directly targeting being moved reported no differ-ences in overall tonic EDA for moving experidiffer-ences (Benedek & Kaernbach, 2011). Moreover, (non-specific) phasic skin conductance responses (nSCR) were found to increase
Study n ( n females) Construct Stimuli Comparison
Type of system Cardiovascular
Respiratory Electrodermal fEMG Other HR PVA/ BVP HRV (IBI/RSA) RR RD SCL SCR Zyg Corr ST Goose Tears g
Mori and Iwanagi (2017)
66 (39)
Chills, tears
Music
Self-selected versus control songs
+
o
+
+
Abbreviations: –, decrease; +, increase; Corr, corrugator supercilia; Goose, goosebumps; HR, heart rate; HRV, heart rate varia
bility; IBI, interbeat interval; o, no difference/mixed results; PVA, pulse volume amplitude; RD,
respiratory depth; RR, respiration rate; RSA, respiratory sinus arrhythmia; SCL, skin conductance level (tonic); SCR, skin c
onductance response (phasic); ST, skin temperature; Zyg, zygomaticus major.
aWe focus on the non-clinical sample for the present context. bOnly for nurturant love. cSignificant difference for
high arousal
moving video but not for
low arousal
moving video.
dFinger skin temperature. eAlthough respiratory rate was higher for criers than non-criers, rates were lower than the baseline level. fComparisons were made on the basis whether participants experienced visible piloerection or not so piloerection is by default
higher in the experimental condition.
gNone of the presented studies measured tears in an objective fashion (e.g., by coding videos). hWe inspected the differences between criers and non-criers at the crying onset.
TABLE 1
for moving responses for all studies focusing on being
moved (Benedek & Kaernbach, 2011; Kimura et al., 2019;
Wassiliwizky, Jacobsen, et al., 2017; Wassiliwizky, Koelsch, et al., 2017). From a theoretical viewpoint, kama muta theory supports the assumption that kama muta should include rapid changes in arousal but not overall increases. The theory states specifically that emotional responses occur as a response to
sudden intensifications in communal sharing relations, the
suddenness thereby can be expected to lead to a phasic EDA response (see also Menninghaus et al., 2015 who characterize
being moved as low to mid in arousal).
In conclusion, the evidence regarding ANS responses of kama muta is mixed. This may be because of the considerable variation in measurement and induction methods in previous studies, or it may be that kama muta does not have a distinct ANS pattern, which would be in line with a recent meta-anal-ysis (Siegel et al., 2018). Based on the reviewed empirical and theoretical evidence, it seems that kama muta is best de-scribed by a co-activation of sympathetic (increases in HR, nSCR) and parasympathetic (increases in RD, HRV) ANS activity (Shaffer & Ginsberg, 2017). There is less evidence for changes in SCL and RR.
1.3.2
|
Facial muscle activity
Next to ANS activity, recent studies have explored facial muscle activation as measured by facial electromyography (fEMG). Such activity is generally thought to represent changes in valence, with zygomaticus major activity map-ping onto positive and corrugator supercilia activity onto negative valence (Cacioppo, Petty, Losch, & Kim, 1986). Theorizations of being moved have generally described the emotion as positive in valence, which has been supported by some fEMG studies (Wassiliwizky, Jacobsen, et al., 2017), though not by others (Kimura et al., 2019; Wassiliwizky, Koelsch, et al., 2017). Some theories have also described
being moved as a mixed emotion, consisting of both
posi-tive and negaposi-tive valence (Menninghaus et al., 2015, 2017). Some evidence of increased corrugator activity for peaks of emotional experience supports this (Wassiliwizky, Jacobsen, et al., 2017; Wassiliwizky, Koelsch, et al., 2017).
In self-report, kama muta has been consistently found to be subjectively experienced as positive but not negative (Seibt et al., 2018; Zickfeld, Schubert, Seibt, Blomster, et al., 2019). As mentioned earlier, kama muta often occurs against a backdrop of negativity (Fiske, Seibt et al., 2017; see also Cova & Deonna, 2014; Strick & Van Soolingen, 2017) and is sometimes positively related to experiences of
sadness (Zickfeld, Schubert, Seibt, Blomster, et al., 2019).
Importantly, these more negative experiences are not part of kama muta according to the theory. Therefore, we expect
kama muta to increase zygomaticus but not corrugator ac-tivity. In addition, individuals experiencing sadness should show more corrugator activity than individuals experienc-ing kama muta.
1.3.3
|
Lachrymation, piloerection
& warmth
There are few published studies examining whether the oc-currence of lachrymation (or tears), piloerection (or goose-bumps), and feelings of warmth as found in many self-report studies is indicative of kama muta or being moved.
Piloerection or goosebumps (Benedek & Kaernbach, 2011) are sometimes also referred to as chills, although some schol-ars have argued that chills represent a subjective component, whereas goosebumps refer to objectively quantifiable erec-tion of the skin (Wassiliwizky, Jacobsen, et al., 2017). Studies found that piloerection (operationalized as so-called
gooset-ingles) represents one aspect of the psychological concept of
chills (Maruskin, Thrash, & Elliot, 2012). In line with this, we also regard studies focusing on the construct of chills as informative here. Benedek and Kaernbach (2011) found that episodes involving goosebumps, as assessed with a camera obtaining recordings of the skin (Benedek, Wilfling, Lukas-Wolfbauer, Katzur, & Kaernbach, 2010) were rated as more
moving than the control trials. Chills or goosebumps have been
described as an indicator of arousal (Laeng, Eidet, Sulutvedt, & Panksepp, 2016; Salimpoor et al., 2009), which fits the finding of increased HR and nSCRs presented in the previ-ous section. Similarly, the piloerection response is argued to be guided by the sympathetic branch (Hellmann, 1963). There is some research indicating that subjective chill re-sponses and objectively measured piloerection might diverge (Wassiliwizky, Koelsch, et al., 2017). The authors observed for example an increase in EDA activity for piloerection over time but a decrease for subjective chills responses (see also Maruskin et al., 2012).
Shedding emotional tears has been attributed to para-sympathetic ANS activity (Ioannou et al., 2016; Rottenberg et al., 2003). The lacrimal glands controlling the crying pro-cess are also argued to be controlled by the parasympathetic branch (Werb, 1983). Crying also involves increased arousal and the sympathetic system (Gross et al., 1994; Wassiliwizky, Jacobsen, et al., 2017). Crying, thus, seems to involve a co-ac-tivation of the antagonistic branches of the ANS. Sympathetic activity might increase until the onset of the lachrymation ep-isode, at which point it withdraws and parasympathetic activ-ity increases (Hendriks, Rottenberg, & Vingerhoets, 2007). Wassiliwizky, Jacobsen and colleagues (2017) also found that sympathetic activation was strongest when tears co-oc-curred with goosebumps (so-called goosetears).
Finally, there is mixed evidence with regard to changes in actual body or skin temperature. Studies employing stim-uli ostensibly evoking kama muta or targeting chills ob-served both decreases (Lundqvist, Carlsson, Hilmersson, & Juslin, 2009; Salimpoor et al., 2009, 2011), and increases in finger temperature (Baumgartner, Esslen, & Jäncke, 2006; Krumhansl, 1997; McFarland, 1985; Rimm-Kaufman & Kagan, 1996), and no changes in facial temperature (Rimm-Kaufman & Kagan, 1996). To our knowledge, there are no studies directly testing changes in chest temperature with re-gard to kama muta or being moved experiences. Haidt (2003) argued that heightened feelings of warmth could be attributed to an increase in vagus nerve activity, which is part of the para-sympathetic nervous system. However, no empirical studies have tested such a hypothesis to date. A co-activation of sym-pathetic and parasymsym-pathetic activity is not unlikely (Shaffer & Ginsberg, 2017), and recent empirical research has linked positive emotionality to vagal activity (Depue & Morrone-Strupinsky, 2005; Duarte & Pinto-Gouveia, 2017; Shiota et al., 2011). Likewise, responses of compassion and sympa-thy correlated with increased vagal activity (Stellar, Cohen, Oveis, & Keltner, 2015). Such responses have been linked to kama muta (Zickfeld, Schubert, Seibt, Blomster, et al., 2019).
1.4
|
The present study
The present study is the first to objectively identify psycho-physiological correlates of kama muta. The study has two main aims: (a) to compare peak moments of kama muta with control periods and explore psychophysiological dif-ferences; (b) to compare the physiological measurements
accompanying kama muta to those for the similar, though
distinct, emotional experiences of sadness, and awe.2
We employ sadness and awe as comparisons for sev-eral reasons (see Table 2 for a comparison). First, both have been theoretically (Fiske et al., 2019; Koneçni, 2005; Menninghaus et al., 2015) and empirically (Seibt et al., 2017; Zickfeld, Schubert, Seibt, Blomster, et al., 2019) linked to kama muta or to being moved. Sadness is typically accompanied by emotional tears (Balsters, Krahmer, Swerts, & Vingerhoets, 2013; Sauter, Eisner, Ekman, & Scott, 2010) and awe has frequently been found to include chills and goosebumps responses (Quesnel & Riecke, 2018; Schurtz et al., 2012; Shiota, Keltner, & Mossman, 2007). Second, both sadness and awe have been repeatedly distinguished from kama muta (Seibt et al., 2017; Zickfeld, Schubert, Seibt, Blomster, et al., 2019) and feature different patterns. Sadness has been typ-ically regarded as a negative low arousal emotion (Lench, Tibbett, & Bench, 2016), while awe is argued to comprise positive affect and medium arousal (Shiota et al., 2011). Thus, the two emotions allow for comparison across differ-ent degrees of valence and arousal, as well as accompany-ing bodily sensations such as tears and goosebumps.
We included several measurements to account for the most common physiological indicators of the ANS (cardio-vascular, respiratory and electrodermal), to explore facial muscle contractions using fEMG (and thereby valence), and to provide objective ratings of tears, goosebumps, and skin 2In addition, we also present evidence for the continuous relationship
between self-report ratings of kama muta and physiological measures in the Supporting Information (Tables S1 and S2).
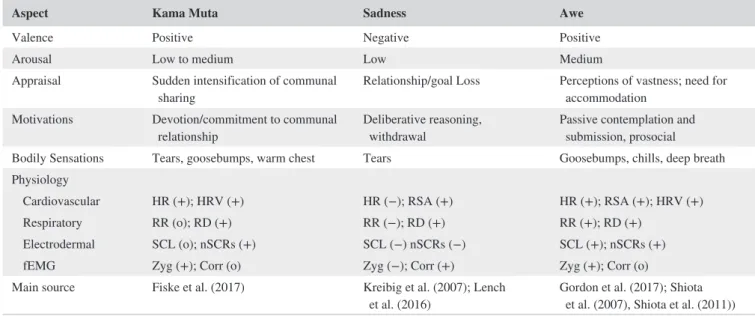
TABLE 2 Overview of theoretical and physiological profiles of kama muta, sadness, and awe
Aspect Kama Muta Sadness Awe
Valence Positive Negative Positive
Arousal Low to medium Low Medium
Appraisal Sudden intensification of communal
sharing Relationship/goal Loss Perceptions of vastness; need for accommodation Motivations Devotion/commitment to communal
relationship Deliberative reasoning, withdrawal Passive contemplation and submission, prosocial Bodily Sensations Tears, goosebumps, warm chest Tears Goosebumps, chills, deep breath Physiology
Cardiovascular HR (+); HRV (+) HR (−); RSA (+) HR (+); RSA (+); HRV (+) Respiratory RR (o); RD (+) RR (−); RD (+) RR (+); RD (+)
Electrodermal SCL (o); nSCRs (+) SCL (−) nSCRs (−) SCL (+); nSCRs (+) fEMG Zyg (+); Corr (o) Zyg (−); Corr (+) Zyg (+); Corr (o) Main source Fiske et al. (2017) Kreibig et al. (2007); Lench
et al. (2016) Gordon et al. (2017); Shiota et al. (2007), Shiota et al. (2011))
Abbreviations: −, decrease; +, increase; Corr, corrugator; HR, heart rate; HRV, heart rate variability; nSCRs, phasic non-specific skin conductance responses; o: no change; RD, respiratory depth (tidal volume); RR, respiration rate; RSA, respiratory sinus arythmia; SCL, tonic skin conductance level; Zyg = zygomaticus major.
temperature around the chest. In addition, we included ANS measures typically obtaining evidence for sympathetic (EDA) and parasympathetic activation (HRV domain indicators— RMSSD). Our study is thereby the most comprehensive psy-chophysiological investigation of being moved experiences to date (see overview in Table 1).
Based on previous findings regarding physiological mea-sures, self-report evidence, and theoretical predictions, we drafted several hypotheses. For the comparison between high and low reactions of kama muta to video segments we pre-dicted the following:
Hypothesis 1 Emotional responses of kama muta increase
HR,3 HRV, RD, and nSCRs, while there is no change with regard to RR and SCL.
Hypothesis 2 Emotional responses of kama muta increase
zygomaticus activity while there is no change in corru-gator activity.
Hypothesis 3 Emotional responses of kama muta induce
tears, goosebumps and higher skin temperature around the chest.
Regarding discriminant validity by comparing responses to moving videos with responses to sad and awe-inducing videos, we predict that:
Hypothesis 4 Physiological reactions to moving videos are
similar to reactions to sad videos with regard to RD, nSCRs, and tears, while these emotions should differ on ST, HR, HRV, RR, SCL, Zyg, Corr, and goosebumps. Moving videos will evoke stronger ST, HR, HRV, RR, SCL, Zyg, and goosebumps responses, while sad videos will evoke stronger Corr responses.
Hypothesis 5 Physiological indicators of kama muta are
similar to those of awe with regard to HR, HRV, RD, nSCRs, Zyg, Corr, and goosebumps, while these emo-tions should differ on ST, RR, SCL, and tears. Moving videos will evoke stronger ST and tears responses, while awe-inducing videos will evoke stronger RR and SCL responses.
All measures, stimuli, and experimental and data files are published online at our project page (https://osf.io/rymnu/), except for data that could identify participants (e.g., video recordings). The study was approved by the internal review board of the University of Oslo and by the scientific commit-tee of ISCTE-IUL, Lisbon. The Norwegian part of the study
was also approved by the Norwegian Centre for Research Data (NSD; 54037).
2
|
METHOD
2.1
|
Participants
For the final sample we recruited 105 Portuguese participants
(62 females; age range: 17 to 36, Mage = 21.57, SDage = 3.03)
at ISCTE-IUL and 39 Norwegian undergraduate participants
(24 females; age range: 19 to 45, Mage = 21.82, SDage = 4.62)
at the University of Oslo, resulting in a total sample of 144 participants. The limited amount of previous research com-plicated conducting a well-reasoned a-priori power analy-sis. Previous studies found in general medium effect sizes but also included small sample sizes (e.g., ns of 50, 25, 66). Recommendations for HRV analysis suggest a rule-of-thumb of 61 participants for medium effects (Laborde, Mosley, & Thayer, 2017). We tried to fulfill these criteria and included as many participants as possible in the present study.
2.2
|
Procedure and materials
Both subsamples followed largely the same procedures. Participants were greeted and presented with written in-formed consent. First, the experimenters attached the physiological sensors. Then, participants were seated in an armchair about two meters away from a 55-inch LCD dis-play (Samsung LH55EDDPLGC/EN) with a refresh rate of 50Hz in the Norwegian sample. In the Portuguese sample, participants were seated about 65 centimeters away from a 23-inch LCD display (LG Flatron W236 3D) with a refresh rate of 60Hz. Sound was presented through headphones and the room temperature was kept constant at 23 ± 1°C. Videos were presented in E-Prime 2.0 (Psychology Software Tools Inc.), which recorded self-report measures and sent triggers to the physiological recording device via a parallel port to mark video onset and offset.
After a short resting period, participants were instructed and presented with a five-minute baseline video presenting different shots of a forest during which baseline measures were obtained. Then, participants were presented with six dif-ferent videos, which were chosen based on previous research to induce kama muta, sadness, and awe, two videos per emo-tion (Zickfeld, Schubert, Seibt, Blomster, et al., 2019). The kama muta videos depicted a doctor showing his gratitude after 30 years by rescuing one of his patients and a man per-forming good and altruistic deeds during his daily life. The sad videos included an animated short story of a boy losing his father in an accident and the story of a girl in a warzone that has to flee from war and is separated from her father. 3Note that we adapted the hypothesis with regard to HR after reviewing
additional empirical studies. While this could be considered a form of
HARKing, adjusting hypotheses in light of results, it is noteworthy to
emphasize that the readjusted hypothesis deviates from the obtained results. Given the empirical findings we consider this change as sensible.
The awe videos included a climber ascending the Dawn Wall and aerial shots of mountain ranges. Three blocks of two videos, each targeting the same emotion, were presented in randomized order for each participant. The two videos within each block were also randomized. The video lengths differed between 83 and 211 s, while the length of each block was around 300 s. For the Norwegian sample, the videos were presented in English, while we included Portuguese subtitles in the Portuguese sample.
After each emotion type block, participants completed self-report measures targeting both videos. We included the sensations, valence, and labels section of the KAMMUS (Zickfeld, Schubert, Seibt, Blomster, et al., 2019), a validated self-report scale to measure kama muta in several countries, including Portugal and Norway (descriptives are presented in Table S12). The sections included 12 items on sensations (e.g., “A warm feeling in the center of the chest”), two items on valence (e.g., “I had positive feelings”), and 11 items on labels. Of these emotion labels, three items were averaged to form the kama muta label index (“I felt moved,” “I felt touched,” “It was heartwarming”), and one item each as-sessed feeling awed (“I felt awed”) and sad (“I felt sad”), as a manipulation check for the awe and sadness-inducing videos (the remaining six labels were fillers). Thus, each participant completed these measures thrice. All items were completed on 7-point scales ranging from 0 (“not at all”) to 6 (“very much”). We also recorded whether participants had watched the videos before. After the video presentation, physiological sensors were removed, and participants completed a short questionnaire including demographic questions and items on whether they had consumed food or beverages prior to the
experiment, smoked regularly, took regular medication.4
Finally, participants were thanked and debriefed.5
2.2.1
|
Physiological recordings
An overview of all physiological recordings, how they were assessed, and the location of measurement is provided in Table 3. At the Portuguese site we collected an electrocar-diogram (ECG), respiration, electrodermal activity (EDA), and facial electromyography (fEMG). At the Norwegian site we collected blood volume pulse via a photoplethysmograph (PPG), respiration, EDA, and skin temperature. Physiological data were recorded using BIOPAC MP150 (Biopac Systems Inc., Goleta, CA) and the AcqKnowledge 4.1 software. All measurements were recorded at a rate of 1KHz. EDA was measured on the palmar surface of the middle phalanges of the first and second fingers of the non-dominant hand. A 4We also tested the effect of medication on our main models. We observed
an interaction effect of kama muta level (low vs. high segments of the kama muta videos) and medication for skin temperature, skin conductance level, respiratory depth, goosebumps, zygomaticus, and corrugator activity. However, at the same time we observed comparable main effects of level of kama muta. Results are reported in the Supporting Information (Table S5).
5In the Portuguese sample participants also completed a 7- item scale
targeting the general frequency of experiencing kama muta (KAMF; Zickfeld, Schubert, Seibt, Blomster et al., 2019) and the 28 items of the Interpersonal Reactivity Index measuring different facets of empathy (Davis, 1980). To control for order effects 53 participants completed these measures prior to the main experiment, while 52 responded afterwards.
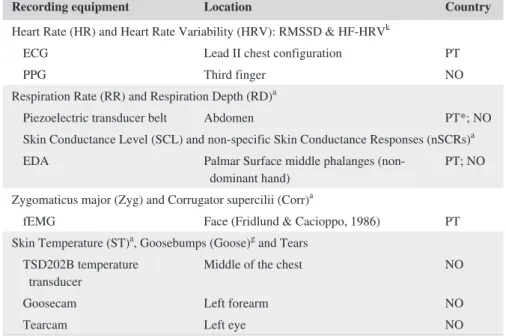
Recording equipment Location Country
Heart Rate (HR) and Heart Rate Variability (HRV): RMSSD & HF-HRVk
ECG Lead II chest configuration PT
PPG Third finger NO
Respiration Rate (RR) and Respiration Depth (RD)a
Piezoelectric transducer belt Abdomen PT*; NO Skin Conductance Level (SCL) and non-specific Skin Conductance Responses (nSCRs)a
EDA Palmar Surface middle phalanges
(non-dominant hand) PT; NO
Zygomaticus major (Zyg) and Corrugator supercilii (Corr)a
fEMG Face (Fridlund & Cacioppo, 1986) PT Skin Temperature (ST)a, Goosebumps (Goose)g and Tears
TSD202B temperature
transducer Middle of the chest NO
Goosecam Left forearm NO
Tearcam Left eye NO
Abbreviations: aAcqKnowledge 4.1/4.3/5.0; gGooselab 1.12; NO, Norway; PT, Portugal; Software: kKubios
3.1.
*Data for respiratory measures obtained from Portugal were not usable due to a hardware problem.
TABLE 3 Overview of physiological measurements and their processing software and location
constant voltage of 0.5 V was maintained between two dis-posable 11mm Ag/AgCl snap electrodes filled with NaCl electrolyte paste gel. ECG was obtained using three pre-gelled disposable Ag/AgCl electrodes (11 mm diameter, EL503 EKG), placed in a Lead II chest configuration. Blood volume pulse was recorded using a PPG sensor attached to the third finger of the left hand. Respiration was obtained with a piezoelectric transducer belt placed around the ab-domen. Skin temperature was measured using a TSD202B temperature transducer attached to the middle of the chest. Finally, fEMG was obtained at the corrugator supercilii and the zygomaticus major using disposable Ag/AgCl electrodes with 4 mm diameter, filled with gel, placed in accordance with recommendations (Fridlund & Cacioppo, 1986).
Goosebumps and tears were recorded using two camera devices in the Norwegian sample only. For piloerection mea-surement we employed the goosecam, a device based on in-structions by Benedek et al. (2010), which was attached to the left forearm of the participant with a strap. In addition, participants wore a custom constructed spectacle frame that featured a camera pointing at the left eye. Videos were re-corded using AcqKnowledge and Matlab 2017b.
Finally, we assessed the amount of tears or moist eyes ob-servable, but only in the Norwegian sample. Their right eye was recorded using a video camera during the experiment. The video recorded during viewing of each video was coded by a research assistant as to whether it included no tears or moist eyes (0), moist eyes (1), little crying (2), or a lot of cry-ing (3). One ratcry-ing was given per video, thus, not resultcry-ing in a continuous score for this measure. We, therefore, only ana-lyze lachrymation comparing emotion conditions, not within videos.
2.2.2
|
Preprocessing
Most artefacts were corrected through visual inspection of the data. Four Portuguese participants were excluded from all analyses because of artefacts that could not be corrected. Therefore, the final sample for most analyses consisted of 140 participants. The respiration data in the Portuguese sam-ple showed a considerable amount of noise possibly caused by the sensor. After consulting with the manufacturer of the hardware and software system we decided to exclude the Portuguese respiration data. Thus, the present respiration data are only based on the Norwegian participants.
The ECG and PPG6 signals were registered to identify
heart rate (HR) and two measures of vagal tone from heart rate variability (HRV): the square root of the mean squared differences of successive heart periods (RMSSD) to assess
changes in the time domain, and the high frequency compo-nent (HF-HRV) using log-transformed values of absolute powers of high-frequency bands (0.15–0.40 Hz) to address changes in frequency. Both raw ECG and blood volume data of PPG were analyzed with Kubios HRV Premium Software (Version 3.1, 2018, Kubios Oy, Kuopio, Finland). In Kubios, a cubic spline interpolation was used with a rate of 4 Hz. Additional artifacts correction was made with interpolated values into the RR interval data of 58 videos (out of a total of 708 video analyses, 8.19% of the data). In these artifact cor-rections, the number of corrected beats was low, making a significant distortion of the results due to the correction
highly unlikely (Mpeaks_corrected = 0.21). Finally, a smoothness
priors detrending, with a Lambda of 500, was employed as recommended for short-term HRV analyses (Tarvainen, Lipponen, Niskanen, & Ranta-Aho, 2018).
The EDA signal was resampled to 50 Hz,7 processed
using a 50-sample median smoothing filter, and using a finite impulse response (FIR) low-pass filter at 1 Hz with a Blackman (−61 dB) window (see Braithwaite, Watson, Jones, & Rowe, 2013). Both tonic and phasic EDA were analyzed, corresponding to the SCLs and the absolute frequency of non-specific skin conductance responses (nSCRs) that emerged throughout the exposure to each video, respectively. These two components were obtained using an in-built rou-tine in AcqKnowledge, by implementing a 0.05 Hz high pass filter, a baseline estimation window width of 0.25 s, a SCR threshold level at 0.01 µS, and a rejection rate of 10%. As the different videos had different lengths, we accounted for the duration of the video when calculating the frequency of nSCRs.
Respiration rate was registered using a respiration belt, with the data resampled to 50 Hz, then band-pass filtered be-tween 0.05 and 1 Hz, and fixed at 4,000 coefficients with a Blackman (−61 dB) window (Lorig, 2007). Calculation was based on a peak detection algorithm implemented in AcqKnowledge. Additionally, respiration depth was extracted based on a peak to peak detection algorithm implemented in the software. Skin temperature data were resampled to 50 Hz and filtered using a FIR low-pass filter at 1 Hz.
As suggested by van Bedaf, Heesink, and Geuze (2014), the fEMG data were processed by first applying a FIR band-pass filter between 28 and 500 Hz, fixed at 1,001 coefficients (Hamming window) and second, an infinite impulse response (IIR) band-stop filter, with a frequency of 50 Hz and Q set to 30.59. Next, we computed the root mean square (RMS) with a time window interval mean of 0.3 s.
Goosecam videos were synchronized with the physio-logical recording and presentation by adding LED marks 6Note that the discrepancy between HRV measures obtained from ECG and
PPG signals is rather low (Shaffer & Ginsberg, 2017).
7EDA, respiration and skin temperature scores were all resampled to 50Hz.
This rate represents typical ranges used in previous studies (Mori & Iwanaga, 2017; Wassiliwizky, Jacobsen, et al., 2017).
to the recordings. Goose videos were resampled at 1fps and analyzed using Gooselab V 1.12 in Matlab 2017b, as recom-mended by Benedek and Kaernbach (2011). Due to a loose contact, a minority of videos featured a black screen for some seconds, which were corrected by imputing the mean of the time series. By means of an epoch analysis, a total of 174,733 data points were extracted for all seven videos (one baseline, and two kama muta, sad, and awe videos). Measurements were retained at 1 Hz, with one measurement correspond-ing to one second of the video. For cardiac measurements (ECG and PPG) we employed mean scores, as our time res-olution was too low to extract continuous scores (Shaffer & Ginsberg, 2017).
Scores were adjusted for interindividual differences by subtracting the mean of the individual baseline responses to the initial video from the respective measurement, resulting in a reactance or difference score (e.g., Benedek & Kaernbach, 2011; Wassiliwizky, Koelsch, et al., 2017). A positive score exemplifies a higher score, or increase, in com-parison to the baseline, while a negative score reflects lower responding in contrast to the baseline. To allow comparisons across measures we then z-standardized all measures. The final score, therefore, presents a standardized difference from
the baseline.8 Measures of HRV, zygomaticus and corrugator
activity were log-transformed before differencing and stan-dardization, as recommended (Laborde et al., 2017).
3
|
RESULTS AND DISCUSSION
9We conducted three main types of analysis: First, we com-pared self-reports of emotions between the different con-ditions, testing whether the videos evoked the intended emotions. Second, we looked at changes of physiological re-sponses within the kama muta videos by comparing segments that evoked little kama muta to segments that evoked a lot of kama muta (kama muta level; Hypothesis 1–Hypothesis 3). Third, we tested whether physiological responses differed
between the three different emotion conditions, by
compar-ing kama muta to sadness and to awe videos (emotion type; Hypothesis 3–Hypothesis 5).
3.1
|
Preparation of analyses
For the purpose of the within-video comparisons, we iden-tified short segments (30 s) a-priori that evoked little ver-sus a lot of kama muta by relying on data from Schubert et al. (2018) for the same videos. In that study, several hun-dred participants rated several variables continuously while watching the videos (Schubert et al., 2018). We used here ratings of being moved, perceived closeness, experienced
tears, warmth, and goosebumps. These ratings were made
by U.S. participants and may not align perfectly with experi-ences of Norwegian and Portuguese participants; however, recent studies revealed little cross-cultural variations for such self-report data (Zickfeld, Schubert, Seibt, Blomster, et al., 2019). For the first video (“Thai Medicine”), we identified the segment from 130 to 160 s as most kama muta evoking, and the sequence between 40 and 70 s as the control period. For the second video (“Thai Altruism”), the strongest kama muta segment appeared from 120 to 150 s, and the sequence from 10 to 40 s was the control segment.
For the physiological measures, we retained all vari-ables at a resolution of single seconds. To adequately ac-count for within-subject variation, we used multilevel modeling as recommended for psychophysiological data (Judd, Westfall, & Kenny, 2012; Page-Gould, 2016; see Wassiliwizky, Jacobsen, et al., 2017 for an example). All main models were computed using linear mixed model in the lme4 package in R (Bates, Mächler, Bolker, & Walker, 2014). We report unstandardized effect sizes B and standardized effect sizes d based on transformations
by Bowman (2012) and Lakens (2013).9 When using mixed
models, we report descriptive means and within-subjects standard errors calculated based on Morey (2008). Alpha was set to .05 for all analyses.
Correlations among the physiological measures, as well as correlations between physiological and self-report measures are provided in the Supporting Information (Table S13–S14).
3.2
|
Comparing self-reported emotions
between emotion conditions
We examined self-report responses across the three emotion types (kama muta vs. sadness vs. awe) using multilevel mod-els. Country was always added as a factor. As predicted, self-reported kama muta (average of feeling moved, touched, and
heartwarming) was highest for the kama muta videos
(M = 4.63, SD = 1.22) in comparison to both the sad (M = 2.55, SD = 1.23, d = 1.70) and the awe videos 8Note that for the final standardized scores a deviation from zero does not
provide any information about an increase or decrease from baseline. Plots presenting the unstandardized difference scores can be found in Figure S4– S5. For analyses between levels of kama muta, scores generally increased from baseline (except for RMSSD, HF, and RD where we found decreases for both levels of kama muta). For analyses across emotion types, scores also increased from baseline for all emotion types, with the exception of HR, RMSSD, HF, and RD where they decreased for all emotion types.
9We repeated all analyses presented in the Results sections excluding outliers detected using the absolute deviation from the median (Leys,
Delacre, Mora, Lakens, & Ley, 2019). Results were similar to our main models and can be found in Table S8–S11.
9Due to the z-standardization of our dependent variables and the coding of
our IV, unstandardized Bs reflect standardized ds for the within kama muta comparisons.
(M = 1.47, SD = 1.25, d = 2.54).10 Similarly, sadness ratings were highest for the sad videos (M = 4.39, SD = 1.41) in contrast to kama muta (M = 2.77, SD = 1.72, d = 1.03), and awe (M = 0.54, SD = 0.97, d = 2.73). Finally, awe ratings were highest for the awe videos (M = 3.27, SD = 1.92) in comparison to sadness (M = 2.58, SD = 1.86, d = 0.37) and kama muta (M = 2.15, SD = 1.85, d = 0.59). For the awe rat-ings, country and condition interacted: The difference be-tween awe and sadness videos was stronger in the Portuguese (d = 0.48) than in the Norwegian sample (d = 0.08). No such interactions were observed for the kama muta or sadness rat-ings. An overview of all self-report ratings is provided in the Supporting Information (Figure S1–S3). These self-reported emotions confirm that the videos elicited the emotions as we planned.
3.3
|
Comparing physiological reactions to
high versus low Kama Muta segments within
Kama Muta videos
In these analyses, we compared physiological mean re-sponses during segments eliciting little kama muta to seg-ments eliciting a lot of kama muta within the two kama muta videos only. We used multilevel models. Units of analyses were individual physiological measures for each second. These dependent variables were z-standardized. Kama muta
level (low: −0.5 vs. high: 0.5) was added as a predictor.11
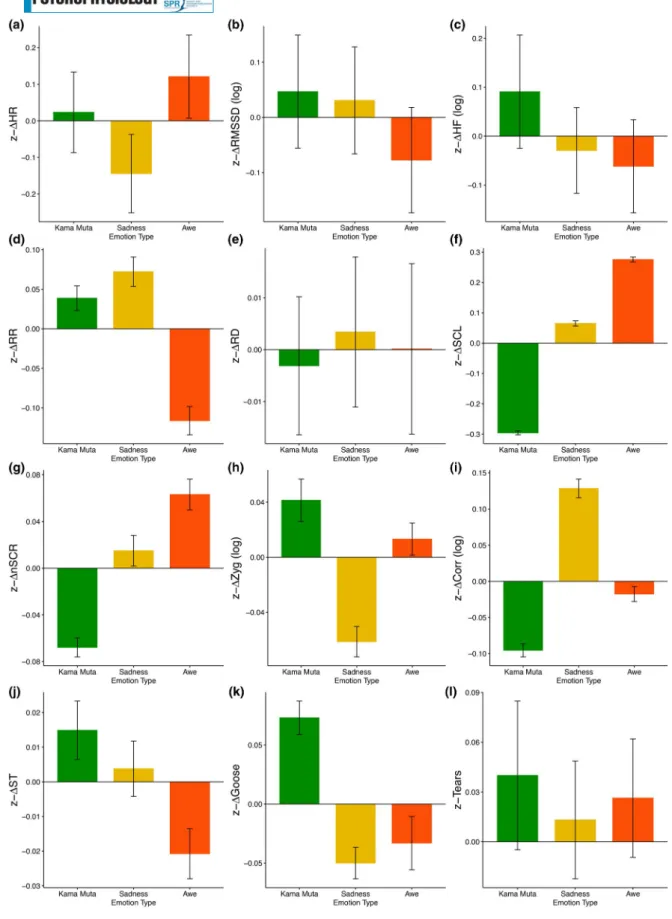
Intercepts varied randomly according to participant. Overviews of all measures are presented in Figure 1 and Table 4.
3.3.1
|
Cardiovascular activity
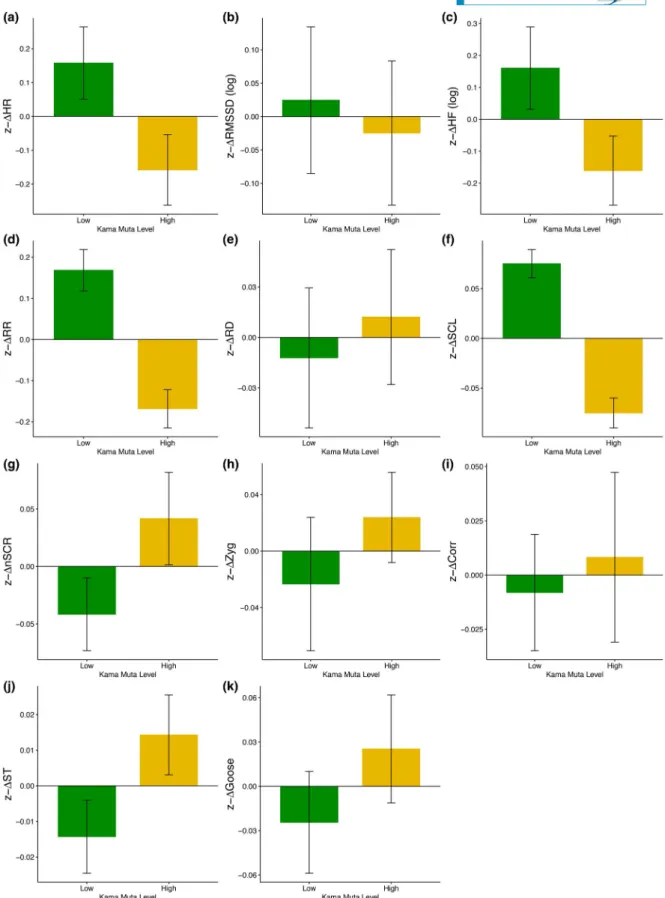
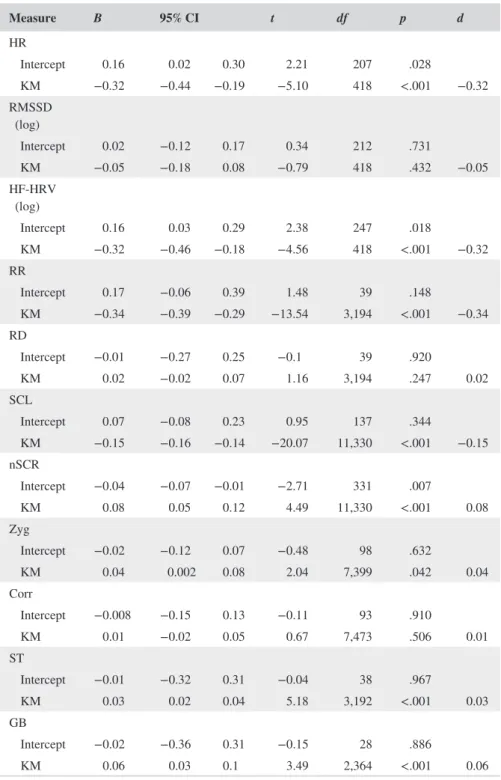
Contrary to Hypothesis 1, we found no evidence of increased heart rate during high kama muta segments. Instead, we found a significant main effect pointing at a decrease (M = −0.16, SE = 0.05) during high kama muta segments com-pared to low kama muta segments (M = 0.16, SE = 0.05).
Similarly, we did not observe an increase in HRV during high kama muta segments, failing to support Hypothesis 1. The time domain measure of RMSSD did not elicit a sig-nificant difference between low (M = 0.02, SE = 0.05) and high segments (M = −0.02, SE = 0.05). In addition, we found a lower HF-HRV for the high kama muta segments (M = −0.16, SE = 0.06) compared to the low kama muta segments (M = 0.16, SE = 0.07). Notably, this effect was moderated by country and stronger in the Norwegian sample (d = 0.38) than in the Portuguese sample (d = 0.15; see Table S3).
Our Hypothesis 1 was not confirmed. Our results on heart rate differ from several previous studies that observed an increase in HR (e.g., Wassiliwizky, Jacobsen, et al., 2017; Wassiliwizky, Koelsch, et al., 2017) during similar experi-ences. The lack of consistent effects for HRV is in line with previous studies (e.g., Shiota et al., 2011). Based on our evidence here, we cannot draw any systematic conclusions whether kama muta experiences increase or decrease HRV.
3.3.2
|
Respiratory activity
High segments of kama muta videos were associated with higher RD (M = 0.01, SE = 0.02) than low segments (M = −0.01, SE = 0.02), but this effect was small (d = 0.02) and not statistically significant, thereby not supporting Hypothesis 1. Similarly, findings with regard to RR did not support Hypothesis 1. While we expected no differences, we found that low kama muta segments showed higher RR (M = 0.17, SE = 0.03) than high kama muta segments (M = −0.17, SE = 0.02). A similar pattern was found in some previous studies (e.g., Benedek & Kaernbach, 2011; Mori & Iwanaga, 2017), but not in others (Wassiliwizky, Jacobsen, et al., 2017) which actually reported the opposite, an increase in RR.
The present findings partly support the notion that strong experiences of kama muta induce more deep breathing, which might be influenced by the fact that individuals de-accelerate their breathing rate or hold their breath (Fiske et al., 2019).
3.3.3
|
Electrodermal activity
Supporting Hypothesis 1, high kama muta segments showed a higher number of relative nSCRs (M = 0.04, 10To adequately differentiate kama muta from the other conditions, we also
tested for differences in the sensations (tears, chills, warmth, choked up, and feeling exhilarated) and valence components. Except for feeling choked up, all these discriminated the kama muta videos from the other two videos. Due to time constraints, we were not able to assess the appraisal and motivation dimensions of the KAMMUS. However, previous studies in Norway and Portugal using the exact same videos have provided evidence that these responses differentiate from sadness and awe videos (Zickfeld, Schubert, Seibt, Blomster, et al., 2019).
11The analyses reported here are simplified models that report only the
main effects. In addition, we also ran more complex models accounting for video (video1: Thai Medicine, −0.5 vs. video2: Thai Altruism, 0.5), order KM (Kama Muta video first −0.5 or second 0.5), order full (video block first −0.5, second 0 or third 0.5), country (Portugal, −0.5 vs. Norway, 0.5; if applicable) as factors and all interactions with level of kama muta. To account for the time course of the experiment, we added group-centered time (centered on video and level of KM) as a covariate and also its interaction with kama muta level. For the cardiac measures we repeated all models including country and video. All models provided results similar to the “main effects” reported here in the main text. Although we observed significant interaction effects for specific moderators in various models, we did not find any systematic results for the additional predictors. The results of these more complex model can be found in the Supporting Information (Tables S3 and S4; Figure S6).
FIGURE 1 Standardized scores (difference from baseline) for each physiological recording for low and high kama muta segments. Scores
are unadjusted for time or other factors. Errors bars correspond to within standard errors calculated based on Morey (2008). (a) HR, heart rate; (b) RMSSD, root mean square of successive differences (log); (c) HF, high frequency heart rate variability (log); (d) RR, respiration rate; (e) RD, respiratory depth; (f) SCL, skin conductance level; (g) nSCR, non-specific skin conductance responses; (h) Zyg, zygomaticus major; (i) Corr, corrugator supercilii; (j) ST, skin temperature; (k) Goose, goosebump activity
SE = 0.02) than segments evoking low kama muta (M =
−0.04, SE = 0.02). Importantly, we focused on the over-all rate of responses, not on the intensity as previous stud-ies. This is in line with the prediction that kama muta experiences comprise sudden, phasic changes in arousal. However, replicating Benedek and Kaernbach (2011), we did not find an increase in the average tonic level for high kama muta segments. Instead, it was even lower (M =
−0.08, SE = 0.008) than during the low kama muta seg-ments (M = 0.08, SE = 0.007).
This partly supports Hypothesis 1, as we expected no difference in SCL between the conditions. Thus, the present and previous findings point at possible abrupt fluctuations in arousal that do not increase the level on average, possibly due to top-down regulations (Nagai, Critchley, Featherstone, Trimble, & Dolan, 2004).
Measure B 95% CI t df p d HR Intercept 0.16 0.02 0.30 2.21 207 .028 KM −0.32 −0.44 −0.19 −5.10 418 <.001 −0.32 RMSSD (log) Intercept 0.02 −0.12 0.17 0.34 212 .731 KM −0.05 −0.18 0.08 −0.79 418 .432 −0.05 HF-HRV (log) Intercept 0.16 0.03 0.29 2.38 247 .018 KM −0.32 −0.46 −0.18 −4.56 418 <.001 −0.32 RR Intercept 0.17 −0.06 0.39 1.48 39 .148 KM −0.34 −0.39 −0.29 −13.54 3,194 <.001 −0.34 RD Intercept −0.01 −0.27 0.25 −0.1 39 .920 KM 0.02 −0.02 0.07 1.16 3,194 .247 0.02 SCL Intercept 0.07 −0.08 0.23 0.95 137 .344 KM −0.15 −0.16 −0.14 −20.07 11,330 <.001 −0.15 nSCR Intercept −0.04 −0.07 −0.01 −2.71 331 .007 KM 0.08 0.05 0.12 4.49 11,330 <.001 0.08 Zyg Intercept −0.02 −0.12 0.07 −0.48 98 .632 KM 0.04 0.002 0.08 2.04 7,399 .042 0.04 Corr Intercept −0.008 −0.15 0.13 −0.11 93 .910 KM 0.01 −0.02 0.05 0.67 7,473 .506 0.01 ST Intercept −0.01 −0.32 0.31 −0.04 38 .967 KM 0.03 0.02 0.04 5.18 3,192 <.001 0.03 GB Intercept −0.02 −0.36 0.31 −0.15 28 .886 KM 0.06 0.03 0.1 3.49 2,364 <.001 0.06
Abbreviations: Corr = corrugator; GB = goosebumps; HF-HRV = high-frequency heart rate variability; HR, heart rate; KM = Kama Muta level (−0.5 low, 0.5 high); nSCR = non-specific skin conductance response; RD = respiration depth; RMSSD = root mean square of the successive differences;RR = respiration rate; SCL = skin conductance level; ST = skin temperature; Zyg = Zygomaticus.
TABLE 4 Separate multilevel models for the physiological recordings depending on kama muta level (high vs. low)
3.3.4
|
Facial muscle activity
Supporting Hypothesis 2, we observed that strong kama muta segments were associated with higher zygomaticus activity (M = 0.02, SE = 0.02) than low kama muta segments (M = −0.02, SE = 0.02; replicating Wassiliwizky, Koelsch, et al., 2017). Interestingly, the more detailed analyses revealed that this effect was only observed for one of the two kama muta videos (“Thai Medicine,” see Supporting Information). Furthermore, we found no evidence for significantly in-creased corrugator activity for strong kama muta segments (M = 0.008, SE = 0.02) compared to low segments (M = −0.008, SE = 0.01).
Activation of zygomaticus major has been generally associated with positive affect (e.g., Larsen, Norris, & Cacioppo, 2003), and we confirm that it can be increased during kama muta, but it may not universal. Activation of the corrugator is associated with negative affect or mental effort, and we do not find here that it is related to kama muta. This contradicts the studies by Wassiliwizky, Koelsch, et al. (2017) and Kimura et al. (2019), but is in line with Hypothesis 2 and also previous findings based on self-report.
3.3.5
|
Skin temperature
Supporting Hypothesis 3, we found some evidence that strong kama muta segments featured slightly higher ST (M = 0.014,
SE = 0.006) than low kama muta segments (M = −0.014, SE = 0.005; d = 0.03; temperature difference of 0.02°C).
This replicated previous findings from a pilot study observ-ing a comparable difference (see Supportobserv-ing Information).
The association between aspects of kama muta and feel-ings of warmth, especially in the chest, has been most con-sistent across self-report studies (Seibt et al., 2018; Zickfeld, Schubert, Seibt, Blomster, et al., 2019).
3.3.6
|
Goosebumps
Finally, using an objective measure of goosebumps, the
goosecam, we observed significantly higher piloerection
during the high kama muta segments (M = 0.03, SE = 0.02) in contrast to the low kama muta segments (M = −0.03,
SE = 0.02). This corroborates previous self-report evidence
that kama muta (if intense) is accompanied by piloerection. Notably, the occurrence of observable goosebumps was also rather low (2.6%) and not comparable to previous frequen-cies (about 50%; Benedek & Kaernbach, 2011; Wassiliwizky, Jacobsen, et al., 2017; Wassiliwizky, Koelsch, et al., 2017; see the Limitations section for an in-depth discussion).
3.4
|
Comparing physiological differences
between emotion conditions
In addition, we compared physiological mean responses across the three emotion conditions. We employed multilevel models with the z-scored physiological measures as the de-pendent variable and emotion type (Dummy coded with
kama muta as the reference group) as a factor.12 Units of
analysis are individual seconds. Intercepts varied randomly for participant. An overview is provided in Figure 2 and Table 5.
3.4.1
|
Cardiovascular activity
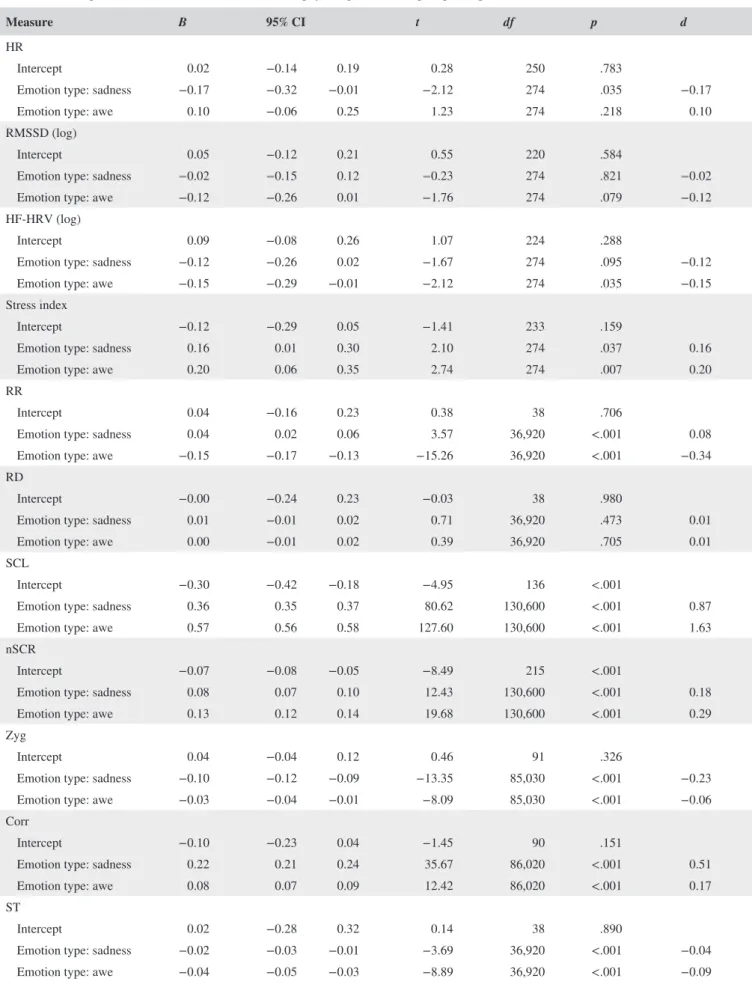
For HR, we found a main effect for emotion type, which was driven by the difference between kama muta and sad videos (Table 5). The kama muta videos elicited slightly more HR activity (M = 0.02, SE = 0.06) than sad videos did (M = −0.14, SE = 0.05), and lower HR than awe videos (M = 0.12,
SE = 0.06). However, HR during the kama muta videos only
differed significantly from the sad, and not from the awe vid-eos, thereby supporting both Hypothesis 4 and Hypothesis 5. For HRV we expected kama muta videos to induce more HRV than sad videos, while they should not differ from awe videos. Contrary to these Hypothesis 4 and Hypothesis 5, we observed no significant main effects of emotion type for RMSSD (Table 5). Descriptively, kama muta videos elicited the highest RMSSD response (M = 0.05, SE = 0.05), higher than both the sad (M = 0.03, SE = 0.05) and awe videos (M = −0.08, SE = 0.05). However, we found no significant effects for the two contrasts.
Similarly, we found no significant main effect for the HF-HRV measure (see Table 5). Measures were again high-est during exposure to the kama muta videos (M = 0.09,
SE = 0.06), compared to the awe (M = −0.06, SE = 0.05)
and sad videos (M = −0.03, SE = 0.04). Kama muta was significantly different from awe but not from sadness. The 12As before, we also ran more complex models that are documented only in
the Supplementary Material to ease interpretation of the main text. In a first model we also included video (−0.5 first, 0.5 s), country (if applicable; −0.5 Portugal, 0.5 Norway), and order (−0.5 first, 0 s, 0.5 third) as predictors. We also included the interaction between emotion type and order in all these models. In addition, we added time in seconds centered per individual video as a covariate and its interaction with emotion type. In the cardiac models, we added country as a factor and its interaction with emotion type. We observed similar main effects as reported in the main text when controlling for these additional predictors. While we observed several significant interactions effects, we did not find any systematic effects of these additional predictors and therefore excluded them for the sake of parsimony in the main manuscript. Results are presented in the Supporting Information (Tables S6 and S7; Figure S7).
FIGURE 2 Standardized scores (differences from baseline) for each physiological recording for the three emotion conditions: kama muta
versus sadness versus awe. Scores are unadjusted for time or other factors. Errors bars correspond to within standard errors calculated based on Morey (2008). (a) HR, heart rate; (b) RMSSD, root mean square of successive differences (log); (c) HF, high-frequency heart rate variability (log); (d) RR, respiration rate; (e) RD, respiratory depth; (f) SCL, skin conductance level; (g) nSCR, non-specific skin conductance responses; (h) Zyg, zygomaticus major; (i) Corr, corrugator supercilii; (j) ST, skin temperature; (k) Goose, goosebump activity; (l) Tears, Tearcam codings (no difference score)
TABLE 5 Separate multilevel models for the different physiological recordings depending on emotion condition
Measure B 95% CI t df p d
HR
Intercept 0.02 −0.14 0.19 0.28 250 .783
Emotion type: sadness −0.17 −0.32 −0.01 −2.12 274 .035 −0.17
Emotion type: awe 0.10 −0.06 0.25 1.23 274 .218 0.10
RMSSD (log)
Intercept 0.05 −0.12 0.21 0.55 220 .584
Emotion type: sadness −0.02 −0.15 0.12 −0.23 274 .821 −0.02
Emotion type: awe −0.12 −0.26 0.01 −1.76 274 .079 −0.12
HF-HRV (log)
Intercept 0.09 −0.08 0.26 1.07 224 .288
Emotion type: sadness −0.12 −0.26 0.02 −1.67 274 .095 −0.12
Emotion type: awe −0.15 −0.29 −0.01 −2.12 274 .035 −0.15
Stress index
Intercept −0.12 −0.29 0.05 −1.41 233 .159
Emotion type: sadness 0.16 0.01 0.30 2.10 274 .037 0.16
Emotion type: awe 0.20 0.06 0.35 2.74 274 .007 0.20
RR
Intercept 0.04 −0.16 0.23 0.38 38 .706
Emotion type: sadness 0.04 0.02 0.06 3.57 36,920 <.001 0.08 Emotion type: awe −0.15 −0.17 −0.13 −15.26 36,920 <.001 −0.34 RD
Intercept −0.00 −0.24 0.23 −0.03 38 .980
Emotion type: sadness 0.01 −0.01 0.02 0.71 36,920 .473 0.01
Emotion type: awe 0.00 −0.01 0.02 0.39 36,920 .705 0.01
SCL
Intercept −0.30 −0.42 −0.18 −4.95 136 <.001
Emotion type: sadness 0.36 0.35 0.37 80.62 130,600 <.001 0.87
Emotion type: awe 0.57 0.56 0.58 127.60 130,600 <.001 1.63
nSCR
Intercept −0.07 −0.08 −0.05 −8.49 215 <.001
Emotion type: sadness 0.08 0.07 0.10 12.43 130,600 <.001 0.18
Emotion type: awe 0.13 0.12 0.14 19.68 130,600 <.001 0.29
Zyg
Intercept 0.04 −0.04 0.12 0.46 91 .326
Emotion type: sadness −0.10 −0.12 −0.09 −13.35 85,030 <.001 −0.23 Emotion type: awe −0.03 −0.04 −0.01 −8.09 85,030 <.001 −0.06 Corr
Intercept −0.10 −0.23 0.04 −1.45 90 .151
Emotion type: sadness 0.22 0.21 0.24 35.67 86,020 <.001 0.51
Emotion type: awe 0.08 0.07 0.09 12.42 86,020 <.001 0.17
ST
Intercept 0.02 −0.28 0.32 0.14 38 .890
Emotion type: sadness −0.02 −0.03 −0.01 −3.69 36,920 <.001 −0.04 Emotion type: awe −0.04 −0.05 −0.03 −8.89 36,920 <.001 −0.09