1
Driving IT Projects to Success: Stakeholders’
Importance
Raquel Sofia Santos Ribeiro
An Artificial Neural Network model to demonstrate
the potential of using stakeholder characteristics in IT
projects’ success estimation
Dissertation presented as the partial requirement for
obtaining a Master's degree in Information Management,
Specialization in Information Systems and Technology
Management
2
NOVA Information Management School
Instituto Superior de Estatística e Gestão de Informação
Universidade Nova de Lisboa
DRIVING IT PROJECTS TO SUCCESS: STAKEHOLDERS’ IMPORTANCE
An Artificial Neural Network model to demonstrate the potential of using stakeholder
characteristics in IT projects’ success estimation
Raquel Sofia Santos Ribeiro
Dissertation presented as the partial requirement for obtaining a Master's degree in Information Management, Specialization in Information Systems and Technology Management
Advisors: Prof. Vitor Manuel Pereira Duarte dos Santos and Prof. João Eduardo Quintela Alves De
Sousa Varajão
3
ABSTRACT
Technology is all around, progressively present with each passing day. Companies recognize
the usefulness of technology in business, leading to a growing number of Information
Technology (IT) projects development.
Due to its increasing scope, IT projects are getting more and more complex and expectations
on their results are at an all-time high. At this rate, there is no telling where this complexity
will lead, nor if expectations can be met. The development of IT project, or projects of any
kind, is always met with unforeseen risks. Therefore, models that aim to estimate the
success of these projects have been emerging.
Some of these tools have fallen upon the bias of only taking into consideration a few project
management variables for forecasting success. This may lead to inaccurate estimations, from
the point-of-view of the several stakeholders.
Considering the intricacy of IT projects, and the several aspects that influence them,
advanced statistical models are required to give rich insight into projects’ outcome. On the
other hand, project success cannot be fully determined if the stakeholders’ points-of-view
are not taken into account. In other words, the success index of a project must be estimated
having stakeholders taken into consideration.
In order to support the mentioned concerns, a predictive model using Artificial Neural
Networks was developed. Projects and stakeholders characteristics are defined, along with
projects’ success criteria as inputs of the model, generating success indexes by budget, time
and scope performance, as well as an overall success index as outputs.
This dissertation adds to the current literature on the subject, by demonstrating the
importance of stakeholder characteristics in project estimation and paving a pathway for the
further exploration of the model developed. Thus making a first step into building a
prediction tool to help mitigate the current risks of IT projects and software development.
KEYWORDS
Project Management; Data Mining; Predictive Analysis; Artificial Intelligence; Artificial Neural
Networks; Forecasting IT Projects’ Success; Success Estimation; Stakeholders Importance
4
INDEX
1.
Introduction ... 6
1.1.
Context ... 6
1.2.
Motivation ... 6
1.3.
Objectives ... 7
2.
Literature review ... 9
2.1.
Project Management ... 9
2.2.
Predictive Analysis ... 12
2.2.1.
Concepts and Approaches ... 12
2.2.2.
Artificial Neural Networks ... 13
2.2.3.
ANN Models for Prediction ... 13
2.2.4.
Project’s Success Prediction with Artificial Intelligence ... 14
3.
Methodology ... 16
4.
Model Definition ... 18
4.1.
Assumptions ... 18
4.2.
Implementation ... 19
4.3.
Validation and Discussion ... 24
5.
Limitations and Recommendations for Future Works ... 26
5
LIST OF FIGURES
Figure 1 – DRS Process ... 16
Figure 2 – Initial Artificial Neural Network ... 20
Figure 3 – Data Mining Process ... 21
Figure 4 – Initial Predictive Model ... 22
Figure 5 – Variables worth for the overall success target variable ... 22
Figure 6 – First Artificial Neural Network ... 23
Figure 7 – Second Artificial Neural Network ... 23
Figure 8 – Reworked Predictive Model ... 24
Figure 9 – Final Predictive Model ... 24
LIST OF TABLES
Table 1 – Project Success Aspects ... 10
Table 2 – Performance assessment results, with and without K-means clustering ... 14
Table 3 – Model Variables ... 19
6
1. INTRODUCTION
In this chapter the context, motivation and objectives of this dissertation are presented.
1.1.
C
ONTEXTManaging projects has never been as easy task, however, it seems that nowadays it is
getting even harder. The outcome of a project is very contingent and open to a several
interpretations (Baccarini, 1996).
Information Technology (IT) projects, in particular, have many challenges that make them
especially hard to manage. For instance, it is estimated that half of the IT projects started fail
to meet the requirements (Varajão, Colomo-Palacios, & Silva, 2017).
There can be a great deal of reasons for project failure. Countless times the requirements
are unclear or bias, leading to different viewpoints on what are the needs of the company.
Project managers are pressured to accept these ambiguous requirements, because the time
is ticking and the developing teams need to work (Kerzner, 2009; Kerzner, 2013). Although
this is justified as a way to anticipate work, it will lead to more delays and costs (Varajão,
Colomo-Palacios, & Silva, 2017; Varajão, Dominguez, Ribeiro, & Paiva, 2014).
1.2.
M
OTIVATIONA Project Management survey of 2017 supports that only 31 percent of projects are
delivered on time, only 29 are within budget and that 67 do not meet the intended
objectives (KPMG, 2017). This is obviously very concerning, since projects represent a big
investment for most companies (Pinto, 1988).
The number of companies developing IT projects has been on the raise. There are, not only
more projects being developed, but also an increasing complexity (Kerzner, 2013; Saynisch,
2010). However, project management processes and tools have not been able to improve as
much as necessary to support this complexity (Mir & Pinnington, 2014).
There are several reasons why projects fail. One of the natural elements of any IT project is
change management, which is also a particularly hard subject within any company.
Companies want to make sure that the change they are targeting is worth the investment
before going forward with the initiative. As Hornstein (Hornstein, 2015) has mentioned, the
failure rate of change initiatives can be as high as 70%, mostly because these initiatives do
not fully meet the requirements.
Another reason for failure, and focus of this dissertation, is the lack of advanced success
prediction tools. These tools have not been able to keep up with the complexity of projects,
for instance, because they only consider a single point-of-view.
7
Most predicting models for project success only take into account budget, time, number of
people, and main objective of the projects (Martínez & Fernández-Rodríguez, 2015).
Resulting in a very limited prediction of the outcome of the projects.
There is a vast amount of aspects of a project that can be deemed important for the
prediction and evaluation of success. One of the most important is that different
stakeholders have different perspectives, being sometimes even opposing perspectives on
the project’s success (Davis, 2014).
Consequently, the success of an IT project has to take into account different stakeholders’
characteristics and stakeholders point-of-views, so that the accuracy can be improved. This is
something that has not been explored yet by success prediction models.
This dissertation proposes a model that takes into account the stakeholder perspectives for
projects’ success estimation. This helps managers and project owners understand the
success likelihood of their projects, overall and per how compliant the budget, time and
scope will be. Furthermore, it allows the evaluation of scenarios by changing the
characteristics of the project in order to understand what makes it more successful. For
instance, testing different team compositions, see the impact of having three developers
instead of two.
1.3. O
BJECTIVESThe purpose of this dissertation is to develop a model supported by an artificial intelligence
algorithm, which can be used to determine the importance of stakeholder characteristics for
estimation of success of IT projects. In order to fulfil this purpose, a main research question
must be answered: Are stakeholders’ characteristics significant for project success
estimation?
To estimate the success of the model, there are many variables that need to be defined.
Inputs such as the important characteristics of the projects and the stakeholders, the success
criteria of the projects and the weights of the stakeholder’s regarding each criterion.
Furthermore, it is necessary to determine if the stakeholder characteristics are valuable to
the project success estimation.
Although this may seem like a simple task, it is highly complex, given the fact that these
variables are not well defined and vary with each project. This leads to several supporting
questions:
1. What project’s characteristics are most important to determine project success?
This question is related with the first specific objective of the dissertation: determining IT
project’s main characteristics that influence success. These characteristics will be inputs of
8
the prediction model. Variables such as budget, schedule, and number of team members or
industry will be considered.
2. What stakeholder’s characteristics are most important to determine project success?
The stakeholder’s characteristics will also be a part of the inputs of the model. Defining the
type of characteristics for stakeholders is another objective. Along with those, come the
weights given to the success criteria of the projects. Which leads to the next question.
3. What are the project’s success criteria?
What makes a project successful or a failure? These are the model’s variables to determine
the success index per stakeholder and of the overall project. Determining the right success
criteria is critical to guarantee the most accurate prediction possible.
4. How can the model be validated?
Validation is an important objective, but it is also the hardest to accomplish. Gathering real
data can be a very hard task, especially regarding stakeholder’s weights of criteria.
Nevertheless, this validation will be sought-after.
9
2. LITERATURE REVIEW
This dissertation has two main areas involved, project management and predictive analysis.
The project management area is important for the problem definition, since it is its root, and
the predictive analysis its solution. Both subjects are addressed in this section.
2.1. P
ROJECTM
ANAGEMENTIn order to define project management, one must understand what a project is. A project is
a set of activities grouped to achieve a specific and unique result that must be performed in
a predetermined timeframe (PMI, 2018).
Project Management is described as “the application of knowledge, sills, tools, and
techniques to project activities to meet the project requirements” (PMI, 2018). For a while
now, success has mainly been associated with project management.
Companies have always been interested in knowing if their project will be successful or not,
because this kind of knowledge can help mitigate risks (Ika, 2009; Pinto, 1988) and even save
companies. However, success prediction has not been the most accurate, leading companies
to keep making the same mistakes (Kerzner, 2013).
Defining projects characteristics is a complex task, but a common concensus is that it will
always depend on its environment, including the company, industry and stakeholders
(Baccarini, 1996; Englund & Graham, 2019; Davis, 2014).
Characteristics such as the number of employes, the capital, number of countries in which it
operates and the headquarters location and industry are all important to define a project,
and are also all related to the company for which the project is being done (Varajão,
Colomo-Palacios, & Silva, 2017).
Focusing on the stakeholders, a more successful or experienced project manager has been
linked to a more successful project (Sumner, Bock, & Giamartino, 2006). This means that
having its characteristics as input to the estimation of project success could be very
important, the hypothesis which this dissertation aims towards determining.
Stakeholders are defined as any individual, group or organization that may be affected by a
project’s outcome or ongoing activities (PMI, 2018). There are several types of stakeholders
which may have different perceptions and viewpoints, leading to different definitions of
success of a project (Davis, 2014). Having said this, project success will always depend on the
eye of the beholder. In general terms, project success is defined by the level of
accomplishment of its objectives (Kerzner, 2009; Kerzner, 2013).
Every project has several, if not many, stakeholders, whose characteristics will most certainly
affect the project success. Furthermore, this translates into several points-of-view of the
10
success of a project, something that is very hard to estimate (Davis, 2014). Making it
necessary to define success criteria that can be mostly accepted by these different
stakeholders.
To estimate the success of any project, it is essential to determine what the most important
criteria for success definition is. These criteria will typically include the three points of
Atkinson’s triangle, “which is always used, regardless of the type or size of project; it
includes the criteria time compliance, budget compliance, and scope compliance” (Atkinson,
1999). Several other authors support the use of these criteria (Varajão, Dominguez, Ribeiro,
& Paiva, 2014; Varajão & Trigo, 2016; Atkinson, 1999; Abe, Mizuno, Kikuno, Kikuchi, &
Hirayama, 2006). However, those cannot be the only success determinants; compliance with
the business goals set for the project, compliance with the client's business objectives or
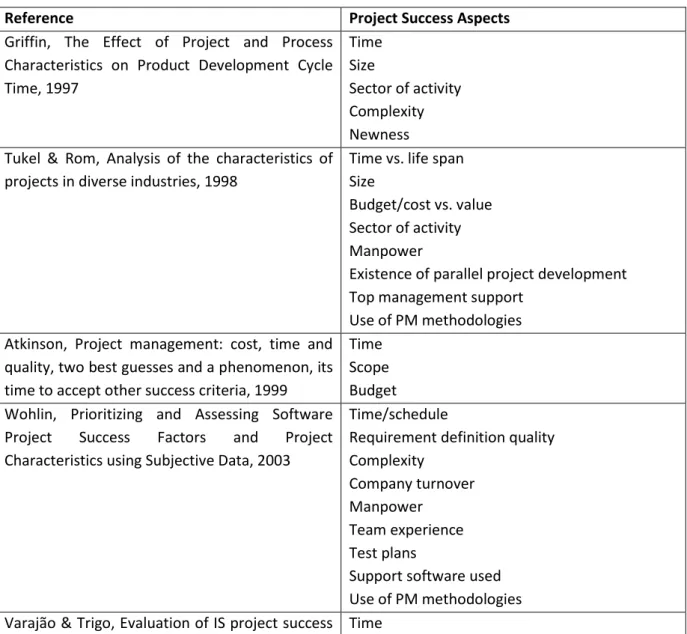
user satisfaction, for instance, are just as important (Varajão & Trigo, 2016). Table 1
– Projectincludes some of the criteria mentioned in the literature.
Table 1 – Project Success Aspects
Reference Project Success Aspects
Griffin, The Effect of Project and Process Characteristics on Product Development Cycle Time, 1997 Time Size Sector of activity Complexity Newness Tukel & Rom, Analysis of the characteristics of
projects in diverse industries, 1998
Time vs. life span Size
Budget/cost vs. value Sector of activity Manpower
Existence of parallel project development Top management support
Use of PM methodologies Atkinson, Project management: cost, time and
quality, two best guesses and a phenomenon, its time to accept other success criteria, 1999
Time Scope Budget Wohlin, Prioritizing and Assessing Software
Project Success Factors and Project Characteristics using Subjective Data, 2003
Time/schedule
Requirement definition quality Complexity
Company turnover Manpower
Team experience Test plans
Support software used Use of PM methodologies Varajão & Trigo, Evaluation of IS project success Time
11 in InfSysMakers: an exploratory case study, 2016 Scope
Budget
Sector of activity
Compliance with business goals Compliance with clients’ objectives Stakeholders satisfaction
Intangible benefits Project recognition KPIs definition Value creation Locatelli, Invernizzi, & Brookes, Project
characteristics and performance in Europe: An empirical analysis for large transport infrastructure projects, 2017
Scope Environment Sector of activity
External and internal stakeholders Foreigner language use
Newness Varajão, Colomo-Palacios, & Silva, ISO
21500:2012 and PMBoK 5 processes in information systems project management, 2017
Time Scope Budget Sector of activity Number of employees Company turnover Headquarter location
Number of countries in which the company is present
Certifications
Team and Project Manager
experience/education Development type Use of PM methodologies Maturity model use Hughes, Rana, & Dwivedi, Elucidation of IS
project success factors: an interpretive structural modelling approach, 2019
Scope
Requirement definition quality User involvement
Top management support Team experience
Use of PM methodologies Maturity model use Audit process
Support software type
Interestingly, project newness, or being the fact that is one of its kind, was mentioned as
early as Griffin in 1997. This is curious since it is a very interesting variable for project
12
software, which the less original it is, the more can be reused (Griffin, 1997; Locatelli,
Invernizzi, & Brookes, 2017). That concept is similar to the type of implementation cited by
Varajão also in 2017, which relates to whether the technology implemented is packaged,
custom, a mix or maintenance (Varajão, Colomo-Palacios, & Silva, 2017).
Another point evidenced by Table 1
– Projectis the importance of the use of methodologies
for project management, as several authors mention its importance. This could come from
the changes in paradigm in project development and the increasingly use of agile
methodologies (Coram & Bohner, 2005).
Project profiling is “the process of extracting a characterization from the known attributes of
a project” (Cox, 2009). Therefore, profiling a project provides a baseline of characteristics
that simplify the comparison between projects. One of the characteristics that classifies a
project, is its output. In this dissertation, IT projects, as previously mentioned, are the focus.
An IT project is a project whose output is an Information Technology solution.
2.2. P
REDICTIVEA
NALYSISPredictive Analysis is defined as “the use of data, statistical algorithms and machine learning
techniques to identify the likelihood of future outcomes based on historical data. The goal is
to go beyond knowing what has happened to providing a best assessment of what will
happen in the future” (SAS, 2018).
2.2.1. Concepts and Approaches
Predictive analysis is a subfield of data mining, which is described as “discovery of interesting, unexpected or valuable structures in large datasets” (Hand, 2007). With the move towards the Information Age, data mining becames more relevant each day. There are new sets of seemingly infinite data created each second (Han, Kamber, & Pei, 2012).
In association with data mining came the term Artificial Intelligence (AI), the simulated intelligence in machines. Surronded by some contorversy, due to the question of whether or not a machine thinks (Nilsson, 1998), artificial intelligence still made-its way to our day-to-day lives, being at the tip of our fingertips with personal assistances like Siri, Cortana or Alexa. These personal assistantes are data mining machines with artificial intelligence that aim to serve people, while saving data on its user and learning patters, basically simulating intelligence, in order to improve the users’ experience.
There are two types of learning in these data mining systems: supervised learning and unsupervised learning. Put simply, supervised learning requires an historical dataset that has the output of the predictive analysis model; the model makes the prediction and checks the real result in order to learn. Unsupervised learning does not require an historical dataset; instead, it gathers the data according to their patters, building clusters (Turner & Charniak, 2005). The personal assistants use unsupervised learning, by assessing the data they collect to independent conclusions, and take action based on that reasoning (Maedche, Legner, Benlian, Berger, Gimpel, Hess, Hinz, Morana & Söllner 2019).
13 These assistants use machine learning systems, one of the approaches of predictive analysis. Machine learning is used to extract information from a dataset. It identifies patterns and makes associations, learning from the data that is observing and taking conclusions that can be used to evaluate other datasets (SAS, 2018; Witten, Frank, Hall, & Pal, 2017). One of the most used machine learning models are Artificial Neural Networks, which are generally defined as being “biologically inspired computer programs designed to simulate the way in which the human brain processes information” (Agatonovic-Kustrin & Beresford, 2000).
The other approach to predictive analysis is the statistical approach. Here, the most commonly used algorithm is the Linear Regression, which basically averages the results or points in a plot and creates a line that represents all those points to the best of its ability (Montgomery, Peck, & Vining, 2012). This approach is great for classical problems related with data classification (Martínez & Fernández-Rodríguez, 2015).
2.2.2. Artificial Neural Networks
Similarly to the human brain, Artificial Neural Networks (ANN) are composed by hundreds of nodes that act as neurons. These nodes detect patters in data, building a decision formula on how the data behaves (Agatonovic-Kustrin & Beresford, 2000; Hassoun, 1995). For instance, this means that, with an input of customer sale data, the ANN can output whether or not they will respond well to a campaign. However, before being able to make said predictions, it needs to learn from historical data (e.g.: a previous campaign).
There are several types of ANN, such as pattern recognitions, competitive neural networks, associative or feedforward. Pattern recognition neural networks, as its name suggests, identify patterns in data and should only be used for a simple decision making strategy (Werbos, 1991). Competitive neural networks are characterized by having nodes compete against each other for the data, becoming well-suited for clustering, where the winner earns the right to have the data in its cluster (Rumelhart, Zipser, & McClelland, 1986).
As for associative neural networks, these use short-term and long-term memory concepts in order to avoid data overfitting. They take the inputted data, and use the short-term memory to analyze it without any knowledge of what the output must be, so as to not have a biased opinion on where that data belogs. Only after this initial analysis, does the model compare the short-term memory patterns to the long-term memory patterns, and learns from this comparison (Miller, Glanz, & Kraft, 1990).
Lastly, feedforward neural networks are characterized by being anti-cycles, meaning that once inout, the data goes throught a line of neurons, without going back (Montana & Davis, 1989); it is like a computational switch, where it checks conditions, enters that conditions, and goes forward to another switch.
2.2.3. ANN Models for Prediction
Two important ANN models for prediction are the backpropagation and the multilayer perceptron, both of which are feedforward neural networks. Feedforward neural networks became popular due to its generalizing and accuracy abilities (Montana & Davis, 1989).
14 The backpropagation model evaluates which function best maps the input to its output, storing its errors and feeding them through its layers in order to learn from them and tune its weights (Rumelhart, Hilton, & Williams, 1985). Because it “can often find a good set of weights (and biases) in a reasonable amount of tune” (Montana & Davis, 1989). The multilayer perceptron has three types of node layers, the input, hidden and output layer and it uses backpropagation for training (Rumelhart, Hilton, & Williams, 1985); however, it may have several hidden layers that work to determine the best activation functions. These model has become very useful, because it is capable to analyze complex sets of data and approximate solutions to very complex problems (Thota & Changalasetty, 2013).
2.2.4. Project’s Success Prediction with Artificial Intelligence
Project’s success prediction is not new; it has been a necessity for a very long time, but the proposal of Artificial Intelligence models of prediction is relatively recent, with the first reference found in 2006 (Abe, Mizuno, Kikuno, Kikuchi, & Hirayama, 2006).
This first model applies a Bayesian classifier to different metrics of a project. This model is built to be used in the early stages of a project of any industry, and considers a project successful if it was developed within the schedule, within the budget and with a satisfactory quality.
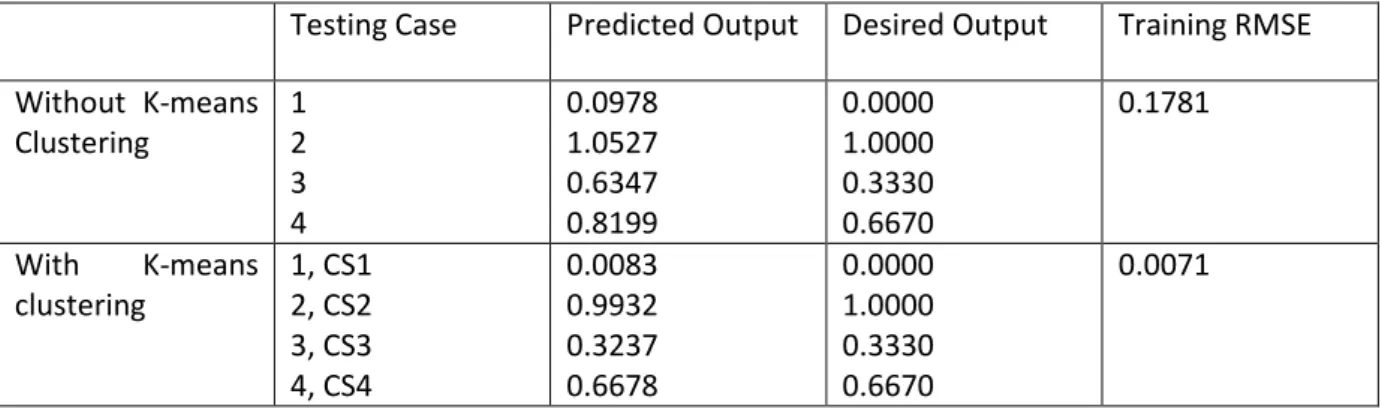
Focusing on the construction industry, there have been a several models developed throughout the years. These prediction models proved themselves very important across industries, because they include the most accurate prediction model to this day (see Table 2 – Performance assessment results, with and without K-means clustering
Source: (Cheng, Wu, & Wu, 2010)), a 2010 model by Min-Yuan Cheng. This model combined the use of a Support Vector Machine algorithm with a Fast Messy Genetic Algorithm (Cheng, Wu, & Wu, 2010).
Table 2 – Performance assessment results, with and without K-means clustering Source: (Cheng, Wu, & Wu, 2010)
Testing Case Predicted Output Desired Output Training RMSE Without K-means Clustering 1 2 3 4 0.0978 1.0527 0.6347 0.8199 0.0000 1.0000 0.3330 0.6670 0.1781 With K-means clustering 1, CS1 2, CS2 3, CS3 4, CS4 0.0083 0.9932 0.3237 0.6678 0.0000 1.0000 0.3330 0.6670 0.0071
Cheng was also the author of two other construction models, his first in 2007, which introduced the use of specific industry variables, such project safety and other subjective criteria, and developed the model with genetic algorithms, fuzzy logic and neural networks (Ko & Cheng, 2007). His model from 2012, uses a fuzzy hybrid neural network to dynamically identify the critical success factors of the project and determine its success (Cheng, Tsai, & Sudjono, 2012).
15 The takeaway from the analysis of the existing models is that they use the critical success factors of projects to determine the likelihood of success of the project. Neural networks, fuzzy cognitive maps, genetic algorithms, and Bayesian models are used in order to accomplish this. However, not one of these models applies specifically to Information Technology projects, nor takes into account the different perspectives of the stakeholders.
16
3. METHODOLOGY
While this dissertation focusses on building a predictive model supported by an artificial
intelligence algorithm for IT projects’ success forecasting, its scientific paradigm follows a
qualitative approach, rather than a quantitative one.
The methodology that serves as support to this study is Design Science Research (DSR). This
methodology is frequently used in the Information Systems fields, since it focusses on
solving problems, rather than just explaining their existence (Hevner, March, Park, & Ram,
2004; Peffers, Tuunanen, Rothenberger, & Chatterjee, 2007).
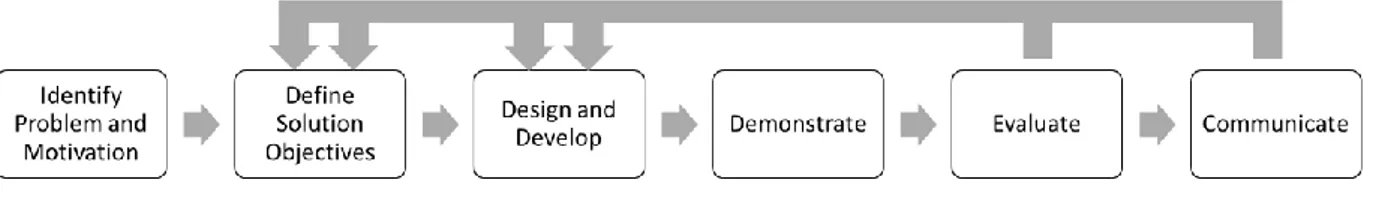
DSR has a cyclic process of investigation, as seen in Figure 1
– DRS ProcessAdapted from: Peffers, Tuunanen, Rothenberger, & Chatterjee, 2007
. The point of this methodology is
to design science, by searching for problem resolution in a more effective way. And design
research, by building the output of the extensive design science process. In this sense, design
research is the answer to the design science process.
Figure 1 – DRS Process
Adapted from: Peffers, Tuunanen, Rothenberger, & Chatterjee, 2007
The DSR process has seven main stages. Starting with the problem identification and
motivation. Identifying a problem and finding the motivation to solve it, cannot be a straight
forward process, it requires in depth investigation about the topic. This allows for, not only a
better understanding of the field, but a closer look into what has already been suggested
and experimented as solution. Finding the reason why a previous solution came short, could
be the first step into design a better on, which leads into the defining of solution objectives
phase.
At the second stage, the objectives of the solution, as well as the solution artifacts, need to
be made clear. A problem always has different sides and approaches to it, which is why a
clear identification is important. Certain field are so extensive, that trying to find a way to
solve a less specific problem, leads to lack-lustering results.
With the clear vision of the problem in mind, the design and development of the solution
artifacts can begin. This stage, although it can take up a lot of time and effort to perfect, if in
the previous stages the work done was solid enough, it should also be the most direct.
17
Having the solution in hand, it is time to demonstrate its worth, evaluate it as a solution to
the problem identified, and communicate that solution.
Furthermore, as with every field of investigation, the job is never really done. The point of an
article or dissertation is not to close a subject, but rather to add to it. That being said, when
adding to certain topic, there will always be further work to be conducted. DSR embraces
this by going back to the definition and design steps of investigation, after the evaluation
and communication. This can happen for several reasons; maybe the evaluation process let
to the identification of a blind spot in the objectives, maybe the communication brought
valuable feedback that can improve the solution, or maybe the resources just were not
enough. The importance of having this as cycle, is that the researchers are able to take this
input and add to it.
In the specific case of this dissertation, the problem identification phase consisted in
studying the two main areas related to this topic, project management and predictive
analysis. From an early stage, it was possible to read about predictive models and the
algorithms used for the success estimation and identify the main motivation: lack of
stakeholder representativeness in the models. Which made clear the need for a predictive
model that has stakeholders’ characteristics as input. However, the algorithm for estimation
need to be selected. Given neural network capabilities and how artificial intelligence is
affecting the technological field, a predictive model based on neural networks became the
artifact of the solution.
The development and evaluation process, set by the nature of predictive models, comes
hand-in-hand. As a neural network trains, it evaluates itself and builds knowledge on the
data in analysis. Which does not mean there are any less iteration to the model, because the
neural networks’ configuration leads to different results. This stage will require a lot of
experimenting in order to find the best configuration to the algorithms, without over-fitting
the model to the dataset.
Lastly, because the purpose of the model is to serve companies and managers in their quest
to estimate and maximize project’s success, it must be able to address
management-oriented audiences and be published to communicate the solution.
18
4. MODEL DEFINITION
In order to define the model, it is necessary to expose the assumptions taken into
consideration for its development, connecting the literature review to the model design,
including the variable definition and outputs. After that, comes the implementation, where
each variable will be described and the model implementation will be detailed according to
the data mining process. Lastly, comes the model validation and expose of results, where the
validation process is described and the results are interpreted.
4.1. A
SSUMPTIONSAs shown by the literature review, there are different ways to define the main characteristics of a project, however, even though it is difficult to have a total common understanding about an exact set of characteristic, the time, budget and scope, type of development and technology implemented are supported by many authors (Atkinson, 1999; Varajão, Colomo-Palacios, & Silva, 2017).
The type of implementation and the technology implemented are part of the scope of the project. These variables have been selected since they are specific to information technology project, the focus of this dissertation. Their inclusion provides valuable input into the type of information system is being implemented and how it is being implemented. The “how” relates to the project newness, that has been discussed. The more custom an implementation is, the riskier the project. For instance, implementing a packaged SAP module in a company with no customization has little risk, since SAP is a major company with upgrades and customer support, which will be able to solve standard issues rapidly. However, implementing a SAP module in a company with customization, requires more time and can lead to severer support cases, since the customization is individual to each company. Furthermore, implementing a completely new software built for a specific company, although it can go very well and be absolutely in sync with the requirements, takes more time and can lead to serious problems, since there is no standard to deal with these issues, many times.
Regarding the company in which the project is being implemented, the commonly agreed upon characteristics to look towards are its sector of activity, capital, number of employees, headquarters location, if it has international presence and number of countries in which it acts (Varajão, Colomo-Palacios, & Silva, 2017; Hughes, Rana, & Dwivedi, 2019).
Implementing the same exact technology, the same exact way, with the same exact team, in different companies will always have different outcomes. That goes back to the stakeholder perception of success, discussed in the literature review. Which is why profiling the company is such a big part of the variables included in the model.
Last to the input variables, project managers (PM) are considered one of the most important stakeholders to analyze, since their years of experience as such, the number of projects managed, as well as their age and academic background, can be very useful success criteria (Varajão, Colomo-Palacios, & Silva, 2017). The reason why it is so useful stands on why so many projects fail: poor project management (Varajão, Dominguez, Ribeiro, & Paiva, 2014). Having an experienced project manager can alleviate the most common issues that rise during the implementation of IT projects.
19 Furthermore, the output variables need to be defined. In this case, Atkinson’s triangle (Atkinson, 1999) is the most viable approach. Time, budget and scope performance will be the output of the model, along with an overall success rating. This output will not only give a success estimation, but a discriminated success estimation, by time, cost and scope performance.
4.2. I
MPLEMENTATIONBased upon the research and assumptions, the model implementation will contain the following variables:
Table 3 – Model Variables
Name Description Data Type Role
Duration Duration of the project Interval Input
Budget Project budget Interval Input
DevType Type of implementation/development, related with how custom or packaged it is
Nominal Input
ImplementedTech Type of technology implemented Nominal Input
Industry Sector of activity of the company in which the project is being implemented
Nominal Input
Capital Capital of the company Interval Input
NrEmployees Number of employees of the company Interval Input
HQLoc Company headquarters location (Europe, North America or other)
Nominal Input
InternationalPresence Whether or not the company has international presence
Binary Input
NrCountries The number of countries in which the company is present
Interval Input
UsedMethodology Whether or not the project as implemented using a project management methodology
Binary Input
PMAcademic Academic degree of the project manager Nominal Input
PMAge Project manager’s age Interval Input
NrProjAsPM Number of projects manager by the project manager Interval Input YearsExpAsPM Project manager’s years of experience as project
manager
Interval Input
TimePerformance How compliant the project was time-wise (values 1 to 3)
Ordinal Target
CostPerformance How compliant the project was cost-wise (values 1 to 3)
Ordinal Target
ScopePerformance How compliant the project was scope-wise (values 1 to 3)
Ordinal Target
OverallSuccess The overall estimated success of the project (varying between 1 and 10)
20 Once the variables have been selected, a dataset was needed. Fortunately, the University of Minho was able to share a dataset that, through little to no transformation, had the necessary variables. This dataset originated from an online survey done on about 500 project managers. Out of the close to 500 responses, 435 were of good quality, since all responses with missing values were eliminated. By doing so, the need for further data preparation was mitigated, however, 435 records is a very limited number of records, it would not allow for a proper classification. Using the Statistical Package for the Social Sciences (SPSS), the dataset was extended to 7500 records, while keeping the same statistical properties, such as mean, average and standard deviation.
Assuming the usage of Artificial Neural Networks, as seen in the literature review, although there were two types of ANN models mentioned for prediction, the backpropagation and the multilayer perceptron, using a multilayer perceptron model is the best option. Multilayer perceptron models are capable of analyzing very complex datasets and have a better performance in the estimation of complex problems such as projects success forecasting (Miller, Glanz, & Kraft, 1990; Montana & Davis, 1989).
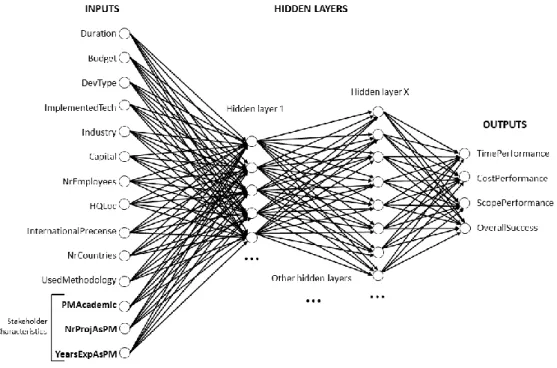
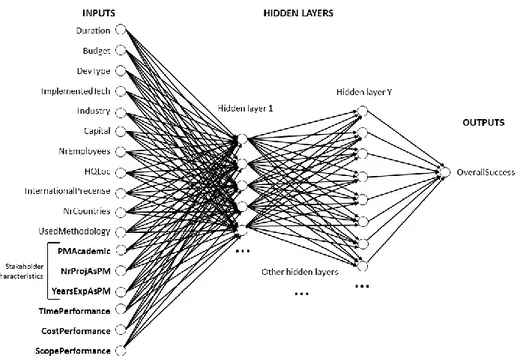
The visual representation of the neural network implemented, should be close to this:
Figure 2 – Initial Artificial Neural Network
As evidenced by Figure 2 – Initial Artificial Neural Network, neural networks have three major components, input layer, hidden layer and output layer. The first layer receives the input to the neural, the other two classify the characteristics. The complexity of the neural networks derivers from the number of hidden layers, the more hidden layers the neural network has, the more complex the algorithm becomes, increasing the likelihood of over-fitting the model.
The first hidden layer will try to divide the projects into classes, using a function. Because this is a complex problem, one function will fail to map all the projects into a class. The second hidden layer adds another function that, combined with the first one, better classifies the classes of the projects.
21 And so on. The next hidden layer is learning from the previous and applying functions to classify the project. Then, this feedback is given to the output layer that uses the functions to convert the estimation into the desired output format.
Furthermore, using the tools available today, instead of having a feed-forward model that goes through each hidden layer and outputs the result, it is possible to build an artificial neural network easily that has a recurrent behavior and learns not only from each layer, but from each iteration of the neural network.
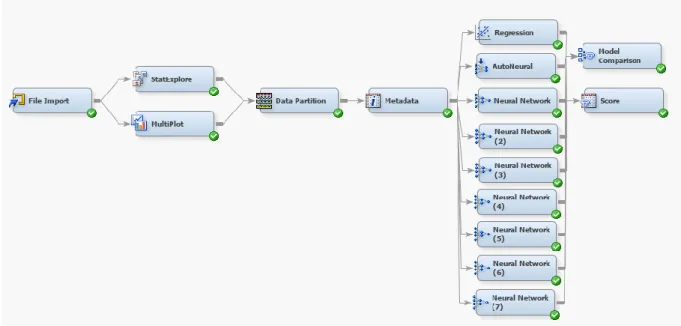
One tool that allows that is SAS Miner. SAS Miner builds of a solid predictive model with very low coding and configuring, using its nodes. These nodes are the pre-coded statistical elements that the software provides. This means that in order to build a very simple predictive model with SAS Miner, the only necessary steps would be to drag the File Import node, to import the dataset, and then drag the model node, which could be a regression, a neural network, or other available statistical models. All that is left is to run the nodes and check the results.
However, the model to determine the stakeholder characteristics importance, is not a simple predictive model. In order to start implementing the model, SAS Miner will be used following the Data Mining Process, which is represented as follows:
Figure 3 – Data Mining Process Adapted from: Hand, 2007
The three first steps in the data mining process regards the collection, understanding and preparation of data, which has partially been done outside of SAS Miner. These three steps are essential because real-world data has issues that influence (highly) the models, hence why missing or inconsistent records needed to be removed from consideration (Hand, 2007). As for data exploration, the software has several nodes that output the characteristics of the data set, such as StatExplore and MultiPlot. These will give a better idea on what variables are worth the most to the classification process.
The three last steps refer to the actual modelling process. It is important to use nodes such as Model Comparison to assess and monitor the performance of each model, since reaching an optimal model will require several iterations. It can also be beneficial to compare the results between different types of models, using a regression as baseline.
The Regression node performs a logistic regression (used to describe data and to explain the relationship between a dependent binary variable and other independent variables). Regression’s complexity derives from the number of input variables. The number of variables in the dataset was relatively small, which would give the Regression an opportunity to serve as the base model to compare against the performance of the several neural networks.
22 Several neural networks will be used, so that different hidden layers can be tested. These hidden layers will range between 1 and 12, in order to test their performance while mitigating over-fitting. With these notes in mind, this was the initial draft of the predictive model in SAS Miner:
Figure 4 – Initial Predictive Model
This initial draft allowed a more in depth look into the dataset. From the StatExplore node, that as mentioned basically extracts the statistical properties of the variables, their worth can be examined:
Figure 5 – Variables worth for the overall success target variable
As illustrated in Figure 5, after the industry, which is the variable with most worth for the overall success target variable, the number of projects as project manager and the years of experience are the variables with most worth. This evidences that the stakeholders need to be taken into account when forecasting the outcome of a project.
The results at this stage were very unsatisfying. The model required more iterations to perfect its prediction capabilities. It became clear that it was necessary to combine two different neural
23 networks, one would target the duration, budget and scope performance, the other would target the overall success having those as inputs.
Therefore, the first neural network diagram would become, as in Figure 6 – First Artificial Neural Network.
Figure 6 – First Artificial Neural Network
As seen in Figure 6 – First Artificial Neural Network, the OverallSuccess output has been removed and these outputs will then serve as input to the second neural network (Figure 7 – Second Artificial Neural Network).
24 From there, a second installment of the model (Figure 8 – Reworked Predictive Model) came to light.
Figure 8 – Reworked Predictive Model
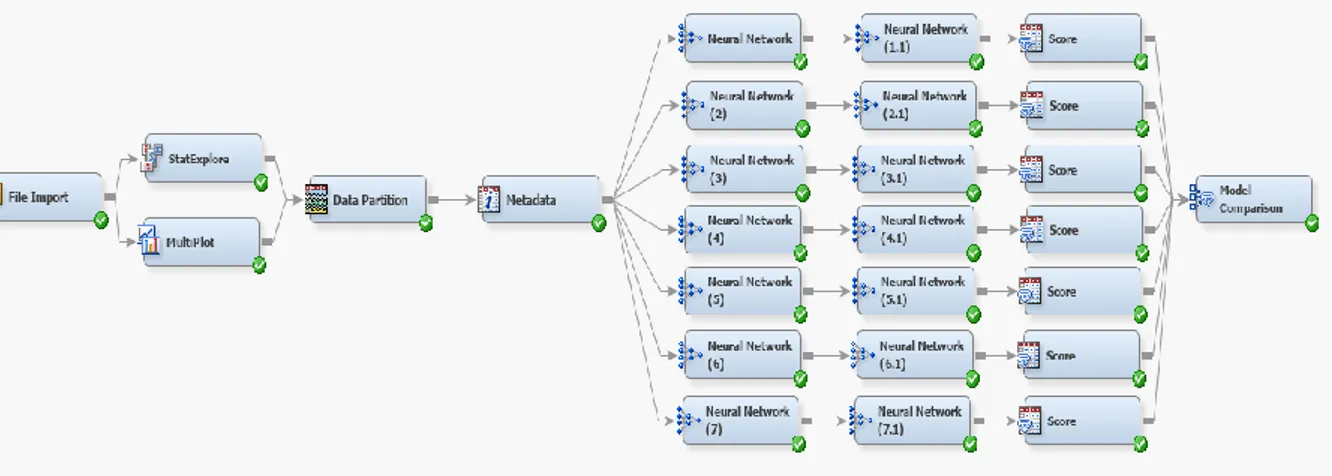
With each iteration of the model, different hidden layers were tested, until a satisfying accuracy was reached. Yet, never forgetting to check for and mitigate over-fitting the model to the dataset. The final installment of the model is presented in Figure 9.
Figure 9 – Final Predictive Model
With the first neural network at 11 hidden layers and the second with 8, the best results were obtained. Although it was not the combination with the most accuracy, it was the model with the most realistic output, since the better ones hinted at over-fitted models.
4.3. V
ALIDATION ANDD
ISCUSSIONMachine learning algorithms learn by comparison: they analyze data, make some conclusions and then look at new data to validate those conclusions. Having validation data helps avoid over-fitted models.
Contrarily to other types of investigation, the mechanism of statistics used for the modal implementation has its own validation node. The data partition node allows for a distribution of the inputted dataset, and it was configured to have 70% of the data for training the model, 10% for validation and 20% for test. The training data will be used by the predictive model to train the neural networks, the validation data within the training stages of the algorithm to make sure it is analyzing patterns in the correct way. Simply put, the neural network will run, validate itself, check if it made
25 good predictions, and rerun. At the end of its iterations, the testing data will be used to evaluate the prediction capabilities of the neural network.
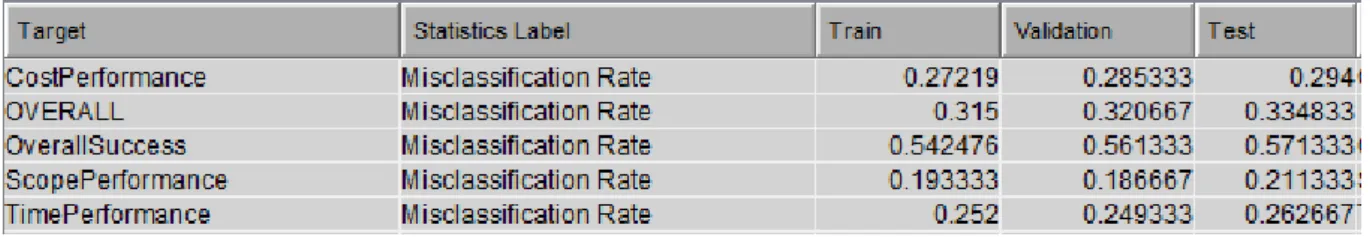
Neural networks performance is best evaluated though the Misclassification Rate, that is the rate of records wrongly estimated when compared to the test data. The obtained results are presented in
Table 4.
Table 4 – Model Misclassification Rate
The overall misclassification rate of the model is 33.5%, meaning that the model has about 66.5% accuracy estimating project success. This accuracy rating is brought down by the overall success target variable. This variable is especially tricky to estimate, since it is an ordinal variable ranging between 1 and 10, and the survey responses have varying values for the same project performance. Specifically: having time, cost and budget performance at level 3, but an overall success at 9 for one project manager and having the same performance with the overall success level at 10 for another project manager.
Even though the overall accuracy is 66.5%, the accuracy for time, cost and scope performances are 73.7%, 70.6% and 78.9%, respectively. Given the unpredictable nature of projects (Varajão, Dominguez, Ribeiro, & Paiva, 2014), having an accuracy of even 66.5%, is very significant.
Something that must be taken into consideration is the worth of the project manager characteristics for this estimation. The other available estimation models, do not take into consideration stakeholders, therefore, the level of confidence for estimation is significantly lower than for this model.
26
5. LIMITATIONS AND RECOMMENDATIONS FOR FUTURE WORKS
Estimating project success can be very tricky. There are a lot of variables to take into consideration, regarding the project itself and its stakeholders. Given the accuracy obtained and the variables’ worth to the proposed model, it is safe to say that the initial objectives of this dissertation have been met and that the initial statement, that stakeholder characteristic affect the project success estimation, has supportive evidence.
Regarding question number 1, what project’s characteristics are important to determine project success? It was found that the most important characteristics related to the company and the stakeholders. The duration is a variable of the project that has the most relevance, followed by the implemented technology.
Following up on the stakeholders, what stakeholders’ characteristics are most important to determine project success? The project manager’s years of experience as such and the number of projects as project manager were the second and third most important variable to the model. It is relevant to state that this supports the initial hypothesis that existing models left out a hugely important part of project profiling.
A limitation that rises with this question was only taking into consideration the project manager as a stakeholder. Ideally, other stakeholders should be taken into consideration, along with the company characteristics. Variables such as user expertise, client involvement and top management engagement could be of value. It is recommended that in future work new data is found and these and more variables are added to the model, so that it can be further trained.
Concerning question 3, what are the project’s success criteria? Atkinson’s triangle summarizes it best. The time, cost and scope compliance are the most important criteria to take into consideration for project success estimation (Atkinson, 1999). When developing on this work, an overall success could be extrapulated from the time, cost and scope performance, increasing the model accuracy. Furthermore, adding variables to the model should be considered, for instance, customer satisfaction.
As for the main research question: Are stakeholders’ characteristics significant for project success estimation? Using a neural network, it was built a modal that can take into account projects’ and stakeholders’ characteristics and estimate with an accuracy of 66.5% their time, budget and scope performance, as well as their overall success. The most valuable variables to the model were the project manager characteristics, leading to the conclusion that stakeholders characteristics are very influential in the project success estimation processed, as this dissertation aimed to determine. Lastly, the model was validaded by the dataset that University of Minho was able to share. Although it could not have been done in this dissertation, due to lack of time, building upon this dataset can be useful. One big limitation was the number of records, which unfortunetly does not meet neural network requirements, meaning that the dataset had to be expanded with unreal records, that kept the statistical properties.
27 To concluded, although this model had a satisfaying output, supporting the hypothesis that stakeholder characteristics affect greatly the project success estimation, there is still work to do. This is a contribution to the current literature that should be built upon, as the methodology suggests. After communicating the solution, the feedback should generate process iterations for objective definition and further development.
28
REFERENCES
Abe, S., Mizuno, O., Kikuno, T., Kikuchi, N., & Hirayama, M. (2006, May). Estimation of project success using Bayesian classifier. In Proceedings of the 28th international conference on Software
engineering (pp. 600-603).
Agatonovic-Kustrin, S., & Beresford, R. (2000). Basic concepts of artificial neural network (ANN) modeling and its application in pharmaceutical research. Journal of Pharmaceutical and Biomedical Analysis, 22(5), 717-727.
Atkinson, R. (1999). Project management: cost, time and quality, two best guesses and a phenomenon, its time to accept other success criteria. International journal of project management, 17(6), 337-342.
Baccarini, D. (1996). The concept of project complexity—a review. International journal of project management, 14(4), 201-204.
Basheer, I. A., & Hajmeer, M. (2000). Artificial neural networks: fundamentals, computing, design, and application. Journal of microbiological methods, 43(1), 3-31.
Cheng, M. Y., Tsai, H. C., & Sudjono, E. (2012). Evolutionary fuzzy hybrid neural network for dynamic project success assessment in construction industry. Automation in Construction, 21, 46-51. Cheng, M. Y., Wu, Y. W., & Wu, C. F. (2010). Project success prediction using an evolutionary support
vector machine inference model. Automation in Construction, 19(3), 302-307.
Coram, M., & Bohner, S. (2005, April). The impact of agile methods on software project management. In 12th IEEE International Conference and Workshops on the Engineering of Computer-Based Systems (ECBS'05) (pp. 363-370). IEEE.
Cox, M. C. D. M. (2009). Project management skills for instructional designers: A practical guide. iUniverse.Dao, B., Kermanshachi, S., Shane, J., Anderson, S., & Hare, E. (2016). Identifying and Measuring Project Complexity. Procedia Engineering, 476-482.
Davis, K. (2014). Different stakeholder groups and their perceptions of project success. International journal of project management, 32(2), 189-201.
Englund, R., & Graham, R. J. (2019). Creating an environment for successful projects. Berrett-Koehler Publishers.
Griffin, A. (1997). The effect of project and process characteristics on product development cycle time. Journal of Marketing Research, 34(1), 24-35.
Han, J., & Kambel, M. (2012). Data Mining: Concepts and Techniques, Mor. Hand, D. J. (2007). Principles of data mining. Drug safety, 30(7), 621-622. Hassoun, M. H. (1995). Fundamentals of artificial neural networks. MIT press.
29
Hevner, A. R., March, S. T., Park, J., & Ram, S. (2004). Design science in information systems research. MIS quarterly, 75-105.
Hornstein, H. A. (2015). The integration of project management and organizational change management is now a necessity. International Journal of Project Management, 33(2), 291-298.
Hughes, D. L., Rana, N. P., & Dwivedi, Y. K. (2020). Elucidation of IS project success factors: an interpretive structural modelling approach. Annals of Operations Research, 285(1), 35-66. Ika, L. A. (2009). Project success as a topic in project management journals. Project management
journal, 40(4), 6-19.
Kerzner, H. (2017). Project management: a systems approach to planning, scheduling, and controlling. John Wiley & Sons.
Kerzner, H. (2013). The Future of Project Management By The Importance of Recognizing Change. 1-127.
Ko, C. H., & Cheng, M. Y. (2007). Dynamic prediction of project success using artificial intelligence. Journal of construction engineering and management, 133(4), 316-324.
KPMG. (2017). Driving business performance: Project Management Survey. New Zealand: KPMG. Locatelli, G., Invernizzi, D. C., & Brookes, N. J. (2017). Project characteristics and performance in
Europe: An empirical analysis for large transport infrastructure projects. Transportation research part A: policy and practice, 98, 108-122.
Maedche, A., Legner, C., Benlian, A., Berger, B., Gimpel, H., Hess, T., Hinz, O., Morana, S. & Söllner, M. (2019). AI-Based Digital Assistants. Business & Information Systems Engineering, 61(4), 535-544.
Martínez, D. M., & Fernández-Rodríguez, J. C. (2015). Artificial Intelligence applied to project success: a literature review. IJIMAI, 3(5), 77-84.
Miller, W. T., Glanz, F. H., & Kraft, L. G. (1990). Cmas: An associative neural network alternative to backpropagation. Proceedings of the IEEE, 78(10), 1561-1567.
Mir, F. A., & Pinnington, A. H. (2014). Exploring the value of project management: linking project management performance and project success. International journal of project management, 32(2), 202-217.
Montana, D. J., & Davis, L. (1989, August). Training Feedforward Neural Networks Using Genetic Algorithms. In IJCAI (Vol. 89, pp. 762-767).
Montgomery, D. C., Peck, E. A., & Vining, G. G. (2012). Introduction to linear regression analysis (Vol. 821). John Wiley & Sons.
30
Peffers, K., Tuunanen, T., Rothenberger, M. A., & Chatterjee, S. (2007). A design science research methodology for information systems research. Journal of management information systems, 24(3), 45-77.
Pinto, J. K., & Slevin, D. P. (1988). Project success: definitions and measurement techniques. Project Management Institute.
Edition, P. G. S. (2018). A guide to the Project Management Body of Knowledge. Project Management Institute. Pensylvania.
Rumelhart, D. E., Hinton, G. E., & Williams, R. J. (1985). Learning internal representations by error propagation (No. ICS-8506). California Univ San Diego La Jolla Inst for Cognitive Science. Rumelhart, D., Zipser, D., & McClelland, J. L. (1986). Parallel Distributed Processing. MIT Press. SAS (2018). Predictive Analytics - what it is and why it matters. Retrieved from SAS.
Saynisch, M. (2010). Beyond frontiers of traditional project management: An approach to evolutionary, self-organizational principles and the complexity theory—results of the research program. Project Management Journal, 41(2), 21-37.
Sumner, M., Bock, D., & Giamartino, G. (2006). Exploring the linkage between the characteristics of IT project leaders and project success. Information systems management, 23(4), 43-49.
Thota, L. S., & Changalasetty, S. B. (2013). Optimum learning rate for classification problem with MLP in data mining. International Journal of Advances in Engineering & Technology, 6(1), 35. Tukel, O. I., & Rom, W. O. (1998). Analysis of the characteristics of projects in diverse
industries. Journal of Operations Management, 16(1), 43-61.
Turner, J., & Charniak, E. (2005, June). Supervised and unsupervised learning for sentence compression. In Proceedings of the 43rd Annual Meeting on Association for Computational Linguistics (pp. 290-297). Association for Computational Linguistics.
Varajão, J., & Trigo, A. (2016). Evaluation of IS project success in InfSysMakers: an exploratory case study. In 37th International Conference on Information Systems (ICIS 2016) (pp. 1-10). Association for Information Systems.
Varajão, J., Colomo-Palacios, R., & Silva, H. (2017). ISO 21500: 2012 and PMBoK 5 processes in information systems project management. Computer Standards & Interfaces, 50, 216-222. Varajão, J., Dominguez, C., Ribeiro, P. M. G. D. A., & Paiva, A. (2014). Failures in software project
management–are we alone? A comparison with construction industry.
Werbos, P. J. (1991). Links between artificial neural networks (ANN) and statistical pattern recognition. In Machine Intelligence and Pattern Recognition (Vol. 11, pp. 11-31). North-Holland.
31
Witten, I. H., & Frank, E. (2002). Data mining: practical machine learning tools and techniques with Java implementations. Acm Sigmod Record, 31(1), 76-77.
Wohlin, C., & Andrews, A. A. (2003). Prioritizing and assessing software project success factors and project characteristics using subjective data. Empirical Software Engineering, 8(3), 285-308.