Decision making processes based on
innovation indicators: which implications for
technology assessment?
9Nuno F.F.G. Boavida ([email protected]), IET/CESNova, Faculty of Sciences and Technology, Universidade Nova de Lisboa
Abstract
The present work deals with the use of innovation indicators in the decision-making process. It intends to contribute to the discussion on the construction, use and analysis of indicator systems and also to evaluate its weight on decision-making in innovation. The goal is to help understand how innovation indicators can influence technology policy and through it, society at large. This work will start by analysing the use of indicators (their problems and consistency) and other sources of information that contribute to build the opinions of innovation decision makers. This will be followed by a survey and interviews with main innovation actors.
The results will shed light on the impact of the use of indicators by the innovation community – both in terms of technology policy and in the social sphere. Proposals and implications for the future will be advanced, hopefully adding new contributions to the governance of the science, technology and innovation field.
Key-words: innovation indicators, decision, technology policy JEL codes: C82, E61, O31
9
Based on the report for “Project IV” unit of the PhD programme on Technology Assessment. This thesis research has the supervision of António Moniz (FCT-UNL and ITAS-KIT) and Manuel Laranja (ISEG-UTL). Other members of the thesis committee are Stefan Kuhlmann (Twente University), Leonhard Hennen (Karlsruhe Institute of
Technology-ITAS), Tiago Santos Pereira (Universidade de Coimbra/CES) and Cristina Sousa (FCT-UNL).
Introduction
In the 1990s a group of sociologists introduced the notion that we are living in the era of “reflexive modernisation”. To sociologists like Anthony Giddens, Ulrich Beck and Scott Lash, over time societies become increasingly aware, self-disciplined and reflexive. In the theory of “reflexive modernisation”, society continuously strives to monitor, change and improve itself. (Giddens 1991; Beck, Giddens & Lash, 1994).
To achieve these aims, society evaluates its performance on the basis of which decision-making processes take place. As central elements of assessment, indicators – simple, composite indicators or indexes – enable society to constantly monitor its actions and improve governance by bringing additional rationality and transparency to decisions. In this context, indicators were considered a “socially and culturally oriented technology” in a recent study conducted by the Centre for Technology Assessment TA-SWISS (Feller-Länzlinger et al. 2010).
The use of innovation indicators by policy makers can have a systemic impact by increasing transparency, accountability, productivity, and quality of life to societies. However, there is a growing discussion and controversy on the purpose and methodologies used to build innovation indicators (Godin 2008; Nardo et al. 2008; Grupp and Mogee 2004; Barré 2004). Many composite indicators were not subject to extensive research, and present confidence, comparability and overlap problems (Grupp and Schubert 2010, Godinho 2007). Furthermore, some indicators used to benchmark are subject to de-contextualized interpretation (e.g. PISA results), media simplification and political appropriation (Feller-Länzlinger et al. 2010).
When searching for the use given to indicators, it is useful to understand who their users are and how they behave when using them. The sociologist Perry 6 (2002) taxonomized policy makers according to how they use quantitative information and how they behave and judge, relating it to Durkheim’s forces of social regulation and social integration. The author defined four groups of policy makers according to the way they behave regarding evidences in policy making. Like in a court judgement, policy makers use a certain amount of information as evidence but only part of it is taken in consideration as such, and the final outcome is rather dependent on where those policy makers are socially situated and integrated. Similarly, in order to understand policy makers’ position regarding innovation, it is useful to draw on Perri 6’s theoretical framework, which can help understand to what extent decisions concerning innovation are
being evidence-based and to assess whether the social and cultural background of policy makers take some part on it. This work’s proposed survey and interviews will provide concrete data that can help answer these questions.
In this context, the objective of this work is to assess the potential and the risks associated to decisions based on innovation indicators. It will focus on innovation metrics and on their use by technology actors in order to understand the impact of indicators on technology policy and on society.
Since indicators as such have rarely been subject of extensive scientific research and there is no final “theory of indicators”, much of this work will also be conducted on uncharted territories (Feller-Länzlinger et al. 2010). Research will firstly focus on present controversies on the construction, use and analysis of sets of indicators, as well as on composite indicators or indexes. The work will then gather data from the users of these metrics to understand the role of indicators and other sources of information. It will also analyse decision makers’ constraints of discipline and bond to peers in the decision making process.
Conclusions will be drawn by approaching the topic from the point of view of both the perception and the use of innovation indicators in practice, when deciding on technology. The perception and use of these indicators might help, not only to re-frame their construction methods, but also to rethink their use in monitoring and evaluating a society engaged in a “reflexive modernization” process.
The work builds on the theoretical framework mentioned, an analysis of indicators consistence, a survey and interviews on the use of quantitative evidences, in order to assess the patterns of use of information by innovation decision makers.
Some questions are important understand the potential and the risks associated to decisions based on innovation indicators. For example, how are innovation indicators being constructed? It can be hypothesised that indicators help society to constantly monitor its actions to continuously strive for change and improve itself. Furthermore, indicators have rarely been a subject of extensive research, and are a "Cultural" technology that evolves with the contexts of society. In addition some innovation indicators present significant problems for their use. Another relevant question is to understand to what extent can one abstract from reality using a composite number? It can be hypothesised that composites indicators (or indexes) measure a simplified (unidimensional) non-abstractable part of a complex reality. Furthermore, composite indicators can raise social awareness, influence decision making and be subject to manipulation. In addition, innovation composites are being constructed according to several unreliable methodologies and are often inconsistent.
To approach answers to those questions, three well known and generally considered complex indicator systems on innovation (Science, Technology and
Industry Scoreboard 2009, European Innovation Scoreboard 2008 and Innovation Union Scoreboard 2010) will be analysed in terms of attributes, in order to identify common factors which might contribute to their high quality. A metric system will be developed to quantify the number, nature and attributes of indicators in each publication, thus revealing differences which may be the cause for indicator systems’ quality and purpose (e.g. study innovation systems, raise of social awareness and influence in decision making).
Other questions are relevant to complement the research that enable proper understanding of the decision making processes based on innovation indicators. For example, what dangers do innovation indicators present to society? It can be hypothesised that the innovation indicators may increase complexity, ambivalence of interpretation, de-contextualization and contribute to "shaming and blaming" of countries. Furthermore, the media may oversimplify and scores and indicators may substitute innovation policy debate. In addition, indicators can meet resistance if they are perceived as threatening and seen as causing or inducing social, ecological and economic damages.
Another example of questions that will be addressed is how to deal with the proliferation and selection of composites indicators. It can be hypothesised that the ability to properly deal with these metrics will depend on the expertise of technology decision makers and on the public perception of the use of indicators. The understanding of the process of decision requires an answer to the real weight of innovation indicators and composites in technology decisions. It can be hypothesised that innovation indicators and composites indicators influence technology decisions. Furthermore, indicators’ influence varies according to the social and political status of the actors, and with different levels of complexity of the decisions.
To answer these questions a survey and oriented interviews will be tested using privileged informants, and after applied to Portuguese decision-makers on innovation, to disclose to what extent they use indicators and other influences. Representatives of innovation decision-makers on different areas of activity will be asked to participate: politicians, business managers, innovation researchers/academics, managers of technology centres, of science and technology parks and of innovation clusters, venture capitalists, innovation consultants and innovation banking managers. It is expected to understand the role of the innovation indicators and other sources of information vis-a-vis with socio-cultural influences on the patterns of behaviour of decision makers.
Analyses of indicators
This chapter addresses a case study of innovation scorings, given that they are a popular indicator-based system for decision making. A great deal of discussion has been promoted surrounding the evolution of the innovation indicators, particularly in Europe. Presently, the annual Innovation Union Scoreboard jumped from an research-based project to became a European Union flag, a vision to react to recession and serving the needs of many stakeholders. On the other hand, the OECD created a different approach to benchmarking an publish the biennial collection Science, Technology and Industry Scoreboard.
In a technology assessment perspective, the innovation indicators are a part of the existing and evolving knowledge of society, and are a starting point for debates with all stakeholders in societies. They are presently of a crucial value to assert policies, politics, awareness, etc. However, the use of innovation indicators also possesses several risks to society. The following text of this chapter will capture the pros and cons of the use of innovation scoring and benchmarking, answering questions on how are innovation indicators being constructed and whether we can abstract from reality using a composite number.
Collection of innovation indicators
First, a battery of indicators was randomly collected and the empirical results analysed. The OECD publication Science, Technology and Industry Scoreboard 2009 enabled a set of conclusions drawn from each indicator per se based on comments made by OECD in the text, and after a qualitative summary of the complete indicator system in 2009.
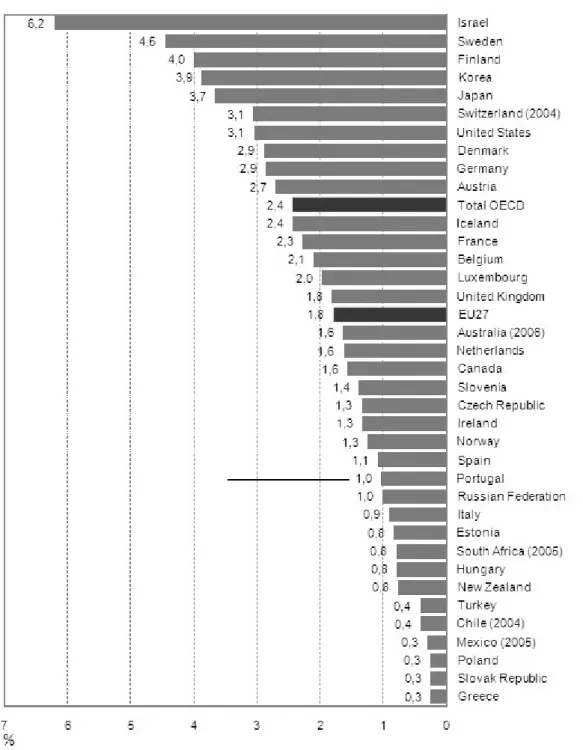
Figure 1 presents the latest available data (mostly 2007) of the Business Enterprise R&D (BERD) as a percentage of value added in industry in 36 economies.
Figure 1 - Business R&D intensity, 2007
Source: OECD 2009
The industrial R&D is most closely linked to the creation of new products and production techniques, as well as to a country’s innovation efforts. The BERD accounts for the bulk of research and development (R&D) activity in OECD
countries in terms of both performance (close to 70 percent of total R&D) and funding.
According to OECD (2009) the United States accounted for around 43 percent of OECD-area BERD, and the EU and Japan accounted for 27 percent and 19 percent, respectively. When using a percentage of value added in industry as a weight measure of intensity, the Portuguese Business R&D intensity reached 1 percent in 2007 and ranked 24th out of 36 studied economies (and the BERD) experienced strong growth of BERD during the last decade. In 2005 the Portuguese Business R&D intensity was 0.5 percent of value added in industry, and ranked 27th out of 32 economies (OECD 2007a, page 31).
The doubling from 0,5% to 1% of the Portuguese Business R&D intensity from 2005 to 2007 requires further research. Nevertheless, in an international comparison the Portuguese BERD intensity was always bellow the OECD and EU27 average, as well as ranking among the last countries both in the 2005 and 2007.
This increase in the Portuguese BERD needs further research, given that the value doubled without any explanation from 2005 to 2007. In fact, the main international publications did not report any methodological changes in the Portuguese data (e.g. the 2007 and 2009 editions of OCDE STI Scoreboard and the OECD’s Main Science and Technology Indicators 2010-1). Furthermore, the Portuguese official publication Sumários Estatísticos IPCTN 07 reported improvements in the collection methods, such as an increase and up-to-date of their databases used in the R&D survey, as well as a special collaboration between the statistical authority and the national societies of accountants (GPEARI/MCTES 2009, page 12). It is possible that other factors played a role on these improvements, but more research is needed on this topic. In conclusion, one can possibly accept the data for 2007, but the 2005 to 2007’s increase has to be named an inconsistent indicator.
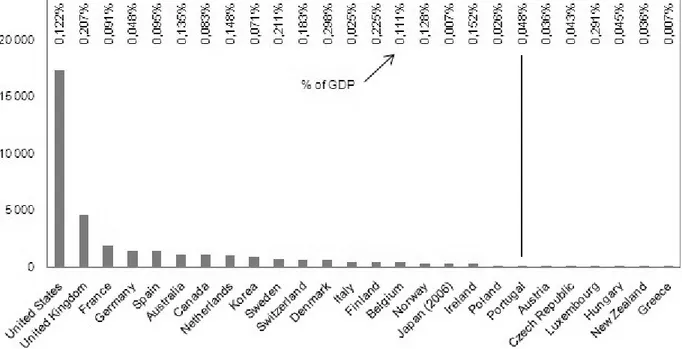
Figure 2 presents the Venture capital investments as a percentage of GDP (USD millions) in the latest available year (2008) in OECD economies.
Figure 2 - Venture capital investment, 2008
USD millions and as a percentage of GDP
Source: OECD calculations, based on Pricewaterhouse Coopers/National Venture Capital Association MoneyTree™ Report.
The venture capital is a significant source of funding for new technology-based firms, it can play an important role in promoting radical innovations and is one of the determinants of entrepreneurship.
The figure shows that in 2008, the United States accounted for 49 percent of total venture capital investments in OECD countries. The United Kingdom was the only other country where this share exceeded 10 percent of the OECD total. When using GDP as a weight measure of intensity, the Portuguese venture capital investments represented 0.048 percent of its GDP, figured in the last quartile of the graph, and ranked in 20th position out of the 26 studied economies (OECD 2009). Similarly but not fully comparable data for 2005 (or the latest available year) indicated that 0.133 percent of the Portuguese GDP was invested as venture capital, figured in the second quartile of the graph and above the OECD and EU average, and ranked 20th out of 27 economies studied (OECD 2007a, page 39).
Taken as a relatively plausible abstraction one can compare internationally the Portuguese relative position in each study conducted for 2008 and for 2005. However, when grossly comparing the absolute value 0,048% with 0,133% between 2005 and 2008, one should not conclude that there was supposedly a
decrease on the venture capital investment in Portugal, because the sources were different in the two editions of the OCDE STI Scoreboard (e.g. 2007 and 2009). In the 2009 version the OECD sources were based on OECD calculations, which were based on the Pricewaterhouse Coopers/National Venture Capital Association MoneyTree™ Report. In the 2007 version the OECD sources were based on OECD calculations, which were based on data from EVCA (Europe); NVCA (United States); CVCA (Canada); AVCAL (Australia), NZVCA (New Zealand), and Asian Venture Capital Journal (The 2003 Guide to Venture Capital in Asia) for Japan and Korea. Therefore, although present in the same OECD collection the two sources are different and cannot be compared.
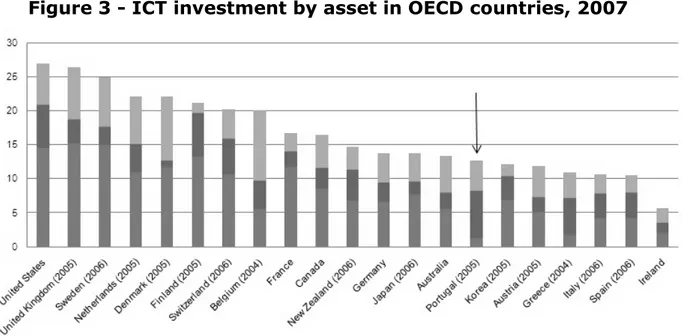
Figure 3 presents the Information and Communication Technologies (ICT) investment by type of asset (e.g. Software, Communication equipment and IT equipment) some OECD countries in 2007, as a percentage of non-residential gross fixed capital formation in the total economy.
Figure 3 - ICT investment by asset in OECD countries, 2007
Source: OECD 2009
According to OECD (2009), the investment in physical capital is important for growth, as it is a way to expand and renew the capital stock and enable new technologies to enter the production process. The same publication states also that “the ICT sector has been the most dynamic component of investment from 1985 to 2000 but then started to decrease, following the bursting of the dot com bubble” (page 48).
The Portuguese ICT investment (as a percentage of non-residential gross fixed capital formation in the total economy) was 12.7 percent in 2005, and ranked 15th out of 21 economies (although the comparison is made with data regarding 2004, 2005, 2006 and 2007), the Portuguese ICT investment was 13.6 percent in 2003, and ranked 15th out of the 21 studied economies (although the comparison is made with data regarding 2002, 2003, 2004 and 2005). In the former comparison regarding broadly 2007, the Communications equipment sector was the major component of ICT investment in Portugal (55 percent, data for 2005) and Greece (49 percent, data for 2004). (OECD 2007a, page 103 and OECD 2009, page 47). Furthermore, the OECD stated both in 2007 and 2009 that the
“Correct measurement of investment in ICT in both nominal and volume terms is crucial for estimating the contribution of ICT to economic growth and performance. Data availability and measurement of ICT investment based on national accounts (SNA 93) vary considerably across OECD countries, especially as regards measurement of investment in software, deflators applied, breakdown by institutional sector and temporal coverage. In the national accounts, expenditure on ICT products is considered investment only if the products can be physically isolated (i.e. ICT embodied in equipment is considered not as investment but as intermediate consumption). This means that ICT investment may be underestimated and the order of magnitude of the underestimation may differ depending on how intermediate consumption and investment are treated in each country’s accounts.”
However, both publications (OECD 2007a page 103, and OECD 2009 page 47) presented the exact same sources. In 2009 the OCDE publication used both “OECD, Database on Capital Services, July 2009; and OECD, Productivity Database”, and in 2007 the OECD publication used both “OECD database on Capital Services, April 2007; and OECD Productivity database”.
Nevertheless, although presenting international comparability problems, the data for Portugal is comparable alone regarding the year 2005 and 2003. However, using old data in a sector characterized by fast changes in small periods of time might present further dangers. Therefore, it seems more appropriate to complement observations with recent national level quantitative measures or even to seek further qualitative information.
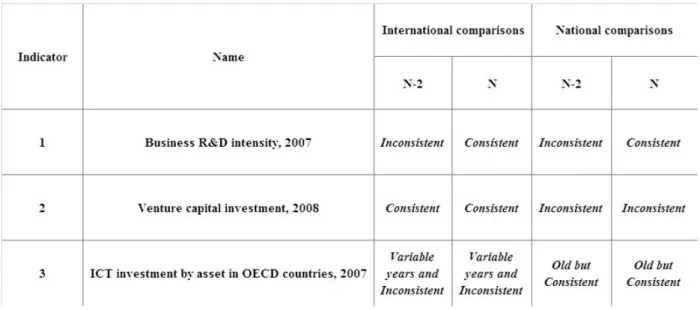
To conclude the observations on these three indicators, one can state that the quality, depth and limitations of three widely accepted indicators in a prominent and renowned publication collection varied significantly, presenting different levels of consistency. First, the Portuguese Business R&D intensities (Figure 1) in 2007 and 2005 was a consistent indicator for national and international
comparisons. Second, the Venture capital investment (Figure 2) presents consistent data for internationally comparisons in 2008 and also in 2005, and the Portuguese data was inconsistent for national comparisons between 2008 and 2005. Last, the ICT investment indicator by asset in OECD countries (Figure 3) presented some international comparability problems and old, although comparable, data for Portugal in 2003 and 2005.
Table 1 - Summary of the consistency observed in three STI indicators
The analysis of three selected indicators published in the OECD Science, Technology Industry collection allowed a set of empirical conclusions about the use of single indicators to understand realities in significantly different degrees. As mentioned in the literature, an indicator presupposes the existence of a correct relationship between the measurement parameter and the object observed. First, the STI collection noticed that some countries apply different methodologies to collect the data used in the study. Second, in some comparisons the data used to countries referred to different years, which provided only a possible reliable approximation to reality. Third, in some cases the data was too old to draw relevant conclusion about the object observed. Last, some data was simple inconsistent to relative comparability and even to absolute comparisons (e.g. venture capital indicator), thus leading to very restricted conclusions.
Composite indicators - The Summary Innovation Index
A second element of the work will consist on the analysis of two composite indicators, based on different techniques already established by the literature in this field, such as the European Innovation Scoreboard and the Innovation Union Scoreboard.
1. The Summary Innovation Index was created in 2001. The Tentative Summary Innovation Index attributed -8.7 to Portugal, included the country in the category “Falling further behind” and ranked Portugal in the last of the EU15.
2. The Summary Innovation Index 2002 “has not been calculated for the national EIS because the four CIS indicators could not be updated” (EIS2002, page 11).
3. The Summary Innovation Index 2003 was not comparable with the SII2002 and SII2001. However, Portugal scored 0.22, included the country in the category of “catching-up” and ranked 14th out of EU15.
4. The Summary Innovation Index 2004 ranked Portugal with 0.28 and ranked 11th out of EU15 (EIS2004, page 17).
5. The Summary Innovation Index 2005 (SII2005) is also not comparable with the SII2004, SII2003, SII2002 and SII2001. However, Portugal scored 0.17, scored below the EU25 and ranked 23th of the EU25.
6. In the Summary Innovation Index 2006 (SII2007) the relative position of Portugal improved to 0.22, scored bellow EU25 and ranked lower one position to 24th of the EU25.
7. The Summary Innovation Index 2007 (SII2007) the relative position of Portugal improved to 0.25, scored bellow EU25 and ranked 23th of the EU27.
However, with the introduction of another methodology in 2008, these relative figures where Portugal ranked systematically in the end of the league started to
change.
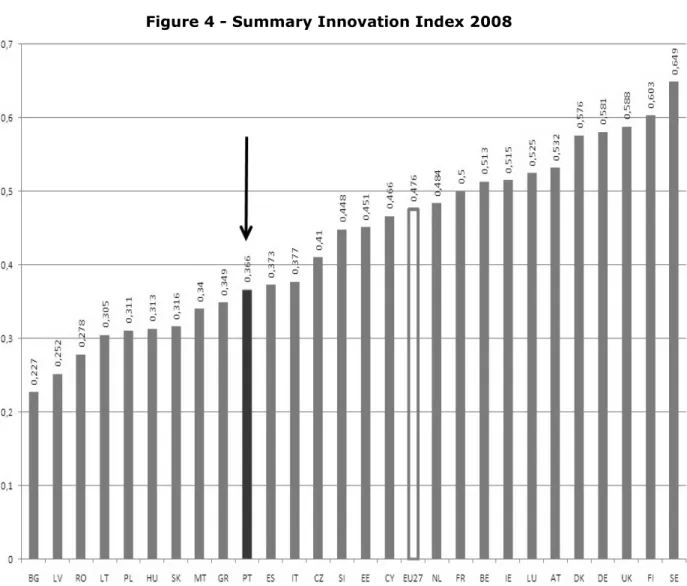
Figure 4 - Summary Innovation Index 2008
Source: European Innovation Scoreboard Database 2009 (some values were changed when compared to the print version of EIS2008)
1. The SII2008 presented Portugal with 0.366 points, scored below the EU27 average and climb to 18th position among the EU27. Furthermore, in the EU Portugal was considered a Moderate innovator “with innovation performance below the EU27 where the first 4 countries show a better performance than the last 6 countries” (EIS2008, page 10), and one of the two Growth leaders of the Moderate innovators (EIS2008, page 11).
2. However, it is relevant to keep in mind that the European Innovation Scoreboard introduced different methodologies in the construction of the SII2008.
3. The SII2009 presented Portugal with 0.401 points, scored below the EU27 average and climbed again to 16th position among the EU27.
In addition, the methodology to construct the SII2010 version was again changed (likewise 2003, 2005, 2008). For example, the SII2008 calculated alternatively using the new methodology established in 2010 produced the following figure to 2008:
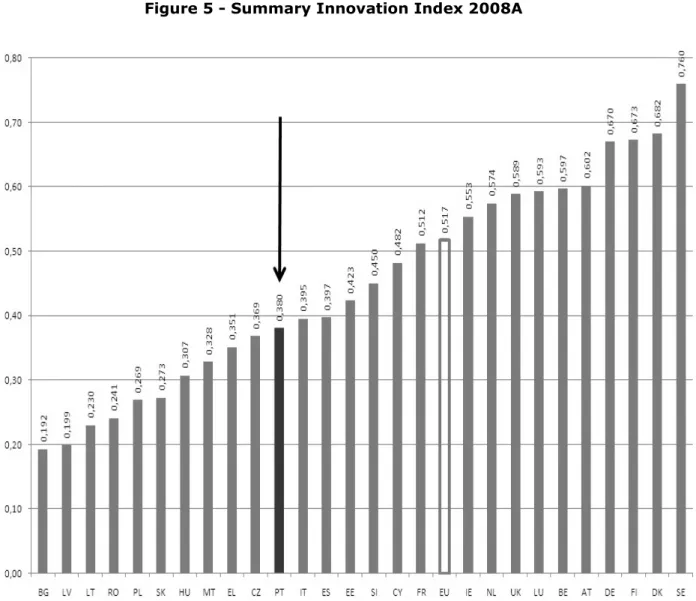
Figure 5 - Summary Innovation Index 2008A
• The SII2008A presented 0.380 points to Portugal (SII2008 was 0.366), scored below the EU average (likewise the SII2008) and ranked 17th
among the EU27 economies (ranked 18th in the SII2008).
• Similarly, the SII2009A presented 0.401 points to Portugal (SII2009 was 0.366), scored below the EU average (likewise the SII2009) and ranked 15th among the EU27 economies (ranked 16th in the SII2009).
Therefore, Portugal improved its relative positions with the methodological changes occurred in 2010. Likewise, the new methodology to construct the SII2010 presented the following ranking in the re-named Innovation Union Scoreboard 2010:
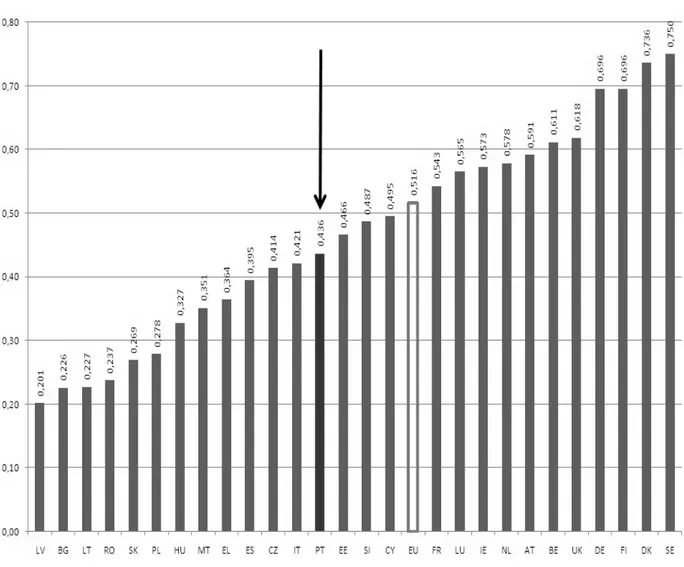
Figure 6 - Summary Innovation Index 2010
1. The SII2010 presented Portugal with 0.436 points, scored below the EU27 average and ranked 15th among EU27 countries, thus improving one position relative to the SII2009.
2. Furthermore, Portugal was considered a Moderate innovator “with innovation performance below the EU27” and who “is less than 10 percent below but more than 50% below that of the EU27“ (IUS2010, page 9), and identified has a country that “experienced the fastest growth in performance”. In addition, all countries of the Moderate innovators have grown faster than the EU27, and Portugal was mentioned as a growth leaders among two (IUS2010, page 10).
Although one could acknowledge the relative climbing of Portugal among the European Union nations, it is however impossible to analysed the absolute value of the composite indicator SII throughout time, given the constant changes in methodology. For example, the recent Innovation Union Scoreboard 2010, acknowledges that the previous list of 29 indicators of the European Innovation Scoreboard 2008 and 2009 has been replaced with a new list of 25 indicators, which “better capture the performance of national research and innovation systems as a whole”. Twelve of these 29 indicators have not been changed, two indicators have been merged, five indicators have been partly changed using broader or narrower definitions or different denominators and seven new indicators have been introduced.
The use of innovation indicators in decision
making
This chapter will link the evidences used by decision makers on innovation, their styles of judgment and their distinctive weakness. Presently, the chapter focus on the first stage of the designing process of a questionnaire and interviews. The survey questions will be tested using privileged informants to certify its correct design in relation to the research hypotheses above-mentioned. After, the questionnaire will be send by email to the actors identified as the innovation decision makers community, namely politicians, innovation researchers and
academics, managers of Technology Centres, managers of Science & Technology parks, venture capitalists, business managers, innovation consultants, managers of innovation clusters and innovation banking managers. Additional interviews will also be conducted to clarify specific issues arising from the application of the questionnaire.
Finally, the survey and the interviews will be framed within the mentioned literature review, the findings on innovation indicators from the previous chapter and several criticisms received in the scientific conferences where this work was discussed. First, the survey will take into consideration the risks to decision-making when using indicators, such as:
• Indicators were rarely been a subject of extensive research, although several social sciences and governmental statistical offices provided inputs in the past decades (TA Swiss 2010).
• Indicators and their aggregation into indexes are very sensitive to the media and to politics, as they present problems of availability, validity and comparability.
• The concept of benchmarks or scoreboards borrowed from companies' strategic management at a national level imposes several problems, like clear "theoretical models to guide the selection and weighting of indicators are lacking” Grupp and Schubert (2010).
• Some innovation indexes may led to “shaming and blaming of countries” Grupp and Schubert (2010).
• The media and politicians enthusiastically adopted indicators indexes, as a way to both reducing complexity, over-simplifying and justifying any policy measure. This form of de-contextualisation now extends so far that Programme for International Student Assessment (PISA) is also used as a catchword for justifying any measures relevant to education. This reductionist usage, however, in no way does justice to the potential and the purpose of PISA. (TA Swiss 2010).
• The TA Swiss study found complexity and ambivalence in the use of indicator systems (the PISA case of this study showed signs of ambivalence between transparency and over-simplification) and exposed the problems created by widespread application of these systems. (TA Swiss 2010)
• The TA Swiss study was aimed primarily at sensitising people to the opportunities and risks presented by such indicators systems (TA Swiss 2010).
• Lastly, increase the gap between proper knowledge and the perception of being knowledgeable, lead to inaccurate interpretations of reality, and raise awareness and political appropriations of results which may force simplistic decisions.
Second, the questionnaire will also take into account the implications to technology assessment resulted from the use of innovation indicators, namely:
• Technology Assessment is primarily expected to supply information that enables people involved in decision-making about innovation to determine appropriate strategies. Technology Assessment thus aims to support decision-making; contribute to the socialization of decision-making on science, technology, and innovation; and improve the social utilisation of science, technology, and innovation.
• Technology Assessment goals and realistic achievements will determine the selection of evaluation indicators (TAMI 2004).
• The Technology Assessment's methods need careful thinking because the use of innovation indicators that may lead to the “shaming and blaming of countries”, to problems concerning indicators quality, lack of confidence, comparability and overlapping problems (Grupp and Schubert 2010). Furthermore, methodological problems may exist related to purpose and use of composite indicators/indexes, dealing not only with the policy makers but also with other stakeholders such as media, citizens or academics (Barré 2004).
• Technology Assessment should also reflect on how are "cultural" activities such as Science being measured, because as Benoit Godin (2009) stated measuring science has become an "industry”.
• Last, indicators as a “cultural” technology can also meet resistance. Particularly, if they were “perceived as threatening and seen as causing or inducing social, ecological and economic damages” (Bechman, Decker, Fiedeler and Krings 2007).
Final remarks
Some important findings can be summarized in terms of the use of indicators and in composite/index indicators. Grupp and Schubert (2010) demonstrated in his comparison between the use of multidimensional representations and composite indicators applied to Finland, Luxembourg, the UK and Greece, that both approach serve different purposes. Multidimensional representations are a central element of designing promising policy measures, because only they can provide the necessary information. Composite indicators have a powerful communication function in drawing attention to relevant topics, such as innovation, sustainable development, etc. This comparison suggested an integrated approach of using both methods, each for its designated objective. The authors concluded that provided a careful selection of weights, the composite indicators can draw attention to important topics in the policy arena and induce a "kind of quasi-competition for best practices and they reward those who manage to perform well”. However, composites do not provide valuable information on why a country is bad in, because these indicators hide their strengths and weaknesses. In turn, a multidimensional representation such as spider-charts will help on understanding what should be done because it provides complementary information.
The past years have seen several concerted efforts to arrive at common procedures for calculating composite indicators at the national level. For example, the European Commission has promoted the use of so-called "composite innovation indicators" - that is, aggregation of different types of indicators into simpler constructs for the purpose of summarizing complex multidimensional phenomena. On the other hand, in a different way the OECD stated in its Science, Technology and Industry (2005) that the “Scoreboard favours using a wide range of indicators to map the complexity of innovative activities, and refrains from producing an overall ranking of countries derived from a unique, synthetic value.” Therefore, it is possible to conclude that from the scientific point of view the use of composite indicators in innovation presents elements of unreliability and should be analysed very carefully.
Furthermore, elements of de-contextualization, oversimplification, increased complexity and ambivalence were found in the indicator systems studied by TA Swiss in 2010. In addition, TA Swiss stressed that indicators have rarely been a subject of extensive research, thus emphasizing the idea of a careful use in innovation indicators systems. In the same line of thought as Grupp and Schubert (2010), the former study did not reject the usefulness of composite indicators, but pointed out their weaknesses arguing that they should have a complementary function such as a communication and benchmark devices. Last, this work prepared a framework to address the use of information by
innovation policy decision makers. The assumption was that although information is never perfect, there is an increasing use of indicators in a “reflexive” society (Giddens 1991). Consequently, the work framed the design of a questionnaire and interviews addressing actors involve in innovation decision making. It is expected that in the near future the results will be ready to present to the scientific community.
References
Bechmann, G., M. Decker, U. Fiedeler, and B.-J. Krings. 2007. Technology assessment in a complex world. International Journal of Foresight and Innovation Policy 3, no. 1: 6-27.
Beck, U., Giddens, A. & Lash, S. 1994. Reflexive Modernization. Politics, Tradition and Aesthetics in the Modern Social Order. Stanford University Press
Barré, R. (2001). Agora processes - The Agora model of innovation systems: S&T indicators for a democratic knowledge society. Research Evaluation, 10(1), 13-18. Barré, R. (2004). S&T Indicators for policy making in a changing science-society: The
New Science–Society Relationship. In H. Moed, W. Glänzel, & U. Schmoch (Eds.), Handbook of Quantitative Science and Technology Research (pp. 115-131). Springer Netherlands.
Boavida, N. (2008). Portugal e a economia do conhecimento: A despesa empresarial em Investigação e Desenvolvimento. IET Working Papers Series, 02/2008. Monte de Caparica. Retrieved from http://ideas.repec.org/p/ieu/wpaper/03.html.
Boavida, N., Cabrita, N., & Moretto, S. (2010). Análise do processo de participação pública no projecto da Alta Velocidade Ferroviária. IET Working Papers Series,
06/2010. Monte da Caparica. Retrieved from
http://ideas.repec.org/p/ieu/wpaper/26.html.
Boavida, N., & Moretto, S. M. (2010). Innovation Assessment of a Portuguese railway branch of a foreign multinational - A case study. IET Working Papers Series,
05/2010. Monte da Caparica. Retrieved from
http://ideas.repec.org/p/ieu/wpaper/25.html.
Cherchye, L., Moesen, W., & Puyenbroeck, V. T. (2004). Legitimately diverse, yet comparable: on synthesizing social inclusion performance in the EU. Journal of Common Market Studies, 42(5), 919-955.
Europäische Akademie. 2004. TAMI Technology Assessment in Europe Between Method and Impact.
Feller-Länzlinger, R., Haefeli, U., Rieder, S., Biebricher, M., & Weber, K. (2010). All sized up - Counting, calculating and controlling in the knowledge-based society. (TA-SWISS, Eds.)TA Swiss (TA-SWISS Z., pp. 26-40). Bern: TA-SWISS. Retrieved from http://www.ta-swiss.ch/en/projects/social-and-cultural-ta/indicators/.
Geels, F., & Schot, J. (2007). Typology of sociotechnical transition pathways. Research
Policy, 36(3), 399-417. Retrieved from
http://linkinghub.elsevier.com/retrieve/pii/S0048733307000248.
Giddens, A. (1991). The Consequences of Modernity. (S. U. Press, Ed.)The British Journal of Sociology (1996th ed., Vol. 42, p. 100). Cambridge, UK: Polity Press. doi: 10.2307/591454.
Godin B. (2006). The Value of Science: Changing Conceptions of Scientific Productivity, 1869-circa 1970. Montreal.
Godin B. (2008). The Knowledge Economy: Fritz Machlup’s Construction of a Synthetic Concept. Montréal: Institut national de la recherche scientifique - Centre Urbanisation Culture Société.
Godinho, M. M. (2007). Indicadores de C&T, inovação e conhecimento: onde estamos? Para onde vamos? Análise Social, XLII (182), 239-274.
GPEARI/MCTES. 2009. Sumários Estatísticos IPCTN 07, Gabinete de Planeamento, Estratégia, Avaliação e Relações Internacionais, 231.
Grunwald, A. (2007). Editorial. International Journal of Foresight and Innovation Policy 3, no. 1: 1-5.
Grupp, H., & Mogee, M. E. (2004). Indicators for national science and technology policy - Their Development, Use, and Possible Misuse. In H. F. M. et Al. (Ed.), Handbook of Quantitative Science and Technology Research (pp. 75-94). Kluwer Academic Publishers.
Grupp, H., & Schubert, T. (2010). Review and new evidence on composite innovation indicators for evaluating national performance. Research Policy, 39(1), 67-78. doi: 10.1016/j.respol.2009.10.002.
Gómez-Limón, J. a, & Riesgo, L. (2009). Alternative approaches to the construction of a composite indicator of agricultural sustainability: An application to irrigated agriculture in the Duero basin in Spain. Journal of environmental management, 90(11), 3345-62. doi: 10.1016/j.jenvman.2009.05.023.
Jones, C. I. (2002). Sources of U.S. Economic Growth in a World of Ideas. American Economic Review, 92(1), 220-239. doi: 10.1257/000282802760015685.
Kuhlmann, S. et al. (1999). Improving Distributed Intelligence in Complex Innovation Systems. Advanced Science & Technology Policy Planning Network (pp. 1-87).
Karlsruhe. Retrieved from http://ideas.repec.org/p/pra/mprapa/6426.html.
Lemos, T., & Boavida, N. (2006). Contributos para a caracterização das no TIC no Ensino Superior e no Sistema Científico-Tecnológico em Portugal. (OCES, Eds.)OCES (p. 41). Lisboa: OCES - Observatório da Ciência e do Ensino Superior.
Nardo, M., Saisana, M., Saltelli, A., & Tarantola, S. (2005). Tools for Composite Indicators Building. (J. E. Commission, Ed.)European Commission (p. 134). European Communities.
Nardo, M. et al. (2008). Handbook on Constructing Composite Indicators: Methodology and User Guide. (J. E. Commission, with OECD, Eds.) OECD (p. 162). Paris: OECD
Publishing. Retrieved from
http://www.oecd-ilibrary.org/oecd/content/book/9789264043466-en .
National Science Board. (2010). Science and Engineering Indicators—2010. (N. S. Foundation, Ed.)Journal of Testing and Evaluation (NSB 10-01 ed., Vol. 19, p. 566). Arlington, VA: National Science Foundation. doi: 10.1520/JTE12551J.
Newman, N. C. et al. (2010). Longitudinal assessment - Differences over a decade: high tech capabilities and competitive performance of 28 nations. Research Evaluation, 14(2), 121-128.
OECD. (2007). Glossary of statistical terms. OECD, 863.
OECD. (2008). Main Science and Technology Indicators. (N. OECD, Ed.)OECD (2008-2 ed., Vol. 2008, p. 104). Paris: OECD Publishing.
OECD. (2009a). Main Science and Technology Indicators. (OECD, Eds.) (p. 156). Paris: OECD Publications. Retrieved February 25, 2011, from
http://scholar.google.com/scholar?hl=en&btnG=Search&q=intitle:Main+Science+an d+Technology+Indicators#0 .
OECD. (2009b). Science, Technology and Industry Scoreboard 2009. (OECD, Eds.)OECD (2009th ed., p. 146). Paris: OECD Publications.
Perri 6. 2002. Can Policy Making be Evidence-Based? MCC: Building knowledge for integrated care. 10-1. Pavilion Publishing. Brighton.
Rip, A. (2008). Processes of Technological Innovation in Context - and Their Modulation. Festschrift (p. 17). Louvain.
Saisana, M, Saltelli, A, & Tarantola, S. (2005). Uncertainty and sensitivity analysis techniques as tools for the quality assessment of composite indicators. Journal of the Royal Statistical Society Series A Statistics in Society, 168(2), 307-323. doi: 10.1111/j.1467-985X.2005.00350.x.
Smits, R., Merkerk, R. V., & Guston, D. H. (2010). The Role of Technology Assessment in Systemic Innovation Policy. In R. Smits, S. Kuhlmann, & P. Shapira (Eds.), The Theory and Practice of Innovation Policy: An International Research Handbook (Vol. 2010). Edward Elgar.
Tijssen, R. J. W. (2003). Scoreboards of research excellence. Research Evaluation, 12(2), 91–103. Beech Tree Publishing. Retrieved February 23, 2011, from
http://www.ingentaconnect.com/content/beech/rev/2003/00000012/00000002/art0 0003 .
Zhou, P., Fan, L.-W., & Zhou, D.-Q. (2010). Data aggregation in constructing composite indicators: A perspective of information loss. Expert Systems with Applications, 37, 360-365. Elsevier Ltd. All. doi: 10.1016/j.eswa.2009.05.039.