1
Appendix
2
Contents
APPENDIX ... 1
1. The contents of the reports ... 2
2. Meetings and documents for Partners ... 10
3. The four national reports ... 24
a) Portugal ... 25
b) Spain ... 94
c) Italy ... 134
d) Greece ... 152
4. Grids for analysis... 219
5. Interview guide ... 226
6. Interviews to experts ... 227
7. Final analytical grid and indicatos ... 267
8. Outputs ... 271
e) Articles ... 272
f) Conference papers and presentations ... 293
g) Articles in progress for future submission... 372
3
1. The contents of the reports
Report Structure (maximum 40 pages)
Introduction
Section A: Background
A.1. National Context description A.2. Education System Characterization
A3. Processes and Mechanisms of Monitoring and Evaluating the Educational System
Section B: Crisis Impacts in Education
B.1. Equity: Policies and Achievements
B.2. Equity and Quality: Orientation and Processes
(Conclusion) optional no more than 2 pages
Indicators 2000 until 2013.
Text, tables and figures should be in times new roman.
For each figure you include in the report please add in appendix one excel document (.xls) with the total numbers in tables.
Whenever possible, pinpoint year corresponding to beginning of the crisis in your country (for instance, starting year of austerity measures.
4
National Report Structure
Introduction
The analysis of the indicators should encompass a diachronic vision for each country, ensuring comparability and perception of trends as well as possible points of inflection between them.
SECTION A: BACKGROUND (maximum 6 pages)
Introduction to section A
In this section will be discussed the socio-economic and political national contexts, influencing the educational policy and the level of performance of each educational system, as well as some of the "impacts" from education (employment rates, for example); on the other hand, indicators characterizing each national educational system. Once the main goals of the project are related to the levels of equity expressed by national Educational Systems within crisis context, it is also important to collect data on Social Inequalities and Scholar Inequalities (either using national statistics or research results from previous studies). The proposed analysis should serve as background information for the project and its subject-problem framework.
SECTION A.1. National Context description (maximum 3 pages)
a) The qualification structure of the population, levels of social and educational inequality. b) Political Cycles (from 2000 to the present) – an overview on educational policy-making and
its evolution (e.g., major trends in educational measures on access to education, school success, educational compensation measures,...);
c) Main educational policy since the beginning of the European financial crisis -- the Troika´s intervention (Greece / Portugal) and the political “packages” of specific austerity measures (Spain / Italy).
Recommended indicators:
(data must be organized, whenever it is possible, by: gender; age groups, ethnic minorities, immigrants and descendants of immigrants ; regional distribution)
5 1. Qualification of the Population 25-64 years of age
2. Employment Rate and Unemployment Rate (25-64 years of age) 3. Gini coefficient of equivalised disposable income;
4. At-risk-of-poverty rate (cut-off point: 60% of median equalized income after social transfers);
5. Child poverty rate.
6. Educational Funding (state/families): Public Expenditure on education (% do PIB ) / Family expenditure on education (% do PIB), Private share on educational funding.
SECTION A.2. Description of the Educational System (maximum 3 pages)
Start this section by presenting your country´s Educational System Diagram.
a) Indicators describing the school system in its function and main characteristics -- starting firstly by presenting your country´s Educational System Diagram (see proposal in appendix); secondly, describing the school system as an organization in its levels of autonomy and the roles of the main key actors; and thirdly, by giving information on the main structural characteristics of the education systems: ages of compulsory and optional schooling; pre-schooling attendance (mean age, minimum and maximum age), the level of the offer in terms of vacancies and schools; offers in adult education and for students with disabilities. Comment if, since the current financial crisis in Europe, there were any changes referring to: minimum and maximum ages (if applied) for enrolment in the first year of pre-school, primary school, lower secondary, upper secondary and tertiary education (for both compulsory and optional schooling); length of each education level (from pre-school to upper secondary); adult education., and students with disability.
b) Students´ distribution by available pathways – regular educational pathways; vocational and training systems; adult education; and students with disability (if possible, distinguish between public and private schools).
Recommended indicators:
(Data must be organized, whenever it is possible, by: gender; age groups – except on cases where ages are already defined; ethnic minorities, immigrants and descendants of immigrants; regional distribution)
1. Teachers and students numbers (total numbers, from 2000 to the present); 2. Numbers of public and private schools (total numbers, from 2000 to the present); 3. Level of educational offer in terms of vacancies and number of schools (considering the
different schooling levels – pre-schooling, primary, secondary, tertiary, vocational and training education)
6 4. The structure of educational provision: how do transitions occur (since first transition, does it imply tracking, compulsory school guidance, national exam); existing tracking for different education levels, and possibilities of permeability between tracks;
5. Percentage of students by gender; age groups – except on cases where ages are already defined; ethnic minorities, immigrants and descendants of immigrants; regional distribution)
6. By different educational levels: enrolment rates; drop-outs rates; retention rates.
SECTION A.3. Processes and Mechanisms of Monitoring and Evaluating the Educational System (maximum 6 pages)
1. Discuss the use of international tests like TIMMS, PIRLS, PISA, …., European Reports and recommendations, in the “domestic” policy making;
2. Describe the Educational statistics production/publication: on the regularity of data collection, the main sources, dissemination of results and transparency of the system in your country;
3. Describe the processes of assessment of the educational system performance which type and regularity, such as the institutions in charge of monitoring, evaluation and assessment of the school system (examples: national examinations as a mean of system assessment; external or internal assessment of schools, etc.);
4. Describe the processes of schools’ autonomy in your country.
5. Describe the procedures of teachers recruitment and professionalization; as well as the training of teachers and other educational agents.
SECTION B: CRISIS IMPACTS IN EDUCATION
Here we aim to discuss equity and quality in educational policies, identifying how crisis has impacted in the equality of opportunities to access different channels and levels within each educational system and the outcomes of the implementation of educational policies.
B.1. Equity: Policies and achievements (maximum 15 pages)
Start this section by discussing the evolution of equity according to your national context and educational system. For the remaining parts, please focus on the evolution of policies
regarding educational access and success. Analysis should include social support measures to socio-economic disadvantaged students/families; family´s expenditure on education;
7 students with disabilities; pathways to higher/tertiary education, vocational and training education; adult education; lifelong learning actions.
Recommended indicators:
1. Percentage of students with schooling social support – organize data by educational level attendance and nature of the institution: public or private.
2. Expenditure per student (%);
3. Pre-schooling enrolment rates (if possible, organize the data by nature of institution: public or private; mean age of attendance, and for those with more than one year enrolment)
4. Participation rates of children with disability (%)
5. Participation rates of students with ethnic minority background, immigrants and descendants of immigrants;
6. Early School Leaving Rate (%) (if possible, by gender and social origin, ethnic minority background, immigrants and descendants of immigrants)
7. Selectivity on tracking and transitions processes;
8. Retention Rates (%) (whenever possible, by school level, gender, age, social origin, ethnic minority background, immigrants and descendants of immigrants);
9. Specific national/political programmes for improving scholar performance (ex in Portugal Territorialização de Politicas Educativas de Intervenção Prioritária (TEIP – Territorialization of Priority Education Policies Intervention), National Reading Plan; Offer and types of Curriculum Enrichment Activities);
10. Population with the upper secondary attainment (%) 11. Population with the tertiary attainment (ISCE 5 A or B) (%)
12. Percentage of population aged 25-64 below secondary attainment (whenever possible, by gender, and social origin, ethnic minority background, immigrants and descendants of immigrants);
13. Percentage of adults within vocational and educational system; 14. Global evolution of PISA results (since 2000 until 2012)
Final notes on Equity and Quality: Orientation and Processes (maximum 10 pages) (“old” B2)
Present the final balance of the report by referring and commenting the most relevant indicators, trends and policy measures analysed in the previous sections. Here refer to those indicators, trends and policies which revealed to be crucial in explaining and understanding the orientations of each national educational system, evaluating them in terms of quality and equity during the period under analysis.
In sum, educational quality is here examined from the perspective of the performance of the education system, mainly the guaranty of equity. The impacts of the crises, if any, should be emphasized. The notions of orientations and processes are not to be the object of analysis themselves, but to guide the choice of the main facts and indicators of the concluding remarks. This is to say that these indicators are showing trends in policy orientations and the way these trends are being affected by the crisis.
8
Data Analyses and presentation:
In general terms, data must cover the evolution from 2000 to the present (the most recent data available). Data should distinguish whenever possible two periods: before 2008, and since 2008 onwards – i.e., before and after the financial crisis in Europe. This diachronic analysis should express the potential impacts of the crisis in the evolution of the indicators, measures and policies under analysis.
Glossary
Early School Leaving
Generally refers to a person aged 18 to 24 who has finished no more than a lower secondary education (or the equivalent of compulsory education) and is not involved in further education or training; their number can be expressed as a percentage of the total population aged 18 to 24.
School Drop-out
Students who drop out the educational system in a single year without completing or repeating the attended grade level
Grade retention
Practice in which children are required to repeat a grade level in school because failing to meet required benchmarks or grade level standards.
Gini coefficient of equivalised disposable income
The relationship of cumulative shares of the population arranged according to the level of equivalised disposable income, to the cumulative share of the equivalised total disposable income received by the population.
At-risk-of-poverty rate
The share of people with an equivalised disposable income (after social transfer) below the at-risk-of-poverty threshold, which is set at 60 % of the national median equivalised disposable income after social transfers.
Child poverty rate
The percentage of children living in households below 60% of equivalized median income before housing costs.
9
Immigrants
Foreign-born individuals of at least one foreign-born parent, independently of one‘s own nationality.
Ex: Individual born in Cape Verde of non-Portuguese parents, coming to Portugal when completing 7 years old, independently of his current nationality.
Descendants of immigrants
Individuals born in the country, who are children of at least one foreign-born parent, independently of parents’ and of one‘s own nationality.
Ex: student born in Portugal, children of foreign-born Cape Verdean parents who naturalized Portuguese recently (or not), independently of students’ current nationality.
Ethnic minorities of non-immigrant background
Nationals born in the country, who share a distinctive culture, and have non-immigrant background from their parents.
10
2. Meetings and documents for Partners
2.1 - First Meeting Agenda 1st Workshop
Meeting Agenda – 1st Workshop
Project: Educational Challenges in Southern Europe Date: 22nd and 23rd of November, 2013
Location: ISCTE-IUL, Lisbon Hours:
22, Friday: 15h30 – 17h
17h – 17h20 – Coffee Break 17h20 – 19h00
Preparation for Meeting:
Please read and reflect on: Analytical Grid proposal;
Please bring: your proposals concerning your own objectives and perspective;
Agenda Items
1- A briefly presentation of our Project and objectives.
2 - Stabilization of the Analytic Grid, dimensions and indicators.
3- Discussion and debate of topics to create a new analytical field considering Policy-Making in Education and main actors involved.
4- Discussion on Reports Structure.
5- Discussion on Dates (please consider the timetable)
Project’s email and platform for communication:
[email protected]– please consider “Google Drive” for sharing documents.
Pass: crisis2013
Portuguese Team contacts:
22 23 23, Saturday: 9h30 – 11h 11H-11h20 – Coffee Break 11h20-12h
11 João Sebastião: [email protected] ; phone: 969053827
12
Project title: Educational Challenges in Southern Europe. Equity and efficiency in a time of crisis
Task Task Denomination
Partner responsible for
task
Partners involved
in task Phase 6 7 8 9 10 11 12 1 2 3 4 5 6 7 8 9 10 11 12 1 2 3 4 5
1 Analytical Grid CIES-IUL CIES-UIL 1
2 Final Analytical Grid CIES-IUL All 1
3 Reports Structure CIES-IUL All 1
4 Collecting Data CIES-IUL CIES-UIL 2
5 Collecting data for National Studies CIES-IUL All 2
6 National Studies Production CIES-IUL All 2
7 Comparative Analysis CIES-IUL CIES-UIL 3
8 Results and Final Seminar CIES-IUL CIES-UIL 3
Reports
CIES-IUL
All
Meetings 1st 2nd 3rd
P - briefly progress report N - National Studies F - Final Report 2013 2014 2015 F N P
13 2.2- First Meeting Topics of Discussion
Educational Challenges in Southern Europe. Equity and efficiency in a time of crisis Research line: Crisis; Education Systems; Southern Europe; Policy-Making
Context
Economic and budget crisis are affecting educational and training systems in southern countries. Signs of public disinvestment on education are being detected.
In what ways these impacts can jeopardize the achievement of common educational and social objectives in Europe (Agenda 2020), as well as preventing the overtaking of the crisis, are some of the issues that these countries are facing.
Objective
Develop a systematic survey of the impacts of this crisis:
In education and training systems and countries performance.
On policy-making.
On system’s ability and capacity for promoting educational equity.
Methodology and analytical focus
Phase 1 Performance on education:
Collecting indicators – Common analytical grid Phase 2 Change and Innovation in Policy making:
Domestic policies; European tendencies; Policy trends.
Phase 3 Effects of the crisis on the system’s ability and capacity for promoting educational equity:
Comparative analyses
14 2.3 - First Meeting - Analytical Grid for Discussion
Educational Challenges in Southern Europe. Equity and efficiency in a time of crisis
Introduction and Main Objective
Over the last decades, the performance of the educational systems in Southern Europe showed, in different rhythms and paths, a significant improvement and convergence towards the average European schooling rates. This tendency can be illustrated trough the evolution of some key indicators as the early school leaving, which has declined substantially or better performances in tertiary education and long life learning. However, when compared with other member states, performance remains below European levels showing that a long path of educational efforts is still necessary to accomplish the goal of achieving educational levels near the European average. In this scenario the economic and budget crisis are affecting educational systems in southern countries, as signs of public disinvestment on education can be widely detected. In what ways these impacts can jeopardize the achievement of common educational and social objectives in Europe (Agenda 2020), as well as preventing the overtaking of the crisis, are some of the questions that these countries are facing.
Considering the previous issues, we aim to develop a systematic survey of the impacts of this crisis on the performance of educational systems, the resources allocation and to identify the solutions which are proposed in each country to confront the constraints imposed by the economic and financial recession and the pathways to further educational development.
Analytical focus
Considering the crisis and its impacts on the education system performance and on policy-making trends, as the key axes of the project, we’ve been working in an analytical framework with three major dimensions:
1) Indicators of Performance (2000 – 2013) – collecting and analysing major indicators on access, success and quality within the Educational System, as well their dynamics and key agents involved;
2) Change and Innovation in Policy making (2000 - 2013) – establishing a timeline in what has been produced on the education policy field (2000 - Lisbon Strategy), which includes international demands or agendas; establishing or detecting differences on policies or even trends in educational policy; and at last but not least, developing the diachronic perspective as a comparative method for analyses ;
15 3) Effects of the crisis on the system’s ability and capacity for promoting educational equity. This sketch of an open analytical framework assures that national specificities are considered and accepted by all the analytical dimensions and, simultaneously, that the comparative goal is also achieved, what will allow us to describe the effects of the crisis on education and predict tendencies of evolution.
Considering these dimensions a set of questions can be developed:
With the advent of the information society and the acceleration of the globalization processes, has there been a shift in the goals attributed to education and training systems in Southern Europe? Are these changes oriented to maintain social selectivity and ensure a set of qualified workers according to the requirements of a segmented market, or do they aim to produce qualification for the entire population by revealing a comprehensive line on policy-making and on educational agenda? Which will be the risks of the neo-liberal agenda and the austerity politics on education and its particular impacts on the trajectory of convergence of the Southern European countries? As international financial entities are forcing southern European countries to cut down their funding on education, the challenge remains how to guarantee efficiency and equity in the educational systems.
Finally, it will be relevant to capture the ideological dimension of this process: concerning the impacts suggested by the severity of the economic crisis, can we differentiate the effects resulting from measures to combat the budget crisis from the options taken independently of this particular context, which provided an opportunity for the reorganization and reorientation of policy-making on education?
Methodology and Project Phases
As it has been determinate on our proposal that the research will be drawn upon comparative policy methodologies, and will be supported by sources for data collecting such as: Eurydice, Eurostat, OECD, ESSROS (The integrated system of social protection statistics), CEDEFOP. It’s intended to combine this type of information with data from national studies and evaluations, organized in a common analytical framework. This will enable not only the analysis in depth of the education systems in southern Europe, but also to observe how each one are being affected by the crisis and what answers were found to deal with it.
16 Data collection will be driven by several questions or topics that should be answered through the strategic indicators identified on the table. Teams are also encouraged to use other indicators or data considered relevant for their national context. These questions have an open approach but, simultaneously, a well delimited compared framework. In fact, one of the most innovator factors to be considered on our comparative methodology is the actual partnership within the analytical steps, which can introduce a more qualitative and comprehensive line towards each national context, rather than focusing only on major data provided by international reports or networks, or even, on databases that not include specific national evidences.
We can identify mainly 3 phases of the project: The current phase, which includes:
Step 1 –The Analytical Grid proposal and collecting data. Step 2-Template and reports structure
The workshop will enable the stabilization of the national reports structure underlying analytical grid. Firstly, data has to be collected through some major statistical indicators using international reports or databases. Secondly, national teams need to considerer their own national contexts, meaning that, whenever teams find difficulties in collecting data, new options must be relocated in order to maintain the target goals. Thirdly, teams must take into account other dimensions in order to establish the analytical grid. These dimensions are more related with policy analysis, as well, with the key agents in policy-making. It provides a much more dynamic vision that otherwise wouldn’t be capture, if we only develop a statically approach. Once this dimension are both connected with European orientations as well domestic politics, and in order to capture all the essential domains, this grid must be developed at the workshop with all members contributes. Second phase:
Step 3- Reports Production And final phase
Step 4- Comparative analyses and main results.
17
Analytical Grid
Dimension Analytical Topics Questions Key Indicators
System description
Describe the Education System of your country considering these topics:
Institutional Design Organization Structure Network
historical patterns of education development Governance Agents Policy-Making Funding National covering Territorial distribution Budget transferences Families contributes
Contributes from European Social Fund
-Public expenditure, % GDP - Structure of the State Budget:
Values -Budget, in% GDP, spent per student;
-Values-budget as% of GDP by educational area/ teaching level; -Weight-spending on education in the family budgets;
18
Guaranty of the access
Public and Private Sectors
Their extension in Education Systems
Considering the questions of access, describe the development and the impacts of public and private sectors in Education System. Please considerer the years between 2000 and 2013 and the following topics:
a) Their extension and weight considering each teaching level and educational area;
b) State Funding or investment; c) Availability and choice of schools; d) Level of demand;
e) Level of privatization;
f) Evolution of the policy-making – considerer the major changes and key agents involved (for instance: teachers, families, UE…)
- Distribution of School Places;
- Funding and public expenditure;
- Students enrolment rates;
Infrastructures and equipment Sufficiency
National covering /Schools Network Distribution of equipment
Quality of facilities
Considering the questions of access and the development of
infrastructure and schools equipment, between the years 2000 – 2013, describe the following topics:
a) Coverage of the network, referring to the number of establishments (public and private; by areas and levels of education ;)
b) Significant regional differences; c) Occupancy rates;
c) Distribution of equipment at schools and asymmetries – please take in consideration the asymmetries regarding, for example, the
distribution of material by educational areas, scientific and technical areas...;
d) The existence of strategic programs for schools renewal or modernization or even specific investments on equipment; e) Network of schools prepared and equipped for areas of special education or other specific areas;
f) Evolution of the policy-making – considerer the major changes and key agents involved (for instance: teachers, families, UE…)
- Number of schools – total; type; teaching level; residence area
(public/private)
19
School offer and demand School offer
Conditions for the Access Places
Universally
Evolution of the demand
Considering the questions of access, describe the development of school offer and demand, between 2000 and 2013, in regard to the following topics:
a) Types of offer – regular; alternative pathways; VET system… b) Number of schools places and enrolment ratios
c) Distribution of school offer considering the availability of schools d) Levels and conditions of access (considerer regular pathways, alternative pathways, VET system and special education)
e) Relate the early school phenomena with the evolution of the offer f) Relate the priorities established within a EU context and the investments conducted in your country political agenda
g)Evolution of the policy-making – considerer the major changes and key agents involved (for instance: teachers, families, UE…)
- School Enrolment ratio – type/cycle; students ex and age;
-Attendance rates;
Schooling Social Services Expenditure Families
Students access and success
Considering the questions of access, describe the development of Social School Support and families aid strategies, between 2000 and 2013, in regard to the following topics:
a) Levels of public expenditure allocated to Social School Support. b) Evolution of beneficiary families – numbers and brief
characterization.
c) Weigh of the initial social conditions at students success and access – consider specific groups such as ethnical minorities; immigrants; persons with disability
d ) The main and most applied modalities of Social School Support - food support; accommodation; economic aid; assistance in accessing curriculum materials (books, specific material) ...
e) Measures attending the modalities of Social School Support. Who is entitled to what and why?
f) Relate the levels of access to the education system and the application of measures within the Social School Support.
-Public expenditure on Social school support as% of GDP;
- State expenditure on Social School Support, categorized by modality;
20
g) Evolution of the policy-making – considerer the major changes and key agents involved (for instance: teachers, families, UE…)
Guaranty of Success Human Resources Numbers Sufficiency Qualification Training
Considering the questions of success and the development of Human Resources at schools and education in general, between the years 2000 – 2013, describe the following topics:
a) Numbers: teachers; higher technical; administrative staff… b) Ratio Teachers/Students …
c) Ratio Special Needs Educational Professionals/ Students with Special Needs
d)Teachers Training and qualification e) Policies for professional access f) Teachers Unemployment rates
g) Priorities on teacher training, staff mentoring (influences)
h) Evolution of the policy-making – considerer the major changes and key agents involved (for instance: teachers, families, UE…)
-National numbers of staff and teachers;
-Ratios;
- Unemployment rates
Educational strategies for school success Sectorial and strategic Plans Curriculums
Results
Considering the questions of success and the development of
strategies to support students and their results, between the years 2000 – 2013, describe the following topics:
a) Sectorial plans designed to combat school failure b) Sectorial plans or curriculum areas intended to support study and teaching
c) Priorities on the design and development of scholar curriculums; d) Impact of tests and benchmarking strategies on scholar results; e) Principal indicators of success such as: Early Scholar Leaving; Graduation rates; Completion rates; results at international students assessments (PISA, TIMMS..)
f)Evolution of the policy-making – considerer the major changes and key agents involved (for instance: teachers, families, UE…)
- Attendance rates
- Early scholar leaving rate -Graduation rates;
-Completion rates; -Results on PISA, TIMMS…
21
Policies on Education
Sectorial Programmes Educational Projects
Considering the questions of success and the Social Policies on Education, between the years 2000 – 2013, describe the following topics:
a) Programs designed to combat school failure and prevention of early school leaving;
b) Educational Projects to combat failure and early school leaving; c) Territorial distribution of these programs considering the school network;
d) Evolution of the policy-making – considerer the major changes and principal actors involved (for instance: teachers, families, UE…)
-Attendance rates;
Families Strategies
Investment at education Parental Participation
Considering the questions of success and families strategies on education, between the years 2000 – 2013, describe the following topics:
a) the use of extracurricular school support (eg, study tutoring); b) Importance of complementary and extra-curricular structures, for supporting school studies - Study Centers, Tutoring Centers.. c) Levels of parental involvement and participation, formal and informal, at the educational system,- parents associations, representatives on school bodies;
Quality assurance
Evaluation and monitoring
System Schools Teachers
Considering the questions of success and evaluation, between the years 2000 – 2013, describe the following topics:
a) Mechanisms of evaluation applied to school´s system in general - who does this assessment? Which entities? Does it have an external component? Who provides the parameters?
b) Monitoring school success. How? (national and international mechanisms)
c) Monitoring the success of sectorial programs. How? d) Evaluation system for teachers
- assessments processes and results
22
e) System for assessing the quality of infrastructure and equipment f) Strategic results
23 2.4 – Second Meeting
Agenda – 2nd Workshop
Project: Educational Challenges in Southern Europe Date: 10th September, 2014
Location: ISCTE-IUL, Lisbon (room still to be confirmed ) Hours:
9h30 – 11h
11h – 11h15 – Coffee Break 11h15 – 12h30
Preparation for Meeting:
Please bring: your country report, independently from its stage.
Agenda Items
1- Country reports
Preliminary version: state of art, delays, questions and suggestions concerning both the guidelines and the data sent for the national reports;
Final version: deadline, before the end of 2014;2 - Stabilization of the Analytic Grid, dimensions and indicators.
2- Interview with a national expert on educational policies: guidelines, script, questions and suggestions;
3- Final report: guidelines, state of art, questions and suggestions, and deadlines 4- Final meeting and conference: guidelines, structure, suggestions, and deadlines
Portuguese Team contacts:
João Sebastião: [email protected] ; phone: (00351) 969053827
Ana Raquel Matias: [email protected]; phone: (00351) 929016124 Ana Rita Capucha: [email protected]; phone: (00351) 917651262
24
25
a) Portugal
ECSE Research project: “Educational Challenges in Southern Europe.
Equity and Efficiency in a Time of Crisis” (2013-2015)
University Institute of Lisbon
CIES-IUL
Research team: João Sebastião (coordinator), Luís Capucha, Maria Álvares, Patrícia Ávila, Pedro Abrantes, Susana da Cruz Martins, Ana Rita Capucha, Pedro Estêvão, Ana Raquel Matias, Sofia
26 contents
list of tables and figures ... 27
a1. National context description ... 29
annexes ... 29
a2. Educational system ... 40
anexes... 49
a3. Processes and mechanisms of monitoring and evaluating the educational system ... 60
b1. Equity section ... 70
Participation and access ... Erro! Marcador não definido. adult’s education initiatives... Erro! Marcador não definido. school population diversity – ethnical background, immigrants and special education . Erro! Marcador não definido.
Attainment and schools results – levels of success and failure ... Erro! Marcador não definido. describing the population attainment: indicators ... Erro! Marcador não definido. retention rates indicator ... Erro! Marcador não definido. pisa results indicator... Erro! Marcador não definido. strategies for promoting success and equity ... Erro! Marcador não definido. educational expenditure /funding ... Erro! Marcador não definido. annexes ... 86
b2. Conclusive notes ... 91
27 List of tables and figures
Tables
A1. National context description
Table A1.1 Gini Coefficient, in EU27 and Portugal (2000-2012)
Table A1.2. Risk of poverty rate (%), by sex, in Europe 27 and Portugal, 2000-2012 Table A1.3 State Expenditure on Education, as a % of GDP
A2. Description of the educational system
Table A2.1 Annual change rates in the number of enrolled young secondary
Table A2.2 Number of Resource Centres for Inclusion, in Mainland Portugal, between 2009 and 2014
Table A2.3 Number of Resource Centres for Inclusion, by NUTS 2 regions. 2013/2014 Table A2.4 Applicants and holders (No.) of financial support (subsídio) for special education
B1. Equity: Policies and achievements
Table B1.1 - Pre-School Enrolment - Pre-primary education (level 0), % in relation to the same age total population and in relation to the same age total population
Figures
A1. National context description
Figure A1.1 Men and women at risk of poverty rate, in EU-27 and Portugal (2000-2012). Figure A1.2 Evolution of educational attainment (%), by sex
Figure A1.3 Evolution of educational attainment (%), by age groups Figure A1.4. Evolution of the employment rate (%),by sex, age Figure A1.5. Evolution of the unemployment rate (%),by sex, age
Figure A1.6. Evolution of the employment rate (%), by age groups and ISCED Figure A1.7 Evolution of the unemployment rate (%), by age groups and ISCED Figure A1.8 Private expenditure on education as % of GDP
A2. Description of the educational system
Figure A2.1. Number of teachers in Portugal, for all educational levels, 2000-2012 Figure A2.2 Number of teachers in Portugal, by all educational levels, 2000-2012 Figure A2.3 Number of students in Portugal, by educational levels, 2000-2012
Figure A2.4 Evolution of the number of young people enrolled in secondary education and vocational courses, public and private, in mainland Portugal (2000-2012)
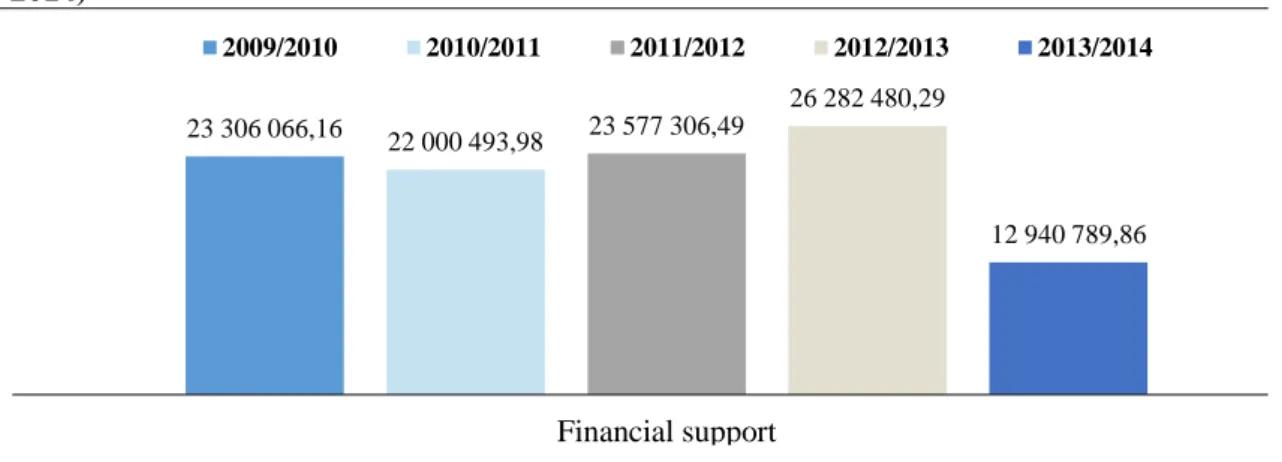
Figure A2.5 Evolution of the number of young people enrolled in vocational education Figure A2.6 Trend in percentage of youth enrolled in secondary vocational education Figure A2.7 Trend in percentage of youth enrolled in secondary vocational education Figure A2.8 Financial support for special education (in EUR, mainland Portugal (2009-2014) Figure A2.9 Evolution of the number of students with SEN, by cycles and levels of education, Mainland Portugal (2009-2014)
Figure A2.10 Participants in early education - as % of inhabitants of the corresponding age group, in Portugal, (2000-2012)
Figure A2.11 Participants post-secondary non-tertiary education- as % of inhabitants of the corresponding age group, in Portugal, (2005-2012)
Figure A2.12 Participants first and second stage of tertiary education- as % of inhabitants of the corresponding age group, in Portugal, (2000-2012)
Figure A2.13 Participation/ Enrolment in education by sex age ranges, all ISCED (1-6) - as % of corresponding age population
28
Figure B1.1 - Financial aid to pupils as % of total public expenditure on education, by ISCED level, in Portugal and EU-27 (2000-2010)
Figure B1.2 - Annual expenditure on public and private educational institutions per pupil/student compared to GDP per capita, based on full-time equivalents, in Portugal (2000-2010)
Figure B1.3 Early School Leaving by gender and labour status (%), in Portugal
Figure B1.4 Percentage of total population aged between 15 and 74 with Upper Secondary and Post-Sec
Figure B1.5 Participation/ Enrolment in education, by sex, of students at ISCED level 3-GEN - as % of all students at ISCED level 3, in Portugal ondary attainment, in Portugal
Figure B1.6 Percentage of total population aged between 15 and 74 with tertiary attainment, in Portugal
Figure B1.7 Percentage of population aged 25-64 below secondary attainment, in Portugal (2002-2012)
29
A1. National context description
While making an effort to join the euro zone and participating in the process of the new currency, Portugal featured among countries with the lowest levels of growth, productivity and competitiveness, besides expressing historical structural problems. The qualification structure of the population, maintaining great shares of individuals with lowest levels of qualification, along with a progressive retraction in the demographic configuration - less younger population and increase of the older ones, with direct effects on the structure of the labor market and also pressing our activities rates.
Even before the crisis of 2007/2008, international financial agencies such as IMF argued that Portuguese economy had an anemic productivity and a low economic growth, with a large budget deficit and likely prospect of competitive disinflation (Blanchard, 2006 quoted by Pedroso 2014). We are now testifying that, after the austerity imposed by the Memorandum of Understanding, the above mentioned problems were aggravated, launching the country into recession, with devastating consequences both to economic and social conditions (ibidem). With the outcome of the crisis in 2008, Portuguese banks were majorly affected and levels of external debt increased dramatically, as pursuing credits became extremely difficult. Since the first negatives evaluations made by the rating agencies – such as the ones of Moody´s agency, marking Portugal with a “junk status” at 2011 – Portugal entered in a vicious cycle, with the growth of public debt and of the deficit , a fragile balance trade, which were already fragile since the euro adhesion, incapable to uphold a return to growth, and the austerity adopted as the main path to overcome the crisis, compromising Portuguese families and workers. What was considered to be a financial crisis quickly become an economic crisis bursting into an ongoing socioeconomic crisis.
In the period considered, Portugal had two centre-left governments formed by the Socialist Party (XVIInd Constitutional Government 2005-2009 and XVIIIrd Constitutional Government 2009-2011) which were followed by a centre-right coalition government (XIXth Constitutional Government, 2011 - until present). These offices worked alongside with the EU implementing policies and adjusting programs. In 2010, they searched for troika assistance [European Commission (EC), European Central Bank (ECB), and International Monetary Fund (IMF)]. The late austerity measures affected mainly the working classes, with massive dismissal in public and private sector as well as cuts on public policies (salaries, allowances, pensions and other social benefits) (Abrantes, 2014).
30
In general terms, national reports consider unemployment to be one of the major negative consequences of the crisis, with no impression of what is to be expected from social protection policies. Unemployment rates increased considerably - especially youth unemployment - leading to an increase in social inequality. According to Eurostat data, long-term unemployment represented 63,5% of all unemployment in early 2014. Ongoing impoverishment, job insecurity and deprivation acute of materials among families (Cantante, Carmo, 2014; Obervatório das Desigualdades) are the main consequences.
Education was not exception, considering the funding policy and specific educational sectors, such as adult’s education. On the contrary. Although Portugal has a non-linear trend in the evolution of its education indicators and outcomes, we can highlight the effort to enter a pathway of recovering in the last decades, particular since 2001 with the Lisbon Agenda advent. More recently, in the period of 2005-2009, we can observe important signs of progress and convergence toward European standards, mostly in Adults education, the Vocational Education, the development of Science and the tertiary education and attainment.
In the national context, income inequalities are changing the country’s social structure and creating relatively enduring gaps in the social tissue.
Considering the present-day context, the scenario becomes alarming as the austerity policies are having impacts on redistributive schemes and national wages. An analysis of the "Gini Coefficient" for the last 12 years shows improvements in the income inequality levels for all income groups (from 36% in 2000 to 34,5% in 2012). Nevertheless, with the peak of the economic crisis 2009/2010 and the implementation of the austerity package in 2011/2012 we observe a slight increase in the Gini coefficient (Table A1.1). We may assume, however, that the level of income inequality and distribution among all income groups has always been more significant in Portugal then in the EU 27 average. Similar conclusions can be drawn when analyzing the “At-risk-of-poverty rate”, showing a decrease between 2000 (21%) and 2012 (17,9%), though remaining higher when compared to EU 27 average (17.1%), and higher among women (18,2% against 17,5% for men); in 2012 these rates demonstrate Portugal’s higher risk of poverty compared to the EU27, even if both have been progressively approaching (Table A1.2 and Figure A1.1).
Media and Portuguese agencies of statistics studies and inequalities studies have been reporting, in a regular everyday basis, poverty and social inequalities as a major concern in Portuguese society, as the indicators are reaching “historical” levels. For
31
instance, late INE´s report (2014) stated that one in five Portuguese is at risk of poverty, 2 million Portuguese living below poverty line and more than a quarter living in great material deprivation (INE, Rendimento e Condições de Vida, 2014). Recent OCDE’s reports (OECD, "Doing Better for Family", 2011) showed that Portugal was the 8th OECD´s country to have the highest rate of “child poverty risk”. Except for a decrease between 2004 and 2007 (from 24,2% to 20,8%), Eurostat data shows a relatively persistent high rate which has been increasing ever since, up to (21% in 2012), remaining closer to the EU27 average (Figure A1.2).
Social inequality levels are related with the education context. In a long term, education has its impacts in social and economic context of a country, for instance considering poverty and the possibility of overcoming the familiar background, but, on the other hand, we can assume that poverty has almost an immediately impact in Education – for instance, in relating the scholar results with social background or, the levels of resources, family´s income.
As we have seen, despite the significant improvements in educational results and in the education system´s performance (eg., Early School Leaving results) an educational deficit persists since the policies that produced the good results of the last decades were reversed. it is predictable that the low levels of educational attainment among Portuguese population are continuing to be particularly onerous for the persistence of social inequalities. Even if we detected improvements between 2000-2012 (Figure A1.2) considering the population aged between 25-64 -the numbers of those with lower secondary (0-2 ISCED) attainment decreased 19,8 p.p, while those with higher education (5-6 ISCED level) increased 12,5 p.p), - data stills shows a significant proportion of this segment – 25-64 - with only the primary or basic educational attainment (ISCED 1) - 60.8% in 2012; or the secondary or post-secondary non-tertiary education (ISCED 3-4) 20,2% in 2012; and 19% with higher education (ISCED 5-6) in 2012. Moreover, for those with higher education aged between 25-64 years old, women are clearly more predominant (22,5% against 15,3% of men) (Figure A1.2).
Considering the smaller range of age groups, we observe, on one hand, that primary or basic is more significant in oldest age groups with 55-64 and 45-64 (80,2% and 72,8% respectively); while youngsters (25-34) are the more representatives in higher education attainment (28,8% ISCED 5-6). Nevertheless, these younger groups still present considerable proportion (42,1%) of individuals with only the primary or basic level (Figure A1.3). This is a structural problem linked with the historical expansion and
32
dynamics of our schooling process. Even though this is a diminishing tendency, we are still facing the early school leaving problem, which stands as one of the highest of the EU, as well as with a labor market structure that absorbs low qualified youngsters. However, we may assume that this relation, between labor market and low qualified people, may be different in this recent context of crisis where major unemployment rates are mostly affecting the youngest.
The employment for the same period indicates a considerable decrease during the last 13 years. For 25-64 year old, employment rate decreased from 75,5% in 2000 to 68,3% in 2013, with 2008 representing the most evident phase of this appalling change. Generally, women were the most affected (64,9% in 2013), though gender differences were already observed in 2000 (66,9% against 84,5% for men) (Figure A1.4). On the course of this decrease, we sign a sharp rise in unemployment rates: for the same age group the figures were 3,6% in 2000 reaching an astonishing 15,3% in 2013 (increased by 11,8%) (Figure A1.5.). Here, the youngest ones were the most affected: for those aged between 15-24 there was an increase of 28,9 %, with a current rate of 37,7%; while for those aged 25 -29 there was a climb of 17,5 %, with a rate of 21,9% in 2013 (Figure A1.5.).
When analyzing the employment and unemployment rates by individuals’ educational attainment, we can confirm, on the one hand, that younger individuals (aged 30-34) were strongly affected by the decline in employment rates, particularly when holding a higher educational level - showing a decline in the employment rate of 15,3%; while this was of 10,9% for those who held basic education. Nevertheless, and on the other hand, qualification and education remains an important tool for preventing employment decline and unemployment: for individuals aged 25-29 with basic and primary education, employment rate dropped significantly (23,1% less), while those holding a higher education diploma decreased slightly less (16,5 %) (Figure A1.6.). Even though unemployment rates became high among youngers with highest qualifications (20,6% of those aged 25-29 having higher educational attainment are unemployed, compared to 37,8% of those aged 15-24 with the same education degree), the lowest educated individuals tend to be more critical for maintaining unemployment rates, meaning that more education still prevents job loss. For instance, considering those aged between 25-29, unemployment rates increased about 12,1% when having higher education, while significantly more (about 21,5%) for those with primary education (Figure A1.7).
33
Since 2005, Portuguese educational policies invested in the increase of school attendance and attainment, as well as in the improvements of the schooling results and the education system performance. Portugal had been following a path of convergence towards European standards, where policy was marked by traces of continuity in the demand for these results and consequent convergences. This occurred also despite some differences seen in domestic policy-making, characterized by two main periods: From 2000-2004, a stage mostly marked by significant legislative production and the expansion of schooling; from 2005-2010, a stage marked by policies targeting the increasing of school success and the modernization of schools’ infrastructures, and respective results. During the last decade, we may highlight the increase of compulsory education to 12 years of schooling; results in fighting against early school dropouts; the reinforcement of adults’ education and training options and adult’s educational attainment; and the development of the vocational and training courses.
Entering in the crisis period, several signs of reversal can be noticed, not only due to the financial retraction, but also due to the recent political choices. The withdrawal of the existing program qualifying adults, “Novas Oportunidades” leaving the system without any valid option; the introduction of “curricular learning goals” in specific school subjects; the disappearance, or restructuring, of measures supporting students’ success (eg. National Plans for reading and teachers training in math); and a shift in the educational paradigm characterized by the introduction of a teaching-learning system based on more selective exams at all levels and on the gradual depreciation of competences in the learning processes.
Nevertheless, the most prominent impacts of the crisis are yet to be understood, specifically, when analyzing the public expenditure on education (analyzed further on section 2). Expenditure on education as a percentage of GDP remained approximately the same until 2010, with a slight increase on the private expenditure (0,45% in 2012) (Figure A1.8). However, national data sources indicate a tendency of significant cuts: National Statistical Institute (INE) showed a decrease of 1,2% p.p. on educational public expenditure between 2000 and 2012 (representing a negative growth on expenditure of 20%); National Budget Direction (PORDATA/DGO) showed a decrease of 1,1% for the same years (representing a negative growth on expenditure of 22%),. The decline is explained mostly by the expenditure retrenchment: decrease of employed teachers (Table A1.3), together with the salary reduction in public administration along with other current
34
expenses and the restrictions implemented in national programs like “Parque Escolar”, particularly responsible for the renovation and modernization of secondary schools.
By pointing out clear signs of regression in Portugal, we argue that budget cuts and recent political choices may jeopardize some of the previous achievements (eg., increase of adult’s qualification and training and decrease of early school dropouts). Lastly, taking into account the effects education has on overcoming crisis, this should be a highly protected sector.
Annexes
Table A1.1 Gini Coefficient, in EU27 and Portugal (2000-2012)
2000 2001 2002 2003 2004 2005 2006 2007 2008 2009 2010 2011 2012
EU27 : : : : : 30,6 30,2 30,6 30,8 30,4 30,4 30,7 30,5
Portugal 30 37 : : 37,8 38,1 37,7 36,8 35,8 35,4 33,7 34,2 34,5
Source: Eurostat Note: : = Not available
Table A1.2. Risk of poverty rate (%), by sex, in Europe 27 and Portugal (2000-2012)
Total Males Females
EU 27 Portugal EU 27 Portugal EU 27 Portugal
2000 : 21 : 19 : 22 2001 : 20 : 20 : 20 2002 : 20 : : : : 2003 : 19 : : : : 2004 : 20,4 : 19,2 : 21,6 2005 16,4 19,4 15,6 18,7 17 20,1 2006 16,5 18,5 15,7 17,7 17,2 19,1 2007 16,5 18,1 15,7 17,2 17,3 19,0 2008 16,4 18,5 15,5 17,9 17,4 19,1 2009 16,3 17,9 15,4 17,3 17,1 18,4 2010 16,4 17,9 15,6 17,3 17,0 18,4 2011 16,9 18 16,1 17,6 17,6 18,4 2012 17,1 17,9 16,5 17,5 17,8 18,2 Source: Eurostat Note: : = Not available
35 80,6 71,8 60,8 10,5 13,9 20,2 8,8 14,3 19 0 20 40 60 80 100 2000 2008 2013 2000 2008 2013 2000 2008 2013 0-2 3-4 5-6
Total Males Females Educational level 0-2: - 19,8
Educational level 3-4: + 9,7 Educational level 5-6: + 10,2
Figure A1.1 Men and women at risk of poverty rate (60% of median equivalised income after social transfers), and youth age less than 16 years old, in EU-27 and Portugal (2000-2012).
Source: Eurostat
Note: Data for EU27 for 2000 is not available
Figure A1.2 Evolution of educational attainment (%), by ISCED and sex, between 2000 and 2013, in Portugal 5 10 15 20 25 30
Total Male Female Pop. <16 Total Male Female Pop. <16
EU-27 Portugal
36
Source: Eurostat
Figure A1.3 Evolution of educational attainment (%), by ISCED and age groups, between 2000 and 2013, in Portugal
Source: Eurostat
Figure A1.4. Evolution of the employment rate (%), by sex, age (25-64 years) and among youth (15-29 years), between 2000 and 2013, in Portugal
Source: Eurostat 63,8 53,3 42,1 20,3 23,5 29,5 15,9 23,2 28,3 79,6 71,3 56,7 11,8 14,1 23,0 8,5 14,5 20,3 85,6 80,0 72,8 7,2 10,1 13,6 7,2 9,9 13,6 92,0 86,5 80,2 3,6 5,8 8,7 4,4 7,7 11,1 2002 2008 2012 2002 2008 2012 2002 2008 2012 0-2 3-4 5-6
25 to 34 years 35 to 44 years 45 to 54 years 55 to 64 years
68,3 64,9 71,8 22,3 68,0 0 10 20 30 40 50 60 70 80 90 100
Total Female Male 15 to 24 years 25 to 29 years
37
Figure A1.5. Evolution of the unemployment rate (%), by sex, age (25-64 years) and among youth (15-29 years), between 2000 and 2013, in Portugal
Source: Eurostat
Figure A1.6. Evolution of the employment rate (%), by age groups and ISCED, between 2000 and 2013, in Portugal Source: Eurostat 15,3 15,2 15,4 37,7 21,9 0 5 10 15 20 25 30 35 40
Total Female Male 15 to 24 years 25 to 29 years
2013 2008 2000 4 4 ,4 3 4 ,1 1 6 ,2 8 3 ,8 7 9 ,4 6 3 ,3 8 2 ,2 8 2 ,0 7 1 ,3 3 3 ,2 3 2 ,6 2 7 ,5 7 7 ,6 7 4 ,9 7 0 ,9 9 0 ,9 8 6 ,6 8 0 ,6 7 3 ,3 5 6 ,1 3 6 ,0 7 0 ,9 81 ,2 7 0 ,5 80 ,6 9 2 ,0 8 0 ,7 2 0 0 0 2 0 0 8 2 0 1 3 2 0 0 0 2 0 0 8 2 0 1 3 2 0 0 0 2 0 0 8 2 0 1 3 1 5 T O 2 4 Y E A R S 2 5 T O 2 9 Y E A R S 3 0 T O 3 4 Y E A R S 0-2 3-4 5-6
38
Figure A1.7 Evolution of the unemployment rate (%), by age groups and ISCED, between 2000 and 2013, in Portugal
Source: Eurostat
Figure A1.8 Private expenditure on education as % of GDP
Source: Eurostat 0,08 0,08 0,08 0,09 0,13 0,41 0,43 0,44 0,49 0,38 0,43 2000 2001 2002 2003 2004 2005 2006 2007 2008 2009 2010 1 0 ,5 1 6 ,2 4 0 ,6 4 ,2 1 0 ,7 2 5 ,7 4 ,4 8,0 1 8 ,9 9 ,5 1 4 ,4 3 6 ,0 8 ,3 8,8 1 9 ,0 7 ,3 6,2 1 4 ,1 2 1 ,2 3 0 ,4 3 7 ,8 8 ,5 1 2 ,9 2 0 ,6 6 ,3 5,8 1 6 ,6 2 0 0 2 2 0 0 8 2 0 1 3 2 0 0 2 2 0 0 8 2 0 1 3 2 0 0 3 - 0 5 2 0 0 8 2 0 1 3 1 5 T O 2 4 Y E A R S 2 5 T O 2 9 Y E A R S 3 0 T O 3 4 Y E A R S 0-2 3-4 5-6
39
Table A1.3 State Expenditure on Education, as a % of GDP
2000 2001 2002 2003 2004 2005 2006 2007 2008 2009 2010 2011 2012
Eurostat 5,4 5,4 5,3 5,4 5,1 5,2 5,1 5,1 4,9 5,8 5,6 : :
INE 6,1 6,2 6,3 6,2 6,4 6,5 6,2 5,7 5,6 6,0 6,3 5,7 4,9
Pordata/DGO 5,1 5,2 5,4 5,1 4,9 4,9 4,7 4,4 4,3 5,0 5,0 4,6 4,0
Source: Eurostat Note: : = Not available
40 A2. Educational system
Compulsory education
Since 2009 compulsory education corresponds to free education, from age 6 to 18, divided between basic and upper secondary education1. Basic education lasts for 9 years and is divided into three cycles. The 1st cycle with four years of schooling from 6 to 10 modal ages; the 2nd cycle with two years of schooling from 10 to 12 modal ages; and lastly, the 3rd cycle with three years of schooling from 12 to 15 modal ages (corresponding to the end of lower education, ISCED 2). Upper secondary education comprises three academic years (including 10th to 12th grades), from 15 to 18 modal ages, combining different curricular routes which in general converge in accessing to tertiary education plans (see Portuguese diagram in appendix).
Currently, the last two stages of compulsory education, namely the 3rdcycle of basic education and upper secondary, include dual certification and courses geared towards further study. This means that vocational education and training cycles may last 1-6 years, beginning at 15 years old and are organized in school networks including both general and vocational education (either in private vocational schools or in consortium of public and private entities). The guidance of students foresees the choice between vocational and general courses (from 3rd cycle to upper secondary)2, a transition implying tracking though with some degree of permeability. In general, the existing options allow to complete compulsory education and to access tertiary education.
To put in a nutshell, all compulsory education stages provide general courses (for basic level)/scientific and humanistic (for upper secondary), Artistic Courses (for all levels), and training through a dual regime (school and work context). Students risking to overcome compulsory educational maximal age at each stage have second further specific opportunities. For instances, for those dropping out, having drop out or needing requalification may complete compulsory or further education through Education and Training Courses (ETC) from 3rd cycle to upper secondary; students under 15 years old or overcoming compulsory education maximal age, with learning difficulties, risking social exclusion and/or school dropout, have Alternative Curriculum Paths (PACs) for
1 Law no. 85/2009, August 27. This educational level is expected to cover all pupils in 2014-15, Since the entrance of Portugal in the
European Economic Community (CEE) in 1986 and the new LBSE, until 2009, compulsory education was at lower secondary education level(e ainda é. Isso não mudou),, i.e., nine years of schooling, and reintroduced vocational routes into the education system (extinct since 1977). (não percebo…
2 The guidance of students always implies the parents’ agreement though it may be suggested by the class council or director, knowing
41
basic education levels; students aged 15 – 18 who are early school leavers or risking delinquent behavior, have the Integrated Program for Education and Training3 for the 2nd and 3rd cycle of basic education (PIEF) with adjusted schedules and curricula to individuals’ skills and proficiencies, relational and citizenship skills and labour market demands; those under 25, who completed lower secondary or equivalent, dispose of an educational provision for upper secondary education including Technological courses (currently residual), Professional and Apprenticeship courses (initial professional training courses taught on the Vocational Training Centre Network4). Finally, to tackle school drop-outs or retentions for youth aged 13 or more, a very recently pilot experience foresees the possibility for vocational Courses during compulsory education and starting from the 3rd cycle of basic education, allowing progression to post-secondary non-tertiary professional education (a pilot-project from 2013/2014).
For the period in analysis (2000-2012) teachers’ and academic staff (Figure A2.1 and Figure A2.2) show an important decrease. After increasing from 2000 to 2010 – until 2005 for primary education and for 2009 for lower secondary education – since 2012 that the number of teachers has decreased significantly. This loss was more significant for primary education (about 11 000 teachers less), followed by those in lower secondary (about 8 000 teachers less). Teachers’ numbers in upper secondary fluctuated significantly more (with key variation years: 2004, 2007, 2012), with a recent loss of about 2000 teachers less.
The number of students for both public and private sectors (Figure A2.3) diminished also for primary education (about 12% less students between 2000 and 2012), while swaging for lower and upper secondary -- observing almost the same number of students when comparing 2000 to 2012. However, this apparent stability hides two different periods for these educational levels: if first students´ numbers decreased significantly from 2000 to 2005/6 (about 10% loss for lower secondary, and 17% for upper secondary), in a second moment their numbers exploded, between 2005/6 to 2009 (38% more in lower secondary, 44% more in upper secondary), decreasing again until 2012 (about 16-17% less students for both educational levels).
3 Programa Integrado de Educação e Formação, PIEF
4 Under the responsibility of the Employment and Vocational Training Institute (Instituto do Emprego e Formação Profissional (IEFP
42
A more detailed analysis indicates further that, for upper secondary education, the number of students between 2000-2012 shows a moment of significant decrease for the general track (from about 300 000 to 200 000). The opposite is observed for the professional/vocational courses (from less than 50 000 to slight more than 100 000) -- showing the main growth of students in upper secondary. Indeed, the annual rates of students in upper secondary indicate a decreasing rate when referring to the general academic track (varying between -0,2% and -10%, though decreasing less since 2009/10), while a growing rate for the professional/vocational tracks (varying between 1% and 50%, particularly high from 2006/07 and 2009/10), though in 2010/11 and 2011/12 decreasing drastically their variation to 3% (Figure A2.4 and Table A2.1).
In sum, the general picture of students in upper secondary from 2000/01 to 2011/12 shows that: those in general education have decreased significantly, representing in a first moment more than 70% of total students and currently less than 60%5; those in technologic courses were 20% before but represent currently very residual numbers (around 2%); those in Apprenticeship, Education and Training Courses and Specialized Artistic have maintained their very residual proportions (less than 10% for the first, less than 5% for the second, and extremely residual for the latter); and differently from all the previous, those in professional courses increased significantly from less than 10% of total students in this educational level to more than 30%6 (Figure A2.5, Figure A2.6, Figure A2.7).
Special Educational Needs
Since 1996/97 pupils with Special Educational Needs benefit from specific support once integrated in regular and compulsory education – currently from 6 to 18 years old. During the last 10 years, there was indeed an increasing law regulation7, fruitful in creating the conditions for universal access and support for the public with specific needs as well as for the professionalization of the staff and teachers. From 2008 onwards, the already existing teachers in special education were able to create a network of expertise for
5 Total numbers: decreasing from almost 300 000 students to almost 200 000 students, i.e., around 100 000 students less between
2000/01 to 2011/12, source: DGEEC (GEPE) (2000-2012).
6 Total numbers: increasing from less 40 000 students to almost 120 000 students, i.e., around 80 000 students more between 2000/01
to 2011/12, source: DGEEC (GEPE) (2000-2012)
7 In 2004, the General Legal Basis of the Regime for Prevention, Schooling, Rehabilitation and Participation of Individuals with
Disabilities (Bases Gerais de Regime Jurídico da Prevenção, Habilitação, Reabilitação e Participação da Pessoa com Deficiência), based on the International Classification of Functioning, Disability and Health (ICF, ONU); in 2006, the decree for the Special Education Framework (Quadro da Educação Especial);