Phenotypic flexibility and drought avoidance in taro
(Colocasia esculenta (L.) Schott)
Carla S. S. Gouveia1*, José F. T. Ganança1, Humberto G. M. de Nóbrega1, José G. R. de Freitas1,
Vincent Lebot2, Miguel Â. A. Pinheiro de Carvalho1
1ISOPlexis Genebank, Faculty of Life Sciences, University of Madeira, Campus da Penteada, 9020-105, Funchal, Madeira, Portugal, 2
CIRAD-BIOS, PO Box 946, Port Vila, Vanuatu.
*Corresponding author:
Carla S. S. Gouveia, ISOPlexis Genebank, Faculty of Life Sciences, University of Madeira, Campus da Penteada, 9020-105, Funchal, Madeira, Portugal. E-mail: csgouveia@staff.uma.pt
Received: 02 August 2019; Accepted: 23 January 2020
INTRODUCTION
Taro (Colocasia esculenta (L.) Schott) is one of the most
consumed tropical crops in the world. Corms contribute significantly to food and nutrients intake, being the second-most group of cultivated species after cereals (Sharma and Kaushal, 2016). In 2018, Africa registered 74% of worldwide taro production, near 7.9 Mt (FAOSTAT, 2020).
Water scarcity is currently one of the most devastating abiotic stresses with a great impact on crop productivity, and populations’ food security and subsistence, which is expected to be aggravated with ongoing climatic changes (Ganança et al., 2018; Ganança et al., 2015). Taro needs a high water supply to obtain optimal yields, about 2,500 mm rainfall per year (Ganança et al., 2018). Therefore, water scarcity and severe weather events were expected to affect negatively this crop productivity (Ganança et al., 2015). The drought stress occurs with the soil water
availability reduction, and with the plant water loss through evapotranspiration due to the atmospheric conditions (Motsa et al., 2015).
The adaptive plant response to water scarcity could be associated with their physiological and biochemical resistance mechanisms, where the wider their adaptation capability, the greater is their protection toward different stresses (Zlatev and Lidon, 2012). Plants rely on intrinsic physiological mechanisms, such as phenotypic flexibility and/or drought avoidance to tolerate water scarcity (Farooq et al., 2009).
Drought avoidance mechanisms reduces the water loss through transpiration, maintaining the water uptake and root biomass accumulation under water scarcity (Farooq et al., 2009). Water use efficiency (WUE) is essential for plant drought tolerance discrimination. The most tolerant taro accessions can increase or maintain WUE under drought, improving or showing a small decrease in total plant biomass
Taro (Colocasia esculenta (L.) Schott) is a substantial staple food in most of the tropical regions. Prolonged exposure to drought impairs crop production worldwide. Tolerant crops have the best capability to cope and avoid drought, through phenotypic flexibility mechanisms. The water use efficiency (WUE) is well known in taro crops, but very scarce information is available relating to their nutrient efficiency (NER) in drought conditions. Our work provided pertinent information about the physiological variation of seven taro accessions subjected to seven months of drought, by recording the differences for nutrient allocation, chlorophyll canopy, biomass loss, and stress intensity. Significant relationships between control and drought treatments on WUE (+85%), total plant biomass (TPB, -26.8%), chlorophyll content index (CCI, +1.8%), and nutrient harvest index (NHI, +0.2%) were detected. Drought led to a generalized loss of TPB as drought avoidance strategy, although distinct phenotypic flexibility was observed through the root: shoot ratio (R:S) and stress index (SI) from the corm and shoot organs. The nutrient allocation from the corms to shoots, with NER increase registered in drought conditions, can be a valuable tool to complement the TPB and WUE productivity traits, to be used in taro breeding programs.
Keywords: Biomass; Drought; Nutrient efficiency; Root:Shoot ratio; Stress index
A B S T R A C T
http://www.ejfa.me/
(TPB) and yield (Gouveia et al., 2019a; Ganança et al., 2018). Drought can lead to a nutrient deficiency, since the amount of water availability and nitrogen (N) absorption are strongly correlated (Duman, 2012). Tolerant accessions exhibit higher
yield and nitrogen use efficiency (NUE), under low input or drought conditions (Yuan and Peng, 2017). NUE can be calculated according to the crop and its harvest (Good et al., 2004). NUE is the result of the nutrient uptake efficiency (NUpE), harvest index (NHI), incorporation efficiency (efficiency ratio, NER) and plant utilization efficiency (E), differentiating accessions by their ability to nutrient absorption and use to obtain maximum yields (Lammerts van Bueren and Struik, 2017; Mathur and Goel 2017; Siddiqi and Glass 1981). NUE has been mostly used in grain crops, with very few studies realized on root crops, such as taro, sweet potato and cassava (Gouveia et al., 2019b; Lammerts van Bueren and Struik, 2017; John et al., 2016; Hartemink et al., 2000). Major food crops could have distinct magnitude in the range of their phenotypic flexibility, varying according to the intensity of the abiotic stress (Jaradat 2018). The phenotypic flexibility consists in the plant growth capacity during drought, where the roots and leaves are the main affected organs, playing both key roles in the adaptation or responses to drought (Farooq et al., 2009). Usually, the roots are the key organ in the plant adaptation to drought. Cotton and tea accessions improved the root functioning and growth under drought, allowing them to maintain the leaf area and growth, during prolonged stress (Farooq et al., 2009). Rundel and Sharifi (1993) hypothesized that root: shoot ratio (R:S) retains an appropriate balance allowing the maintenance of WUE during the variation of water availability along the plant life. The lack of water could reduce the leaf area development and thus can increase the R:S, whose ratio usually is greater in water limited plants (Hubick and Gibson, 1993; Laureti et al., 1993). Leshem and Kuiper (1996) postulated that under water-limiting conditions, plants can promote osmoregulation through GAS (general adaptation syndrome), ceasing completely the shoot growth, but still displaying availability to root elongation. Root crops can also have a typical R:S ratio increase through age, due to the investment of carbon in the underground organs (Atwell et al., 1999). The increase of photosynthetic rate is another indicator of the plant’s ability to tolerate this abiotic stress, where the higher plant resistance to drought appears correlated with the highest values of chlorophyll index (Gouveia et al., 2018; Salehi-Lisar and Bakhshayeshan-Agdam, 2016; Pereira et al., 2015, Mabhaudhi and Modi, 2015; Tiwari and Mamrutha, 2013). To better understand how these strategies of phenotypic flexibility and stress avoidance encompass the taro’s capacity to cope with drought, we assessed the nutrient, carbon and water allocation, chlorophyll rate, and stress
intensity of taro whole-plants submitted to prolonged water scarcity stress. Thus, we aimed to increase our knowledge of how abiotic stress affects the taro’s intrinsic physiological mechanisms under drought conditions.
MATERIALS AND METHODS
Experimental sites and drought management
Taro (Colocasia esculenta L.) experimental design and watering
regimes was performed during a 9 months’ full plant growth cycle in 2015, according to Gouveia et al. (2018), in an open greenhouse in the Preces experimental station (32º39’N, 16º58’W, 188 m a.s.l., Câmara de Lobos, Madeira, Portugal) (Fig. 1). Seven taro accessions from Madeira and Canary Islands, and Pacific Community (SPC, Fiji) collection (Table 1) where used. During seven months, three rows (replicates) from control were maintained at field capacity, and another three rows for drought received 40.2% of water applied to control. Four plants per accession were distributed in each row. The greenhouse average temperature was 25.12 ºC, with an average relative humidity of 49.94%, during the drought assay. All the experiment was implement in a soil free of chemical contaminants, without addition of any fertilizers or phytopharmaceutical products. Weeds were removed manually at regular intervals, to prevent interference in the crops yield.
Harvest and sample preparation
At the end of the assay, 336 corms and shoots (considering petioles and leafs) samples of control and drought experimental
Fig 1. Taro greenhouse development at the beginning (left) and end (right) of the drought assay.
Table 1. Name and origin of taro (Colocasia esculenta L.) accessions selected for this study
Acc. IDa Accession local name Origin
2056 Listado Canary Islands –
La Palma 2061 Blanco Saucero Canary Islands –
La Palma
2210 Roxo Madeira Island
2216 Branco Madeira Island
2232 PExPH 15-6 BL/HW/08 SPC, Fiji
2234 C3-22 BL/PNG/11 SPC, Fiji
2239 Karang CE/MAL/10 SPC, Fiji
rows were harvest, washed, sliced, oven-dried at 65ºC until constant weight during approximately 48 h (Memmert UF260, Germany), and milled (IKA-Werke M20, USA). The flour was stored in bags (Termofilm PA/PE) sealed by vacuum (Audionvac VMS153, Netherlands) at -35ºC (Liebherr ProfiLine GGPV6570, Germany) until analysis.
Soil chemical and physical properties
Air-dried soil samples were grinded, sieved (2 mm) and analysed by the Agriculture Quality Laboratory at the Directory of Laboratory and Agro-Food Research Services, in Camacha, Madeira, Portugal. The soil chemical and physical properties were evaluated for: pH H2O (1:2.5 w/v); pH KCl (1:2 w/v); organic matter according to Walkley and Black method; ammonia and nitrate content by continuous-flow auto analyser (3:15 w/v); the soil particle-size and texture were classified following the World Reference Base for Soil Resources (IUSS, 2015).
Chlorophyll content index (CCI)
A chlorophyll fluorescence technique (Opti-Sciences CCM-200 PLUS, USA) determined the CCI in taro fresh leaves. An uniform reading along the adaxial leaf surface (left, centre and right sides) was made, avoiding the branching veins. A mean CCI value per main plant leaf in each row was determined.
Nitrogen content (N)
The nitrogen content of the sample flours was determined by the Kjeldahl method AOAC 945-18-B (AOAC, 2005), through a distillation and titration automatic unit (Velp Scientifica UDK 152, Italy). All analyses were performed in triplicate, and the values expressed in g/100 g dry flour.
N efficiency ratio (NER)
NER was calculated as a nutrient efficiency ratio (Steenbjerg and Jakobsen, 1963):
W NER
N
= , (1)
where W is the plant dry biomass, and N is the plant
nitrogen uptake. Calculations were performed in triplicate, and the values expressed in kg/kg of dry flour.
N efficiency of utilization (E)
The E was calculated according to Siddiqi and Glass (1981):
E=W×NER, (2)
where W the product of the absolute biomass production,
and NER is the nutrient efficiency ratio. Calculations were
performed in triplicate, and the values expressed in kg of dry flour.
N harvest index (NHI)
The NHI was calculated according with Kołodziejczyk
(2014): Nt
NH I N
= , (3)
where the Nt is the N uptake in corm, and N is the N
uptake by the whole-plant. Calculations were performed in triplicate, and the values expressed in % of dry flour.
Root-to-shoot ratio (R:S)
The ratio between the corms and shoots dry biomass was calculated for both control and drought experimental conditions, according to Laureti et al. (1993).
Total mineral content (M)
Total mineral was gravimetrically determined by sample flour calcination in a furnace (Vulcan Model 3-550, NEY, USA) at 550 ± 10°C during 5h, according to the method AOAC 923.03 (AOAC, 2005). The analyses were performed in triplicate, and the values expressed in g/100g of dry flour.
Total plant biomass (TPB)
TPB represents the average of total dry weight from corms and shoots obtained from the replicates, that were dehydrated in an air oven (Memmert UF260, Germany) (Undersander et al., 1993). Results are expressed in g of dry flour.
Water use efficiency (WUE)
WUE was the ratio between the total plant dry biomass and total water used per plant, expressed in g/L (Ganança et al., 2018).
Whole-plant stress index (SI)
The whole-plant stress index (SI) was calculated (Robinson et al. 2000): u n s t r e s s e d s t r e s s e d u n s t r e s s e d W W SI W − = , (4)
where the W represents the mean dry weight of the
whole-plant. The SI ranges from 0 to 1, conferring the effect of the environment on plant growth. The plant SI values tend toward 0 when less sensitive to stress (SI → 0), and to 1 with the increase of stress sensitivity (SI → 1).
Data analysis
The results represent the mean ± standard deviation of
corms and shoots of 3 control vs 3 drought replicates,
expressed in a dry weight basis. All samples were statistically evaluated with IBM SPSS Statistics 24.0 for Mac, for one-way analysis of variance (One-Way ANOVA), Tukey’s Honestly Significance Difference Post Hoc test (Tukey’s
HSD), and Pearson correlations, signalizing the significant differences found (p ≤ 0.05).
RESULTS
WUE, biomass, chlorophyll and nutrient use interactions during drought
All taro accessions decreased their biomass content, when under drought, showing a stress avoidance mechanism. Although, they had distinct physiological responses for the water allocation, chlorophyll content rate and nutrient use at the whole-plant level. The analysis of variance showed a significant difference between control and stress conditions for CCI, TBW, WUE, E, and NHI, with Tukey’s HSD test signalizing the accessions that were significantly different from which others, presented in Table 2.
Total plant biomass (TPB) of taro accessions (acc.) in average decreased from 61.6 to 45.1 g (-26.8%), with acc. 2210 and 2061 showing the lowest significant weight loss. All taro acc. increased WUE, registering an average increase from 0.20 to 0.37 g/L (+85.0%), minimizing the water loss through transpiration, specially for the acc. 2056, 2061 and 2216 that registered the highest significant WUE increase. Chlorophyll content index (CCI) in average was near 33. The acc. showed an average increase of CCI from 32.7 to 33.3 (+1.8%), with acc. 2210, 2061 and 2216 reaching the highest significant values. N efficiency ratio (NER) decreased from 15.3 to 12.2 kg/kg (-20.3%), without the observation of significant differences
between accessions. The acc. 2234 and 2061 were the exceptions by increasing NER. The variation of N efficiency of utilization (E) decreased in average from 5.7 to 4.3 kg (-24.6%). The acc. 2056 registered the highest E decrease, while acc. 2061 slightly increased E, without showing significant differences between them. The average N harvest index (NHI) slightly increased from 29.3 to 29.5% (+0.2%), with acc. 2216 and 2239 showing the highest significant NHI values, meanwhile the acc. 2232 and 2239 were the ones that presented a NHI decrease due to drought.
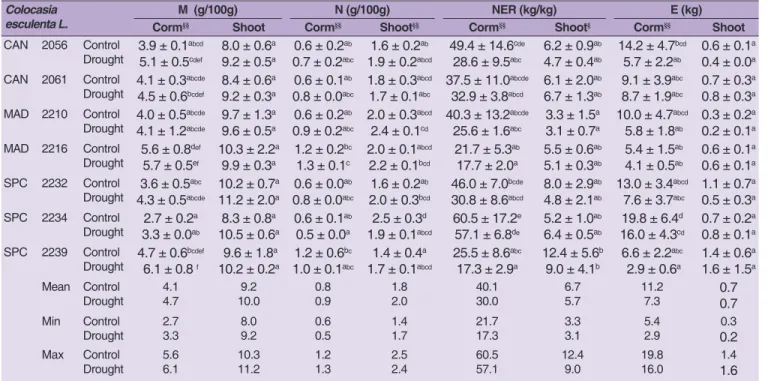
Nutrient efficiency ability during drought
Drought modified the taro nutrient allocation between underground corms and aboveground shoots organs, through the mineral (M), nitrogen (N), NER and E traits. The analysis of variance showed a significant difference between control and stress conditions for M-corm, N-corm, NER-corm, E-corm, N-shoot and NER-shoot, with Tukey’s HSD test signalizing the accessions that were significantly different from which others, present in Table 3. Taro corms showed a lower M content in comparison with shoots, in both experimental variants. Although, drought increased the corm and shoot M content of all accessions. The acc. 2210 and 2216 shoots were exceptions, as they slightly diminished the M-shoot content to water stress. In average, taro M-shoot increased from 9.2 to 10.0 g/100g (+0.8%), with acc. 2232, 2234 and 2239 showing the highest content, but without significant differences between
Table 2. Chlorophyll content index (CCI), total plant biomass (TPB), water use efficiency (WUE), N efficiency ratio (NER), N efficiency utilization (E) and N harvest index (NHI) of taro (C. esculenta) whole-plant accessions
CCI§§ TPB (g) §§ WUE (g/L) §§ NER (kg/kg) E (kg)§ NHI (%)§§
Colocasia esculenta L. CAN 2056 Control Drought 37.4 ± 7.5 abcd 38.7 ± 15.6abcd 87.5 ± 23.6 cd 46.9 ± 14.5abc 0.29 ± 0.08 abc 0.39 ± 0.12bc 17.9 ± 3.3 a 11.0 ± 1.7a 6.9 ± 1.5 ab 3.2 ± 0.7ab 27.8 ± 4.0 abcde 27.3 ± 4.9abcde CAN 2061 Control Drought 40.3 ± 2.0 abcd 43.4 ± 6.8cd 73.8 ± 17.8 bcd 69.9 ± 17.3bcd 0.23 ± 0.03 ab 0.48 ± 0.16cd 14.5 ± 4.7 a 15.0 ± 1.2a 5.1 ± 2.3 ab 5.7 ± 0.8ab 26.6 ± 1.5 abcd 32.0 ± 2.4bcde MAD 2210 Control Drought 38.3 ± 7.9 abcd 46.9 ± 13.4d 37.8 ± 10.5 ab 33.4 ± 10.4ab 0.12 ± 0.04 a 0.28 ± 0.09abc 11.5 ± 3.1 a 9.1 ± 0.6a 3.7 ± 1.8 ab 2.7 ± 0.6a 23.0 ± 2.9 ab 26.2 ± 3.1abc MAD 2216 Control Drought 41.3 ± 4.3 bcd 44.8 ± 13.7cd 95.7 ± 35.3 d 75.3 ± 9.1bcd 0.32 ± 0.12 abc 0.67 ± 0.11d 11.3 ± 1.8 a 9.8 ± 0.5a 4.1 ± 0.8 ab 3.4 ± 0.3ab 36.7 ± 3.9 def 37.4 ± 3.1ef SPC 2232 Control Drought 18.6 ± 7.0 abcd 16.1 ± 6.1abc 40.5 ± 4.2 ab 23.2 ± 5.6a 0.14 ± 0.01 a 0.19 ± 0.05ab 18.6 ± 4.3 a 11.8 ± 4.3a 7.7 ± 3.0 b 4.2 ± 2.3ab 27.7 ± 2.2 abcde 26.7 ± 3.5abcd SPC 2234 Control Drought 40.7 ± 16.5 abcd 30.8 ± 10.0abcd 52.3 ± 0.3 abcd 46.5 ± 12.3abc 0.18 ± 0.00 ab 0.39 ± 0.10bc 15.4 ± 3.2 a 16.8 ± 1.2a 6.9 ± 1.7 ab 6.7 ± 1.2ab 18.6 ± 1.6 a 20.5 ± 1.0a SPC 2239 Control Drought 12.4 ± 3.6 a 12.7 ± 5.2ab 43.3 ± 12.6 abc 20.4 ± 5.3a 0.15 ± 0.04 ab 0.17 ± 0.04ab 18.0 ± 6.7 a 11.9 ± 2.2a 5.8 ± 1.4 ab 4.0 ± 1.7ab 44.5 ± 6.6 f 36.2 ± 2.6cdef Mean Control Drought 32.733.3 61.645.1 0.200.37 15.312.2 5.74.3 29.329.5 Min Control Drought 12.412.7 37.820.4 0.120.17 11.39.1 3.72.7 18.620.5 Max Control Drought 41.346.9 95.775.3 0.320.67 18.616.8 7.76.7 44.537.4
Data are expressed in dry weight basis (DW), and represents the mean ± SD of three independent replications per accession, with total mean, minimum and maximum per trait. §,§§Significant differences between control and drought stress conditions (One-way ANOVA, §p ≤ 0.05; §§p ≤ 0.01). Means not sharing the same
accessions. The taro M-corm, in average, increased between 4.1 and 4.7 g/100g (+0.6%), with acc. 2239 and 2216 having significantly higher content during drought.
Taro shoots exhibited a higher N content relatively to corms, in both experimental variants. Although, both taro corms and shoots slightly increased the N content, under water scarcity. In average, N-corm slightly increased from 0.8 to 0.9 g/100g (+0.1%), and the N-shoot from 1.8 to 2.0 g/100g (+0.2%), between control and drought conditions, respectively. When in drought, acc. 2216 presented the highest significant N-corm content, meanwhile acc. 2210 had the highest significant N-shoot content.
This nutrient variation registered among taro organs have different efficiency in their use. We observed that both NER and E were higher in the corms than in the shoots, but decreased on both organs, under drought. Water scarcity decreased the NER-corm from 40.1 to 30.0 kg/kg (-25.2%) and NER-shoot from 6.7 to 5.7 kg/kg (-14.9%), respectively. Meanwhile, E-corm decreased from 11.2 to 7.3 kg (-34.8%), and shoot E did not vary (0.7 kg) under stress. The corm from acc. 2234 showed the highest significant NER and E content in drought conditions. To help the further discussion about this nutrient variation in the taro accessions, we registered at 0.2 m of pot soil sampling depth, a slightly acidic pH 5.9, silt clay loam
texture and high inorganic mineral content (NO3- and
NH4+) (data not shown).
Stress index and root-to-shoot relationship to drought
The TPB loss in all accessions was registered as a consequence of water shortage, but distinct responses in the plant organs growth can be explained by the phenotypic flexibility expressed through the R:S and SI estimation (Fig. 2). The R:S was used to evaluate the plant ability to maintain a dynamic balance between the functionally interdependent organs, such as corm and shoots, during drought. In control conditions, taro R:S ranged from 1:4 to 1:18, for acc. 2216 and 2210, respectively. Taro accessions showed a natural difference between the organs weight, with shoots being 4 to 18 times lighter than corms. In general, drought decreased the R:S due to an increase investment in the shoot development. The exception was for taro acc. 2056 (1:6 to 1:8, +39.5%) and 2210 (1:18 to 1:28, +56.1%). These accessions showed a R:S increase, indicating that they decreased their shoot development in detriment of corm growth. The acc. 2210 showed the highest biomass variation between organs, both in control and drought conditions. On the other hand, acc. 2239 (1:6 to 1:3, -49.4%) showed the highest investment in shoot development, and the biggest R:S ratio reduction.
The SI was used to explain the differences of drought stress level in terms of its impact on accessions innate growth
Table 3. Mineral (M), nitrogen (N), N efficiency ratio (NER) and N efficiency utilization (E) from the corms and shoots of taro (C. esculenta) accessions
Colocasia
esculenta L. CormM (g/100g)§§ Shoot Corm§§N (g/100g)Shoot§§ CormNER (kg/kg)§§ Shoot§ Corm§§E (kg) Shoot
CAN 2056 Control Drought 3.9 ± 0.1 abcd 5.1 ± 0.5cdef 8.0 ± 0.6a 9.2 ± 0.5a 0.6 ± 0.2 ab 0.7 ± 0.2abc 1.6 ± 0.2ab 1.9 ± 0.2abcd 49.4 ± 14.6cde 28.6 ± 9.5abc 6.2 ± 0.9ab 4.7 ± 0.4ab 14.2 ± 4.7bcd 5.7 ± 2.2ab 0.6 ± 0.1a 0.4 ± 0.0a CAN 2061 Control Drought 4.1 ± 0.3 abcde 4.5 ± 0.6bcdef 8.4 ± 0.6a 9.2 ± 0.3a 0.6 ± 0.1 ab 0.8 ± 0.0abc 1.8 ± 0.3abcd 1.7 ± 0.1abc 37.5 ± 11.0abcde 32.9 ± 3.8abcd 6.1 ± 2.0ab 6.7 ± 1.3ab 9.1 ± 3.9abc 8.7 ± 1.9abc 0.7 ± 0.3a 0.8 ± 0.3a MAD 2210 Control Drought 4.0 ± 0.5 abcde 4.1 ± 1.2abcde 9.7 ± 1.3a 9.6 ± 0.5a 0.6 ± 0.2 ab 0.9 ± 0.2abc 2.0 ± 0.3abcd 2.4 ± 0.1cd 40.3 ± 13.2abcde 25.6 ± 1.6abc 3.3 ± 1.5a 3.1 ± 0.7a 10.0 ± 4.7 abcd 5.8 ± 1.8ab 0.3 ± 0.2a 0.2 ± 0.1a MAD 2216 Control Drought 5.6 ± 0.8 def 5.7 ± 0.5ef 10.3 ± 2.2a 9.9 ± 0.3a 1.2 ± 0.2 bc 1.3 ± 0.1c 2.0 ± 0.1 abcd 2.2 ± 0.1bcd 21.7 ± 5.3ab 17.7 ± 2.0a 5.5 ± 0.6 ab 5.1 ± 0.3ab 5.4 ± 1.5ab 4.1 ± 0.5ab 0.6 ± 0.1a 0.6 ± 0.1a SPC 2232 Control Drought 3.6 ± 0.5 abc 4.3 ± 0.5abcde 10.2 ± 0.7a 11.2 ± 2.0a 0.6 ± 0.0 ab 0.8 ± 0.0abc 1.6 ± 0.2ab 2.0 ± 0.3bcd 46.0 ± 7.0bcde 30.8 ± 8.6abcd 8.0 ± 2.9ab 4.8 ± 2.1ab 13.0 ± 3.4abcd 7.6 ± 3.7abc 1.1 ± 0.7a 0.5 ± 0.3a SPC 2234 Control Drought 2.7 ± 0.2 a 3.3 ± 0.0ab 8.3 ± 0.8a 10.5 ± 0.6a 0.6 ± 0.1 ab 0.5 ± 0.0a 2.5 ± 0.3 d 1.9 ± 0.1abcd 60.5 ± 17.2e 57.1 ± 6.8de 5.2 ± 1.0ab 6.4 ± 0.5ab 19.8 ± 6.4d 16.0 ± 4.3cd 0.7 ± 0.2a 0.8 ± 0.1a SPC 2239 Control Drought 4.7 ± 0.6 bcdef 6.1 ± 0.8 f 9.6 ± 1.8a 10.2 ± 0.2a 1.2 ± 0.6 bc 1.0 ± 0.1abc 1.4 ± 0.4a 1.7 ± 0.1abcd 25.5 ± 8.6abc 17.3 ± 2.9a 12.4 ± 5.6 b 9.0 ± 4.1b 6.6 ± 2.2 abc 2.9 ± 0.6a 1.4 ± 0.6 a 1.6 ± 1.5a Mean Control Drought 4.14.7 10.09.2 0.80.9 2.01.8 40.130.0 6.75.7 11.27.3 0.70.7 Min Control Drought 2.73.3 8.09.2 0.60.5 1.71.4 21.717.3 3.33.1 5.42.9 0.20.3 Max Control Drought 5.66.1 10.311.2 1.21.3 2.42.5 60.557.1 12.49.0 19.816.0 1.61.4 Data are expressed in dry weight basis (DW), and represents the mean ± SD of three independent replicates per accession, with total mean, minimum and maximum per trait. §,§§Significant differences between control and drought stress conditions (One-way ANOVA, §p ≤ 0.05; §§p ≤ 0.01). Means not sharing the same
aptitude (0 < SI < 1). Acc. 2061, 2210 and 2234 registered the lowest SI values, around 0.1 (SI → 0), showing to be the lowest drought-stressed acc., with a higher growth capacity and the best tolerance response to water scarcity. In opposition to this, the acc. 2239 was the most stressed, with SI value 0.5 (SI → 1).
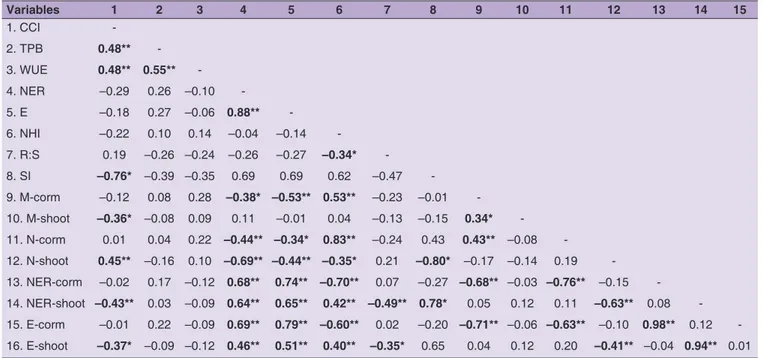
Pearson correlation coefficients between traits
Forty-five significant correlations were identified between the 16 traits in study, of which 25 are considered strong with r ≥ 0.50 (Table 4). The TPB and WUE had a strong positive correlation. CCI showed negative moderate correlations with NER-shoot and M-shoot. R:S had negative moderate associations with NHI, NER-shoot and E-shoot. The N-corm showed positive correlations with NHI and M-corm, and negative correlations with E, NER-corm and E-corm. The whole-plant NER also had
a negative moderate correlation with taro N-corm. SI was strong negative correlated with CCI and N-shoot.
DISCUSSION
Relation between water scarcity and plant development
The present study provided important information about the physiological responses of taro accessions, when submitted to drought stress. The water shortage led to biomass loss in all studied taro acc., a drought avoidance response related with phenotypic flexibility in organs’ growth. Along with the loss of biomass, the variation of CCI and WUE showed similarities among the accessions. During drought, on average more than a quarter of the
TPB was lost. According to Atwell et al. (1999), plants
can adjust constantly their shoot and root growth rate according to available resource capture, in order to increase their biomass content. The taro acc. maintained a dynamic balance between both underground and aboveground organs during drought, showing a R:S ratio decrease, which indicates the generalized trend for developing the shoot rather than corm. Accessions 2056 and 2210 were exceptions, presenting a R:S increase and preferential corms development instead of investing energy in the shoots growth. Possibly, these acc. showed an increased trend for sustained carbon investment in underground structures, like Atwell et al. (1999) proposed to be possible for root plants growth. Being the acc. with the smallest canopies, they showed the capacity to prioritize corm over shoot development, reducing the shoot area as a way to prevent shoot water deficits, increasing its WUE and photosynthesis efficiency (Motsa et al., 2015; van den Boogaard et al., 1995). This behaviour can be associated to an osmoregulation mechanism as GAS response to drought, according to Leshem and Kuiper (1996). Although these acc. invested the carbon in underground corms, works in cotton and peanut accessions also showed a leaf area reduction when the plant had water or nutrient deficit, leading likewise to a greater R:S (Hubick and Gibson, 1993; Laureti et al., 1993; Harris, 1992; Atwell et al., 1999). Despite the generalized biomass loss in all taro acc., low SI was recorded in acc. 2061, 2210 and 2234. The low SI indicated a small TPB difference between control and drought, showing the best ability to grow under drought.
The CCI indirectly measured the difference of the plant photosynthetic rate, throughout the comparison of the intensity of photosynthetic electron transport (Salehi-Lisar and Bakhshayeshan-Agdam, 2016). This index varies with the plant tolerance to drought, where the higher the CCI value indicates greater plant capacity to cope with stress (Gouveia et al., 2018; Salehi-Lisar and Bakhshayeshan-Agdam, 2016;
Fig 2. Stress index (SI) and root:shoot ratio (R:S) in taro (C. esculenta) accessions, under control and drought conditions. Taro accessions with ISOPlexis Genebank identification number code, from CAN Canary Islands, MAD Madeira Island, SPC Pacific community. Data are expressed in dry weight basis, and represents the mean of three independent replicates per accession. Control is well-watered, drought is water scarcity.
Tiwari and Mamrutha, 2013). The taro accessions showed a 1.8% increase in chlorophyll content towards drought. According to Pereira et al. (2015), it corresponds to an increase of photosynthesis and consequently an increase in plant production potential and vigour. Gouveia et al. (2019a, 2018) noticed that the CCI increase of taro under drought conditions, was an indication of the taro capacity
to keep partially open stomata, allowing a higher CO2
absorption and electron transport from the available H2O. The excitation of photosystem PSII by light photons can allow the ionization of chlorophyll molecules and electron transport, through electron transport chain with generation of ATP and NADPH (Salehi-Lisar and Bakhshayeshan-Agdam, 2016). The decrease of photorespiration is another probable factor with enhance of CCI during drought. A partially open stomata could allow the increase of the leaf intracellular CO2/O2 ratio and the carboxylase activity, with inhibition of oxygenase function of Rubisco (ribulose-1,5-bisphosphate carboxylase/oxygenase), and consequently decreasing photorespiration (Igamberdiev et al., 2004; Igamberdiev et al., 2001). As CCI increased, the photorespiration was unlikely to occur during the daylight, with no need for chloroplasts protection from photoinhibition (Prasad et al., 2008; Igamderdiev et al., 2004; Igamderdiev et al., 2001). Nonetheless, Mabhaudhi and Modi (2015) used the same chlorophyll fluorescence measurement technique, but registered a decrease of CCI in South African taro landraces when drought-stressed.
WUE is an usual measure of the plant drought resistance, with the more tolerant accessions usually showing higher WUE (Gouveia et al., 2019a; Ganança et al., 2018). Linked to stomatal aperture, WUE could represent the ratio of
biomass (produced by CO2 assimilation in photosynthesis)
to water loss by transpiration (Igamberdiev et al., 2004). When drought-stressed, all taro acc. increased WUE, in average by 85%, with acc. 2216 showing the highest value. This increase can be due to the partial reduction of the stomatal aperture in transpiration. Gouveia et al. (2019a) indicated that in spite of taro showing partially open stomata under drought, they were able to maintain leaf turgidity, by minimizing water loss through transpiration and improving water use in metabolic and physiological processes. Therefore, strong correlation of WUE with CCI and TPB obtained under drought supports these finds. According to Farooq et al. (2009), plants that allocate nutrients and improve WUE are more drought-tolerant, than that one’s not showing such behaviour.
The role of plant nutrient use during drought
N is a primary mineral nutrient that comprises about 80% of the total nutrients absorbed by plants (Kaur et al., 2017; Duman, 2012). Plants usually uptakes the N in the inorganic
form, either as nitrate (NO3−) or ammonium (NH
4+), where
NO3− is usually the major source of N for plants (Kaur
et al., 2017; Sahoo et al., 2010; Wang et al., 2009).
Table 4. Pearson correlation coefficients of the analysed traits of taro (C. esculenta) in control and drought stress conditions
Variables 1 2 3 4 5 6 7 8 9 10 11 12 13 14 15 1. CCI -2. TPB 0.48** -3. WUE 0.48** 0.55** -4. NER –0.29 0.26 –0.10 -5. E –0.18 0.27 –0.06 0.88** -6. NHI –0.22 0.10 0.14 –0.04 –0.14 -7. R:S 0.19 –0.26 –0.24 –0.26 –0.27 –0.34* -8. SI –0.76* –0.39 –0.35 0.69 0.69 0.62 –0.47 -9. M-corm –0.12 0.08 0.28 –0.38* –0.53** 0.53** –0.23 –0.01 -10. M-shoot –0.36* –0.08 0.09 0.11 –0.01 0.04 –0.13 –0.15 0.34* -11. N-corm 0.01 0.04 0.22 –0.44** –0.34* 0.83** –0.24 0.43 0.43** –0.08 -12. N-shoot 0.45** –0.16 0.10 –0.69** –0.44** –0.35* 0.21 –0.80* –0.17 –0.14 0.19 -13. NER-corm –0.02 0.17 –0.12 0.68** 0.74** –0.70** 0.07 –0.27 –0.68** –0.03 –0.76** –0.15 -14. NER-shoot –0.43** 0.03 –0.09 0.64** 0.65** 0.42** –0.49** 0.78* 0.05 0.12 0.11 –0.63** 0.08 -15. E-corm –0.01 0.22 –0.09 0.69** 0.79** –0.60** 0.02 –0.20 –0.71** –0.06 –0.63** –0.10 0.98** 0.12 -16. E-shoot –0.37* –0.09 –0.12 0.46** 0.51** 0.40** –0.35* 0.65 0.04 0.12 0.20 –0.41** –0.04 0.94** 0.01
CCI chlorophyll content index of shoots; TPB total plant biomass (g, DW); WUE water use efficiency (g/L, DW); NER nitrogen efficiency ratio (Kg/Kg DW); E nitrogen efficiency utilization (Kg, DW); NHI nitrogen harvest index (%, DW); R:S root-to-shoot ratio; SI whole-plant stress index; M-corm total mineral content
of corms (g/100g, DW); M-shoot total mineral content of shoots (g/100g, DW); N-corm total nitrogen content of corms (g/100g, DW); N-shoot total nitrogen
content of shoots (g/100g, DW); NER-corm corm nitrogen efficiency ratio (Kg/Kg DW); NER-shoot nitrogen efficiency ratio (Kg/Kg DW); E-corm corm nitrogen
efficiency utilization (Kg, DW); E-shoot nitrogen efficiency utilization (Kg, DW). **Correlation is significant at the 0.01 level (2-tailed); * Correlation is significant at
Duman (2012) reported that the soil water availability was strongly related with the plant nitrogen absorption. The plant nutrient transport from the roots to the shoots can decrease due to the lack of soil moisture during drought, hindering the N availability and absorption by roots, and its uptake and utilization by plant (Duman, 2012). However, we did not observe that behaviour. In overall, drought changed the nutrient allocation in taro, by registering a slight increase of N in both organs. In fact, the accessions showed a higher M and N content in shoots in both environmental conditions. The soil pH can also be an important factor to determine the nutrient bioavailability, were the ideal pH is close to neutral (6.5 to 7.5) to allow a better root absorption (Jensen, 2010). The soil pH of the taro experimental pots was slightly lower than the mentioned above, and with the high inorganic mineral content, it facilitated the nutrient allocation from the underground corms to the aboveground shoots, whose nutrients were used mainly for leaf and corm growth.
The N-shoot accumulation can be related with the plant use of N to increase the rate of photosynthesis, while the N-corm can be used for the synthesis of proteins for the regulation of cellular defence and detoxification processes (Salehi-Lisar and Bakhshayeshan-Agdam, 2016; Van den Boogaard et al., 1995). The relation between the N allocation and use was assessed by NER, to differentiate accessions into efficient and inefficient nutrient use (Mathur and Goel, 2017; Good et al., 2004); by E, to allow a comparison between the increase of the produced biomass with NER (Siddiqi and Glass, 1981); and by NHI, that describes the share of nitrogen accumulated in corm yield in relation to total plant nitrogen uptake (Kołodziejczyk, 2014). We observe that the increase of N-shoot and N-corm was significantly correlated with NER and E decrease. Siddiqi and Glass (1981) mentioned that NER decrease could be due to the higher accumulation of nutrients in whole-plant instead of biomass production. As taro accessions preferred to accumulate N in both organs, they use it for increase photosynthesis and protein synthesis. Van den Boogaard et al. (1995) also mentioned that the N-shoot increase could be associated with an increase in the rate of photosynthesis.
The N accumulation in both taro organs also decreased the N efficiency of utilization (E), in relation to the decrease of NER into TPB production. With drought, the N-corm was negatively correlated with E, NER-corm and E-corm, and positively with M-corm and NHI, confirming a good nutrient allocation between whole-plant and corm. Kaur et al. (2017) also registered a positive correlation between NHI and N content among wheat accessions.
CONCLUSION
Taro accessions with the best capability to cope and avoid drought increased their R:S ratio, lowered their SI and reduced their TPB loss. The increase of NER, WUE, CCI and N content also allowed the improvement of the photosynthesis rate and support metabolic and physiological processes, under drought conditions. The acc. 2216 and 2210 showed to be the most tolerant ones, being good candidates for taro breeding programs, due to their phenotypic flexibility and drought avoidance response in prolonged stress conditions.
ACKNOWLEDGEMENTS
The authors wish to acknowledge the Agricultural Quality Laboratory at the Directory of Laboratory of Agro-Food Services and Research (Camacha, Madeira, Portugal) for the assistance in soil chemical and physical analysis. The authors are grateful for financial support from the
Programa Operacional Madeira 14–20, Portugal 2020 and
the European Union through the European Regional Development Fund [grant number M1420-01-0145-FEDER-000011, CASBio]. The first author wishes to
acknowledge the financial support grant from Agência
Regional para o Desenvolvimento da Investigação Tecnologia e Inovação, Portugal 2020 and the European Union through
the European Social Fund [grant number M1420-09-5369-FSE-000001].
Authors’ contribution
Carla Gouveia participated on the drought assay and samples preparation, performed the N and M analysis, obtained the NER, E, NHI, R:S and SI, interpreted and summarized all data generated from those experiments, and wrote the manuscript. José Ganança designed the drought assay, quantified WUE and contributed to CCI determination. José de Freitas and Humberto de Nóbrega significantly contributed with the greenhouse assay management and with meaningful support in the harvesting and preparation of samples, and obtaining TPB. Vincent Lebot and Miguel Carvalho coordinated the overall work and revised the manuscript.
Abbreviations
Acc. accession, CAN Canary Islands, CCI chlorophyll
content index, DW dry weight basis, E nitrogen efficiency
of utilization, M total mineral content, MAD Madeira
Island, N nitrogen content, NER nitrogen efficiency ratio, NHI nitrogen harvest index; R:S root-to-shoot ratio, SI
whole-plant stress index, TPB total plant biomass, SPC
REFERENCES
AOAC. 2005. Official Methods of Analysis of the Association of Analytical Chemists International. 18th ed. AOAC International,
Gaithersburg, MD.
Atwell, B., Kriedemann, P. and Turnbull, C. 1999. Growth analysis: A quantitative approach. In: B. Atwell, P. Kriedemann and C. Turnbull (Eds.), Plants in Action. Australian Society of Plant Scientist, New Zealand Society of plant Biologists and New Zealand Institute of Agricultural and Horticultural Science, Australia, pp. 203-204.
Duman, F. 2012. Uptake of mineral elements during abiotic stress. In: P. Ahmad and M. N. V. Prasad (Eds.), Abiotic Stress Responses in Plants: Metabolism, Productivity and Sustainability. Springer, New York, pp. 270-271.
FAOSTAT Database. 2018. Available from: http://www.fao.org/faostat/ en/?#data/QC. [Last accessed on 2020 Feb 27].
Farooq, M., A. Wahid, N. Kobayashi, D. Fujita and S. M. A. Basra. 2009. Plant drought stress: Effects, mechanisms and management. Agron. Sustain. Dev. 29: 185-212.
Ganança, J. F. T., J. G. R. Freitas, H. G. M. Nóbrega, V. Rodrigues, G. Antunes, C. S. S. Gouveia, M. Rodrigues, H. Chair, M. Â. A. Pinheiro de Carvalho and V. Lebot. 2018. Screening for drought tolerance in thirty three taro cultivars. Not. Bot. Hortic. Agrobot. 46: 65-74.
Ganança, J. F. T., J. G. R. Freitas, H. G. M. Nóbrega, V. Rodrigues, G. Antunes, M. Rodrigues, M. Â. A. de Carvalho and V. Lebot. 2015. Screening of elite and local taro (Colocasia esculenta) cultivars for drought tolerance. Proc. Environ. Sci. 29: 41-42. Good, A. G., A. K. Shrawat and D. G. Muench. 2004. Can less yield
more? Is reducing nutrient input into the environment compatible with maintaining crop production? Trends Plant Sci. 9: 597-605. Gouveia, C. S. S., J. F. T. Ganança, J. Slaski, V. Lebot and
M. Â. A. de Carvalho. 2019a. Stable isotope natural abundances (δ13C and δ15N) and carbon-water relations as drought stress
mechanism response of taro (Colocasia esculenta L. Schott). J. Plant Physiol. 232: 100-106.
Gouveia, C. S. S., J. F. T. Ganança, H. G. M. de Nóbrega, J. G. R. V. de Freitas and M. A. A. Pinheiro de Carvalho. 2019b. Drought avoidance and phenotypic flexibility of sweet potato (Ipomoea batatas (L.) Lam.) under water scarcity conditions. Not. Bot. Hortiic. Agrobot. 47: 1037-1046.
Gouveia, C. S. S., J. f. T. Ganança, V. Lebot and M. A. A. Pinheiro de Carvalho. 2018. Quantitation of oxalates in corms and shoots of Colocasia esculenta (L.) Schott under drought conditions. Acta Physiol. Plant. 40: 1-11.
Harris, R. 1992. Root-shoot ratios. J. Arboric. 18: 39-42.
Hartemink, A. E., M. Johnston, J. N. O’Sullivan and S. Poloma. 2000. Nitrogen use efficiency of taro and sweet potato in the humid lowlands of Papua New Guinea. Agr. Ecosyst. Environ. 79: 271-280. Hubick, K. T. and A. Gibson. 1993. Diversity in the relationship
between carbon isotope discrimination and transpiration efficiency when water is limited. In: J. R. Ehleringer, A. E. Hall and G. D. Farquhar (Eds.), Stable Isotopes and Plant Carbon-Water Relations. Academic Press Inc., San Diego, California, pp. 322.
Igamberdiev, A. U, N. V. Bykova, P. J. Lea and P. Gardestro. 2001. The role of photorespiration in redox and energy balance of photosynthetic plant cells: A study with a barley mutant deficient in glycine decarboxylase. Physiol. Plant. 111: 427-438.
Igamberdiev, A. U., T. N. Mikkelsen, P. Ambus, H. Bauwe, P. J. Lea and P. Gardestrom. 2004. Photorespiration contributes to
stomatal regulation and carbon isotope fractionation: A study with barley, potato and Arabidopsis plants deficient in glycine decarboxylase. Photosynth. Res. 81: 139-152.
IUSS Working Group WRB. 2015. World Reference Base for Soil Resources 2014, update 2015 International Soil Classification System for Naming Soils and Creating Legends for Soil Maps. World Soil Resources Reports No. 106. FAO, Rome.
Jaradat, A. A. 2018. Simulated climate change deferentially impacts phenotypic plasticity and stoichiometric homeostasis in major food crops. Emir. J. Food Agric. 30: 429-442.
Jensen, T. L. 2010. Soil pH and the Availability of Plant Nutrients. IPNI Plant Nutrition Today, No. 2. Available from: http://www.ipni.net/ pnt. [Last accessed on 2018 Dec 15].
John, K. S., S. U. S. Beegum, M. N. Sheela and G. Suja. 2016. Nutrient efficient genotypes in cassava: Scope to substitute for chemical fertilizers and in C sequestration. Acta Hortic. 1118: 193-200.
Kaur, B., G. Kaur and B. Asthir. 2017. Biochemical aspects of nitrogen use efficiency: An overview. J. Plant Nutr. 40: 506-523.
Kołodziejczyk, M. 2014. Effectiveness of nitrogen fertilization and application of microbial preparations in potato cultivation. Turk. J. Agric. For. 38: 299-310.
Laureti, M., E. Brugnoli and L. Spaccino. 1993. Carbon isotope discrimination in leaf soluble sugars and in whole-plant dry matter in Helianthus annum L. grown under different water conditions. In: J. R. Ehleringer, A. E. Hall and G. D. Farquhar (Eds.), Stable Isotopes and Plant Carbon-Water Relations. Academic Press Inc., San Diego, California, p. 96.
Lammerts van Bueren, E. T. and P. C. Struik. 2017. Diverse concepts of breeding for nitrogen use efficiency. A review. Agro. Sustain. Dev. 37: 1-24.
Leshem, Y. Y. and P. J. C. Kuiper. 1996. Is there a GAS (general adaptation syndrome) response to various types of environmental stress? Biol. Plant. 38: 1-18.
Mabhaudhi, T. and A. T. Modi. 2015. Drought tolerance of selected South African taro (Colocasia Esculenta L. Schott) landraces. Exp. Agric. 51: 451-66.
Mathur, M. and A. Goel. 2017. Essential Plant Nutrients. In: M. Naeem, A. A. Ansari and S. S. Gill (Eds.), Essential Plant Nutrients: Uptake, Use Efficiency, and Management. Springer International Publishing, Cham, Switzerland.
Motsa, N. M., A. T. Modi and T. Mabhaudhi. 2015. Sweet potato (Ipomoea batatas L.) as a drought tolerant and food security crop. S. Afr. J. Sci. 111: 1-8.
Pereira, L. M., E. M. Pereira, L. T. M. Revolti, S. M. Zingaretti and G. V. Moro. 2015. Seed quality, chlorophyll content index and leaf nitrogen levels in maize inoculated with Azospirillum brasilense. Rev. Ciênc. Agron. 46: 630-637.
Prasad, P. V. V., S. A. Staggenborg and Z. Ristic. 2008. Impacts of drought and/or heat stress on physiological, developmental, growth, and yield processes of crop plants. In: L. R. Ahuja, V. R. Reddy, S. A. Saseendran and Y. Qiang, (Eds.), Response of Crops to Limited Water: Understanding and Modeling Water Stress Effects on Plant Growth Processes. 1st ed. American
Society of Agronomy, Crop Science Society of America, Soil Science Society of America, USA, pp. 304-308.
Robinson, D., L. L. Handley, C. M. Scrimgeour, D. C. Gordon, B. P. Forster and R. P. Ellis. 2000. Using stable isotope natural abundances (δ15N and δ13C) to integrate the stress responses of wild barley (Hordeum spontaneum C. Koch.) genotypes. J. Exp. Bot. 51: 41-50.
and resource availability in the desert shrub Larrea tridentata. In: J. R. Ehleringer, A. E. Hall and G. D. Farquhar (Eds.), Stable Isotopes and Plant Carbon-Water Relations. Academic Press Inc., San Diego, California, p. 177.
Sahoo, M. R., M. Dasgupta, P. C. Kole and A. Mukherjee. 2010. Biochemical changes in leaf tissues of taro [Colocasia esculenta L. (Schott)] infected with Phytophthora colocasiae. J. Phytopathol. 158: 154-159.
Salehi-Lisar, S. Y. and H. Bakhshayeshan-Agdam. 2016. Drought stress in plants: Causes, consequences, and tolerance. In: M. A. Hossain, S. H. Wani, S. Bhattacharjee, D. J. Burritt and L. S. P. Tran (Eds.), Drought Stress Tolerance in Plants: Physiology and Biochemistry. 1st ed. Springer, Switzerland, pp. 1-8.
Sharma, H. K. and P. Kaushal. 2016. Introduction to tropical roots and tubers. In: H. K. Sharma, N. Y. Njintang, R. S. Singhal and P. Kaushal (Eds.), Tropical Roots and Tubers Production, Processing and Technology. 1st ed. John Wiley and Sons Ltd.,
Oxford, pp. 1-22.
Siddiqi, M. Y. and Glass, A. D. M. 1981. Utilization index: A modified approach to the estimation and comparison of nutrient utilization efficiency in plants. J. Plant Nutr. 4: 289-302.
Steenbjerg, F. and S. T. Jakobsen. 1963. Plant nutrition and yield curves. Soil Sci. 95: 69-88.
Tiwari, R. and H. M. Mamrutha. 2013. Precision phenotyping for mapping of traits for abiotic stress tolerance in crops. In: R. K. Salar, S. K. Gahlawat, P. Siwach and J. S. Duhan (Eds.), Biotechnology: Prospects and Applications. 1st ed. Springer,
Sirsa, India, p. 84.
Undersander, D., Mertens, D. R. and Thiex, N (Eds). 1993. Two step total dry matter determination of wet samples. In: D. Undersander, D. R. Mertens and N. Thiex (Eds.), Forage Analysis Procedures. National Forage Testing Association, Omaha, pp. 24-26. Van den Boogaard, R., S. Kostadinova, E. Veneklaas and H. Lambers.
1995. Association of water use efficiency and nitrogen use efficiency with photosynthetic characteristics of two wheat cultivars. J. Exp. Bot. 46: 1429-1438.
Wang, J., Y. Zhou, C. Dong, Q. Shen and R. Putheti. 2009. Effects of NH4+-N/NO3--N ratios on growth, nitrate uptake and organic acid levels of spinach (Spinacia oleracea L.). Afr. J. Biotechnol. 8: 3597-3602.
Yuan, S. and S. Peng. 2017. Exploring the trends in nitrogen input and nitrogen use efficiency for agricultural sustainability. Sustainability, 9: 1-15.
Zlatev, Z. and F. C. Lidon. 2012. An overview on drought induced changes in plant growth, water relations and photosynthesis. Emir. J. Food Agric. 24: 57-72.