i
UNIVERSIDADE DA BEIRA INTERIOR
Engenharia
Air budJets: A VTOL virtual operator company
in Portugal
(Versão corrigida após defesa)
Manuel Mendes Duarte
Dissertação para obtenção do Grau de Mestre em
Engenharia Aeronáutica
(Ciclo de estudos integrado)
Orientador: Prof. Doutor Jorge Miguel dos Reis Silva
iii Para a minha família,
v “When Henry Ford made cheap, reliable cars, people said, 'Nah, what's wrong with a horse?' That was a huge bet he made, and it worked” Elon Musk
vii
Agradecimentos
Em primeiro lugar, agradeço ao Professor Jorge Reis Silva que desde muito cedo me acolheu no NIT e encaminhou-me ao longo desta etapa académica.
Agradeço ainda à Engª. Emília Baltazar, que me ajudou constantemente, mostrou-me ferramentas e métodos importantes para a elaboração de artigos e da dissertação de mestrado. Ao Professor António José da Silva Pires, docente do Departamento de Gestão e Economia, por me ter recebido e partilhado conhecimentos e ferramentas para a elaboração de um plano de negócios.
De modo a perceber a posição dos empresários da região da Covilhã e Castelo Branco sobre a necessidade de transportes na região, agradeço ao Eng.º Jorge Amaral da Mecalbi, à Eng.ª Lurdes Carvalho da Quinta dos Termos, à Dr.ª Giovana Cabral da Twintex e por fim à Dr.ª Maria Carlos do Associação Empresarial da Beira Baixa por me terem concedido tempo para os consultar e entrevistar.
Quero ainda agradecer, de uma forma muito especial, à Engª Cláudia Pires, que me apoiou e acreditou em mim desde o início, por me ter ajudado em todos os trabalhos, pesquisas, projetos e na elaboração das aplicações que guiaram ao culminar desta etapa.
Por fim, agradeço à minha mãe, ao meu pai e aos meus dois irmãos que de uma forma menos direta me apoiaram e contribuíram também para a realização deste trabalho.
ix
Abstract
The aeronautical industry is evolving very rapidly mainly due to the development of technology. These technological advances have allowed the Man to develop projects that are very ambitious as is the case of "flying cars".
This concept has been developed since the '80s, but only now have arisen prototypes capable of satisfying this dream. With this, the appearance of VTOL aircraft, aircraft capable of taking off and landing vertically, without needing any runways to do so. For this project, helicopters are not considered as VTOL aircraft because they are not very energy efficient. Many companies have developed VTOL aircraft, with design and consequently characteristics very different from each other, but having in common being hybrid or fully electric aircraft.
For this study, a "fictitious" airline company was created using VTOL aircraft. The service characterization was then carried out, where using localization algorithms and trajectory optimization, we were able to elaborate an application (software) that treats the data of the flights to the marked ones by clients to optimize the routes/trajectories of the flights. Then the elaboration of a model and a business plan was made, and it is possible to observe the viability of the economic-financial results of the new (fictitious) company.
Keywords
VTOL aircraft; Business model; Business plan; Peripheral regions; Mobility; Network optimization; Operational performance.
xi
Resumo
A indústria aeronáutica está a evoluir muito rapidamente sobretudo devido ao desenvolvimento da tecnologia. Estes avanços tecnológicos têm permitido ao Homem desenvolver projetos há muito ambicionados como é o caso dos “carros voadores”.
Este conceito tem vindo a ser desenvolvido desde os anos 80, mas só agora surgiram protótipos capazes de satisfazer este sonho. Com isto o aparecimento de aeronaves VTOL, aeronaves capazes de descolar e aterrar na vertical sem necessitar de quaisquer pistas para o fazer. Para este projeto não são considerados aeronaves VTOL os helicópteros pois estes são pouco eficientes energeticamente. Muitas empresas têm desenvolvido aeronaves VTOL, com design e consequentemente características muito diferentes entre si, mas que tendo em comum serem aeronaves híbridas ou totalmente elétricas.
Para este estudo foi então criada uma empresa “fictícia” de transporte aéreo que utiliza aeronaves VTOL. Foi então feita a caracterização do serviço, onde utilizando algoritmos de localização e de otimização de trajetórias, fomos capazes de elaborar uma aplicação (software) que faz o tratamento dos dados dos voos já marcados por clientes para otimizar as rotas/trajetórias desses voos. Depois a elaboração de um modelo e de um plano de negócios foi possível observar a viabilidade dos resultados económico-financeiros da nova empresa (fictícia).
Palavras-chave
Aeronaves VTOL; Modelos de negócios; Plano de negócios; Regiões periféricas; Mobilidade; Otimização de rede; Desempenho operacional.
xiii
Resumo alargado
Introdução
Esta secção da dissertação de mestrado serve para explicar e demonstrar resumidamente o trabalho efetuado.
Em primeiro lugar é feito o enquadramento da dissertação, consecutivamente é explicado o caso de estudo e por fim são apresentadas as conclusões e as perspetivas de trabalhos futuros.
Enquadramento da dissertação
O aumento da população nas grandes cidades, como resultado do crescimento dos negócios e consequentemente o aumento da empregabilidade, contribuiu para o aumento do tráfego rodoviário, poluição do ar, ruído, acidentes rodoviários e tempo de viagem dentro das cidades. Por outro lado, há muitas outras empresas que, por fatores específicos, são atraídas para as regiões afastadas dos grandes centros urbanos - as regiões periféricas. Nestas regiões a ausência de redes de transporte como as oferecidas nos grandes centros urbanos, constituem um obstáculo às empresas localizadas nas regiões periféricas.
O aumento da competitividade empresarial, a globalização e a internacionalização das empresas são tendências crescentes, sendo por isso necessário fazer um grande número de viagens. Assim, a flexibilidade, a mobilidade e a velocidade são características fundamentais exigidas às empresas.
Um novo meio de transporte que tem vindo a ser desenvolvido nos últimos anos e que promete chegar ao mercado muito em breve, são as aeronaves Vertical Take Off e Landing (VTOL) e que irão revolucionar o conceito de aviação no mundo. Essas aeronaves serão essenciais para desenvolver um novo conceito de aviação executiva. Assim, neste trabalho, apresentamos uma possível solução que melhorará a mobilidade e a conectividade entre empresas localizadas em grandes centros urbanos e regiões periféricas.
Objetivos
O objetivo desta dissertação é criar uma empresa virtual que opere aeronaves VTOL, garantindo a viabilidade técnica e económica do plano de negócios resultante. Há ainda um conjunto de sub objetivos que pretendemos cumprir: calcular a localização ideal das bases de estacionamento VTOL, projetar duas aplicações para a marcação de voos e efetuar a otimização das trajetórias, e criar um modelo e um plano de negócios para um serviço sustentável de VTOL.
Caso de estudo
No caso de estudo da dissertação apresentamos a caracterização do serviço, o modelo de negócio e o plano de negócio.
xiv
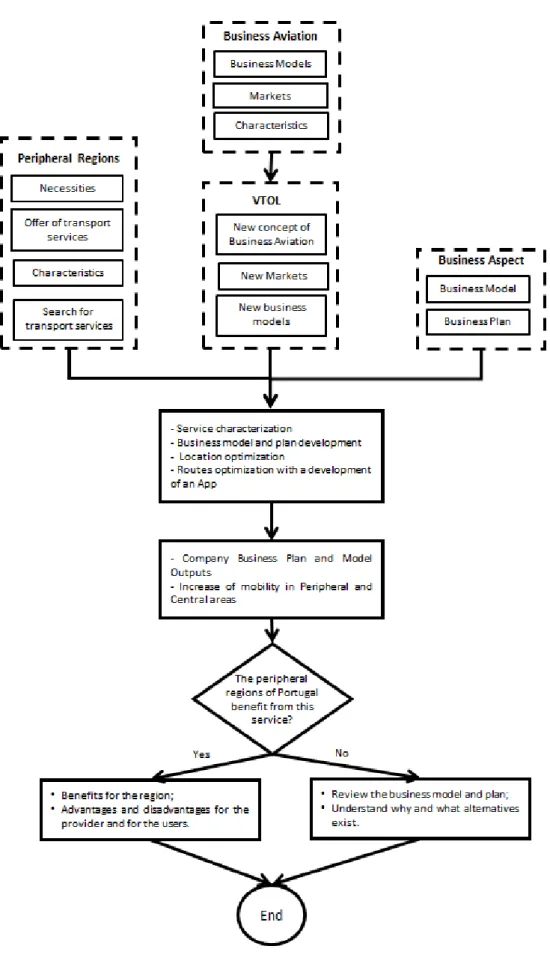
Na caracterização do serviço apresentamos uma empresa fictícia/virtual que operará as aeronaves VTOL, apresentando os seus serviços. Mostramos ainda as características do veículo que esta poderia operar – Lilium jet. Apresentamos ainda as trajetórias que inicialmente iriam existir, os locais para onde voaria e onde iria localizar cada base de estacionamento. Neste subcapítulo do caso de estudo apresentamos a lógica, através de dois fluxogramas, do funcionamento das duas aplicações projetadas, uma aplicação para o cliente reservar os seus voos e outra para a empresa otimizar as trajetórias.
Na parte do modelo de negócio descrevemos e preenchemos os vários blocos do canvas de Osterwalder. No plano de negócios apresentamos as estruturas de custo e as fontes de receita e preenchemos um exemplo de um plano de negócios, projetado para os 5 primeiros anos. Este caso de estudo foi desenvolvido tendo em conta a sustentabilidade da empresa que idealizamos e, claro, a carteira do cliente.
Principais conclusões
Nas conclusões deste estudo apresentamos os resultados do projeto das duas aplicações, analisamos o plano de negócios com um especial enfase nos custos, receitas e lucro. Depois apresentamos uma comparação entre as aeronaves VTOL e outros meios de transporte. No desenvolvimento das aplicações, a aplicação do cliente mostra uma primeira página com a possibilidade de escolher o tipo de voo, privado ou partilhado. Consoante a escolha, a página que possibilitará a marcação do voo será diferente.
Caso o cliente prefira um voo não partilhado, terá de preencher os dados referentes à partida e ao destino, como o país, distrito, localidade, nº de passageiros, data e hora.
Caso escolha um voo partilhado o formulário de preenchimento será diferente. É mostrada uma lista com todos os voos que tenham escolhido partilhar o voo, sendo possível ao cliente “reservar um lugar” nesse voo ou caso não haja nenhum do seu interesse reservar um novo, que por sua vez será acrescentado àquela lista.
A aplicação da empresa aplica os algoritmos de otimização de trajetória do Caixeiro viajante e de Clarke e Wright (Clarke, G. and Wright, J.W,1964), mostrando no fim os voos nas suas trajetórias otimizadas e os outros que não sofreram otimização.
Na análise do plano de negócios, analisamos os inputs e os outputs deste. Daqui destacamos que ao longo de 5 anos, e como mostra a tabela 4.4, no capítulo 4, embora tenhamos um resultado líquido negativo durante os dois primeiros anos de atividade, ou seja, a empresa sofrerá perdas nesses dois anos, espera-se que a empresa lucre no terceiro, quarto e quinto anos de atividade. Podemos ver que haverá uma evolução positiva ao longo dos anos, reforçando a importância deste projeto.
Por fim comparando o transporte feito por uma aeronave VTOL com outros meios de transporte é visível que o tempo de viagem é muito menor quando feito por um VTOL, sendo o preço
xv bastante competitivo quando comparado com um táxi, mas bastante superior aos restantes modos de transporte, como o autocarro, o comboio ou carro pessoal.
Perspetivas de investigação futuras
Para que este projeto possa num dia tornar-se real é preciso que muito trabalho e mais estudos sejam feitos ou completados. Alguns destes são:
• Enquadramento legal destas aeronaves no setor aéreo; • Estudos sobre o controlo específico de tráfego aéreo;
• Desenvolvimento e melhoria da aplicação do cliente, criando a versão mobile da mesma;
• Criação ou aplicação de algoritmos de otimização de trajetórias mais inteligentes; • Estudar a aplicação destes serviços noutros países.
xvii
Table of contents
Agradecimentos ... vii
Abstract ... ix
Resumo ... xi
Resumo alargado ... xiii
List of tables ... xxi
List of acronyms ... xxiii
Chapter 1- Introduction ... 1
1.1 Motivation ... 1
1.2 Object and objectives ... 2
Chapter 2- State of the art... 5
2.1 Introduction ... 5
2.2 Small aircraft transportation system (SATS) concept ... 5
2.2.1 Accessibility ... 5
2.2.2 Affordability ... 6
2.2.3 Impact on the environment ... 6
2.2.4 The market potential of SATS ... 6
2.2.5 Business aspect ... 6
2.2.6 Safety ... 7
2.3 Vertical takeoff and landing aircraft (VTOL) ... 7
2.3.1 Concept and development ... 7
2.3.2 Regulation ... 10
2.3.3 Technology ... 11
2.3.4 Infrastructure ... 11
2.3.5 Air traffic management ... 12
2.3.6 Safety ... 12
2.3.7 Psychological barriers ... 13
2.3.8 Advantages of vertical mobility ... 13
2.4 Peripherally and accessibility ... 14
2.4.1 A geographical approach of the periphery ... 14
2.4.2 Economic approach of the periphery ... 14
2.4.3 Accessibility ... 15
2.4.4 Market potential ... 15
2.4.5 Location and access time ... 16
2.4.6 Study framework ... 17
2.5 Business models ... 17
2.5.1 Osterwalder business model ... 18
2.6 Business plan ... 20
xviii
2.7 Conclusion ... 22
Chapter 3- Methodology ... 23
3.1 Introduction ... 23
3.2 Traveling salesman problem ... 23
3.2.1 The Nearest Neighbor Rule (NNR) ... 25
3.3 Clarke and Wright algorithm ... 27
3.4 The compensation heuristics ... 31
3.5 Conclusion ... 34
Chapter 4 – Case study ... 35
4.1 Introduction ... 35 4.2 Service characterization ... 35 4.2.1 The company ... 35 4.2.2 Vehicle: ... 37 4.2.3 Overall characteristics: ... 40 4.2.4 Routes: ... 41
4.2.5 Location of Air budJets bases in each region: ... 44
4.2.6 Optimization of Air budJets routes: ... 45
4.3 Air budJets business model ... 53
4.4 Business plan ... 55
4.4.1 Cost structure ... 55
4.4.2 Revenue streams ... 60
4.4.3 Business plan ... 60
4.5 Conclusion ... 68
Chapter 5 – Discussion of the results ... 69
5.1 Introduction ... 69
5.2 App’s development ... 69
5.3 Business plan ... 73
5.4 Comparison between actual transportations and Air budJets transportation ... 76
5.5 Conclusion ... 79
Chapter 6 – Conclusions ... 80
6.1 Dissertation synthesis ... 80
6.2 Final considerations ... 81
6.3 Prospects for future work ... 81
References ... 83
Annex 1 - Application of Compensation Heuristics ... 87
Annex 2 - Others results of the Business Plan ... 97
Annex 3 - Travel possibilities - features ... 101
xix
List of figures
Figure 1: Dissertation methodology (own elaboration). ... 4
Figure 2: Specifications for some VTOL models in development (Lineberg, R. et all, 2018). .... 9
Figure 3: Example of integration of a VTOL transport network in urban areas (Grandl, G. et all, 2018). ... 12
Figure 4: Combination of a VTOL service with land transport (Grandl, G. et all, 2018). ... 14
Figure 5: Distribution of Purchasing Power per capita by Municipality (at Left) and population density map by the municipality (at Right), in Portugal. (INE, IGP, & PORDATA, 2017; INE & PORDATA, 2016) ... 16
Figure 6: Osterwalder nine blocks canvas (Osterwalder, 2010). ... 19
Figure 7: Porter’s five forces model (Porter, M., 1979). ... 21
Figure 8: Distance between points (own elaboration). ... 26
Figure 9: Representation of NNR (own elaboration). ... 26
Figure 10: Solution for the placement of a depot in city 1 (own elaboration). ... 26
Figure 11: Final path when applied the NNR (own elaboration). ... 27
Figure 12: Costs of traveling from each city to the deposit (own elaboration). ... 30
Figure 13: Results from implementing the Clarke and Wright algorithm (own elaboration). .. 31
Figure 14: Permissible solution using compensation heuristics (own elaboration)... 34
Figure 15: Travel between Seixal and Lisbon airport by Air budJets (A) and by car (B) (own elaboration). ... 36
Figure 16: Travel between Castelo Branco and Lisbon airport by Air budJets (A) and by car (B) (own elaboration). ... 36
Figure 17: Lilium Jet aircraft (Lilium GmbH, 2018). ... 37
Figure 18: Electric jet engines (Lilium GmbH, 2018). ... 38
Figure 19: Example of Ultra-Redundancy (Lilium GmbH, 2018). ... 39
Figure 20: Example of the use of the parachute (Lilium GmbH, 2018). ... 40
Figure 21: Regions of Portugal used for the study (own elaboration). ... 41
Figure 22: Client APP flowchart (own elaboration) ... 46
... 46
Figure 23: Air budJets routes optimization app basic flowchart (own elaboration). ... 47
Figure 24: Mapping of routes with a distance greater than 100km from Air budJets (own elaboration). ... 48
Figure 25: Business model canvas filled (own elaboration). ... 55
Figure 26: Cost structure chart (adapted from Holden, J., & Goel, N., 2016) ... 59
Figure 27: Methodology used to elaborate on the business plan of Air budJets (own elaboration). ... 61
Figure 28 Client’s application: first page - private or shared flight (own elaboration). ... 69
Figure 29: Client’s application: Form - Private Flight (own elaboration). ... 70
xx
Figure 31: Client’s application - form for a shared flight (own elaboration). ... 72 Figure 32: Company application (own elaboration). ... 72
xxi
List of tables
Table 1: Applications for VTOL aircraft (Lineberg, R. et all, 2018). ... 10
Table 2: Distance between points (own elaboration). ... 25
Table 3: Costs of traveling from each city to another(own elaboration). ... 29
Table 4: Table of costs of distances and installation of equipment (own elaboration). ... 33
Table 5: Detailed technical data from Lilium Jet (adapted from (Lilium GmbH, 2018). ... 40
Table 6: Distances between each point in the Lisbon region in a straight line in km (own elaboration). ... 42
Table 7: Distances between each point in the Oporto region in a straight line in km (own elaboration). ... 43
Table 8: Distances between each point in the Coimbra region in a straight line in km (own elaboration). ... 44
Table 9: Distances between the various Portuguese and Spanish cities (own elaboration). ... 48
Table 10: Three cases to explore sensitivities for time-based assumptions across piloting, vehicle price and battery cost (Holden, J., & Goel, N., 2016). ... 56
Table 11: General business plan assumptions (own elaboration). ... 61
Table 12: Inputs do the business plan (own elaboration)... 62
Table 13: Inputs financing (own elaboration). ... 64
Table 14: Outputs: Estimated Income Statement (own elaboration). ... 65
Table 15: Outputs - financial plan (own elaboration). ... 66
Table 16: Outputs: Project Evaluation (own elaboration). ... 67
Table 17: Table of support for the calculation of Inter-Regional service income (own elaboration). ... 73
Table 18: Table of support for the calculation of interregional service income (own elaboration). ... 74
Table 19: Example of a trip from Covilhã to Lisbon airport (own elaboration). ... 77
Table 20: Example of the trip from Almada to Sintra (own elaboration). ... 78
Table 21: Example of travel from Vila Real de Santo António to Málaga (own elaboration). .. 78
Table 22: Example of trip from Évora to Mérida (own elaboration). ... 79
Table 23: Distances between each point in the Lisbon region in a straight line in km (own elaboration). ... 87
Table 24: Sum of the distances between each point of the Lisbon region (own elaboration). 87 Table 25: Calculation of the cost of changing the location of the installation of the company base (own elaboration). ... 88
Table 26: Distances between each point in the Oporto region in a straight line in km (own elaboration). ... 91
Table 27: Sum of the distances between each point in the Oporto region (own elaboration). 91 Table 28: Calculation of the cost of changing the location of the installation of the company base (own elaboration). ... 92
xxii
Table 29: Distances between each point in the Coimbra region in a straight line in km (own elaboration). ... 94 Table 30: Sum of the distances between each point of the region of Coimbra (own elaboration). ... 95 Table 31: Calculation of the cost of changing the location of the installation of the company base (own elaboration). ... 95 Table 32 Outputs: Balance Sheet (own elaboration). ... 97 Table 33: Outputs: Main indicators (own elaboration). ... 98 Table 34: Examples of travel possibilities (own elaboration) ... 101
xxiii
List of acronyms
VTOL Vertical Take Off and Landing SATS Small Aircraft Transportation System
EPATS-STUDY European Personal Air Transportation System – Study
IRR Internal Rate of Return
EU PART OPS European Union Part Operations
FAA Federal Aviation Administration
EASA European Aviation Safety Agency
NASA National Aeronautics and Space Administration eVTOL Electric Vertical Take Off and Landing
SWOT Strengths Weaknesses Opportunities and Threats
TSP Travelling Salesman Problem
NNR Nearest Neighbor Rule
TBO Time Between Operations
HR Human Resources
WACC Weighted Average Cost of Capital V.R.S.A. Vila Real Santo António
BN Business Volume
1
Chapter 1- Introduction
1.1 Motivation
Increasing business competitiveness, globalization and the internationalization of companies are growing trends, being often necessary to make a great number of trips. Thus flexibility, mobility, and speed are fundamental characteristics required from companies nowadays. In the last decades, there has been a migratory increase from peripheral areas to large urban areas, a behavior conditioned by natural and human factors. Among the natural factors, the climate, soil relief, and fertility, which, when favorable, facilitate the practice of agriculture and promote the development of transport and communications are the ones who influence most this distribution.
But more than natural factors, human factors are currently the best explanation for the regional asymmetries observed in population distribution. It is, in fact, on the coast that most of the cities are located, becoming true poles of attraction and population establishment, for the job offer, generated by the intense commercial and industrial activity and by the many services and facilities that are provided to its population.
Over the last years, we have witnessed a major development of large urban centers. New transport networks were built (not only at the road level but also at sea and air) that allowed these centers to become centers of attraction and fixation of companies (which activity and contacts became facilitated).
Increased population in large cities, as a result of business growth and increased employment, contributes to increased road traffic, air pollution, noise, road accidents, travel time within cities, among other factors.
In the other hand, there are, however, companies that by specific factors are attracted to the regions away from the large urban centers – the peripheral regions. These companies represent great importance to the local and national economy since they export a large part of their production. Many of these exportations’ contracts imply a large amount of business travels to the countries to which they export or may export.
In the absence of transport networks as big as the ones offered at large urban centers, firms located in peripheral regions are faced with the obstacle of distance to external markets. It should be noted that distance is not measured with measures of length but rather with measures of time. Therefore, a place is more (or less) distant depending on the time it takes to get there. Thus, the major problem that companies located in these regions have is the time they take to travel to international airports, where sometimes the time they take to get to the airport is longer than the travel time from the airport to the destination.
Currently, the fastest, more flexible and more practical mode of transport is undoubtedly business aviation.
Business aviation is a segment of general aviation that explores a niche market of air transport with very specific characteristics. This transportation mode came to meet the demand for private flights, often in different routes than those used by civil and military aviation.
Business aviation can be also defined as a sector of aviation which concerns the operation or use of aircraft by companies for the carriage of passengers or goods as an aid to the conduct of their business, flown for purposes generally considered not for public hire and piloted by individuals having, at the minimum, a valid commercial pilot license with the instrument rating. The increasing need for speed and predictability led to a worldwide constant increase in business aviation. Large companies from all regions of the world, at different stages of economic and business cycles, require the use of business aviation to properly position themselves to capture value as market conditions evolve.
Unfortunately, this transportation mode is not accessible to all, its high costs do not allow that many companies and individuals make use of it.
A new means of transportation has been developed in recent years and promises to reach the market very soon, Vertical Take Off and Landing aircraft (VTOL) will revolutionize the concept of aviation in the world. These aircraft will be essential to develop a new concept of executive aviation. Thus, in this work, we present a possible solution that will improve the mobility and speed of movement of companies located in large urban centers and peripheral regions.
1.2 Object and objectives
The objects of this dissertation are the VTOL, the periphery and level of accessibility of regions, the business model and the business plan.
The main objective of this dissertation is to create a virtual company that operates VTOL aircraft, ensuring the technical and economic viability of the resulting business plan. There is also a set of sub-objectives that we want to accomplish: to calculate the ideal location of VTOL parking bases, to design two applications for flight booking and to optimize the routes, and to create a model and a business plan for a sustainable service of VTOL.
1.3 Dissertation structure
The first chapter of this dissertation is the study introduction, which is divided into three sub-chapters, the motivation, the object and objective, and the structure of the dissertation. The development of this dissertation starts with a state of art review where the following concepts are approached: small aircraft transport systems, VTOL, peripherally and accessibility and business models.
The third chapter is dedicated to the methodologies used to make the network optimization and the selection of the best location, that will be used to sustain the case study. These methodologies are the traveling salesman problem, the Clarke and Wright algorithm, and the compensation’s heuristics.
In the fourth chapter, the case of study is presented and analyzed. That is, the characterization of a new transportation service is made, and its business model and business plan are developed. To help to understand how this new service works, two software applications are developed and presented: one directed to clients and another one that manages the entire service (manages the client's requests, optimizes routes according to booked flights, among other features).
The fifth chapter addresses the discussion of the results and the seventh chapter contemplates the dissertation synthesis, the final considerations and the prospects for future work regarding business transportation.
Chapter 2- State of the art
2.1 Introduction
This chapter provides a general state of the art and literature review concerning the small aircraft transport system, vertical take-off, and landing aircraft, the peripherally and accessibility, the business models and mobility servicing. The bibliographic review on all these topics is fundamental for the interpretation of a problem that exists and how it can be overcome.
It begins by approaching small aircraft transport systems (SATS) where we talk about their accessibility, their affordability, and their market potential. Obviously, the impact on the environment and safety cannot be bleached topics when we talk about the SATS.
The concept, the development, and the regulation of VTOL is described, and the mobility advantages that these aircraft will bring are also mentioned.
A review of the state of art on peripheral regions and accessibility is described, where a geographic and economic approach of the periphery is made and the concepts of market potential, location and time of accessibility access are analyzed.
The concepts of the business model and business plan are also approached. Finally, a brief conclusion is made regarding this chapter.
2.2 Small aircraft transportation system (SATS) concept
Some regions are not served by air transport or high-speed trains which results in a substantial need for road travel for short to medium distances. The Small Aircraft Transport System (SATS) aims to answer the specific needs of business and other users of these regions, filling a gap between surface transport and regular mass air transport. Using small aircraft and local and regional airports/airfields will allow access to more communities in less travel time.
The main idea of this system “is to shift a part of medium/long distance passenger car trips to small aircraft to improve the efficiency of passenger transport, relieve the congestion on roads and thus reduce the environmental impact” (Krzysztof, 2009:2). Considering the travel cost and the value of time saved by air travel, SATS will offer an attractive alternative to travel by car for distances greater than 200 kilometers.
2.2.1 Accessibility
According to Krzysztof Piwek “The FP6 project EPATS-STUDY (European Personal Air Transportation System - Study) showed that the currently available airport infrastructure (2570 airports and airfields in Europe) is sufficient to provide easy access to all European communities. About 60% of the European population is living within 20 kilometers from the nearest regional airport, whilst for 95% of the European population, the nearest regional airport
is within fewer than 40 kilometers. The existing airport infrastructure will be sufficient (SATS will use satellite CNS and satellite-based landing aids)” (Krzysztof, 2009:2).
2.2.2 Affordability
Calculations show that small aircraft transportation is cost effective compared to road traffic over distances greater than 200 kilometers. Using modern mass-produced small aircraft based on advanced technology and an intelligent transport business model, SATS will be affordable, and once full maturity is reached, costs will be similar or less than car travel (Krzysztof, 2009). 2.2.3 Impact on the environment
The environment remains the main policy area where further improvements are necessary. The impact of different modes of transport on the environment is usually assessed by costs externalities measurements. Many types of research were made to compare road and air transport. In all cases, the impact of air transport on the environment is much friendlier than in the case of road transport; it concerns noise pollution, local air pollution, traffic congestion, crash and others (Krzysztof, 2009).
2.2.4 The market potential of SATS
EPATS-STUDY showed that small aircraft transportation is beneficial for business travel in Europe, especially in southern France, Spain, Portugal and Italy, as well as in Eastern Europe, adding a new relevant market towards the current business aviation market which is currently more mature between London and Milano (Krzysztof, 2009).
2.2.5 Business aspect
The business cases are generated by straight forward choices but have complex operational characteristics. Operational characteristics and elements of the business cases include (Krzysztof, 2009):
• Totally on-demand: the passenger is free to choose the final airport destination and the flight time. He always flies without other non-related passengers;
• Semi-on-demand: the passenger is bounded in his departure and destination airport choice, but can choose its own flight time;
• Per seat on-demand (net-centric case): the passenger is free to decide his final departure and destination airport; other non-related passengers may accompany the original passenger to the same destination. Consequentially the passenger can choose a flight time interval for departure, whereas the operator decides the ultimate intermediate departure time of all passengers. The higher the interval the lower the charter price;
• Aircraft fleet: passengers are free to choose different aircraft type according to their demands.
The structure of the SATS network, planning, and service management are aimed at reducing empty flight seats, increasing fleet effectiveness and fuel efficiency, to minimize transportation costs (Krzysztof, 2009).
2.2.6 Safety
Using professional pilots for small transport aircraft operating both under Parts 91 and 135 of EU PART OPS, SATS will have a far lower accident rate than road transport. The challenge to SATS is to reach safety levels like those of current commercial air transport (Part 121 or EU OPS air carriers). Improved small aircraft will be based on new technologies that facilitate pilot situation awareness and flying in poor weather which will help to reach the projected safety levels (Krzysztof, 2009).
2.3 Vertical takeoff and landing aircraft (VTOL)
2.3.1 Concept and development
The development of technology is progressing rapidly, especially technology linked to the aircraft industry and the development of passenger drones and "traditional flying cars." These vehicle concepts have been developed since the 1980s and there are already several prototypes, most of which have the ability to take off and land vertically. A VTOL vehicle is an aircraft that takes off, flies and lands vertically, with no runways needed. For this project, the definition of VTOL excludes any type of helicopter. Although traditional helicopters operate in the same way, most are considered to be poorly energy efficient. Many companies are currently focused on electrical or hybrid-electric designs with VTOL capabilities. These vehicles, popularly called "flying cars" or passenger drones, are designed to (Lineberg, R. et al, 2018):
• Accommodate between two and five passengers or the equivalent load weight; • Be highly energy efficient, with low or zero emissions;
• Be quieter than a traditional helicopter.
There are three broad categories of VTOL vehicles for urban mobility, each with distinct characteristics and potential uses (Lineberg, R. et al, 2018):
• Passenger Drones: a passenger drone is expected to be an electric or hybrid-electric quadricopter (although some may have more than four rotors) that can be used to move people or cargo between established points. These vehicles can be piloted manually, remotely piloted or fully autonomous;
• Traditional flying cars: a traditional flying car would be a vehicle in which the driver/pilot can drive the vehicle in the car configuration up to an airport, reconfigure the vehicle's airplane mode and then fly to a destination airport. Currently, this aircraft would need to be operated by a licensed pilot but could become fully autonomous and driverless over time;
• Revolutionary vehicles: a combination of passenger drones and a traditional flying car, would be fully autonomous vehicles that can start or stop anywhere. These vehicles
have advanced VTOL capability and therefore can land and take off from virtually anywhere as they may not need an established airport. These would probably be piloted by a licensed pilot initially but could become totally autonomous over time.
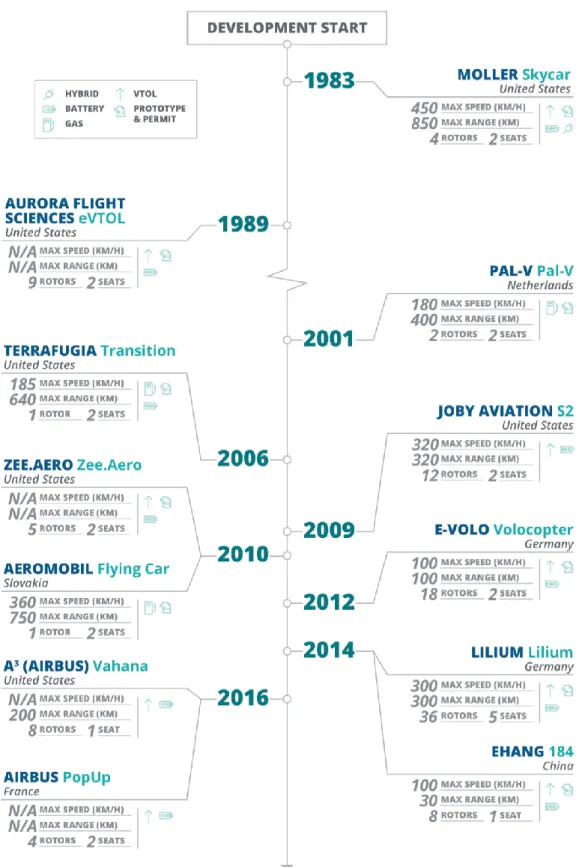
In Figure 2 we have some examples of the major manufacturers of these aircraft and the proposed models.
Many of these manufacturers have already gone through the design phase, and most of them are currently in the prototype and testing phase, with most manufacturers expecting to start delivering models by 2020 (Grandl, G. et all, 2018).
There are numerous potential applications for these new urban mobility vehicles as can be seen in Table 1.
Despite the technological progress and many potential applications of these aircraft, there are several challenges to be considered such as regulation, certification, infrastructure, and air traffic management.
2.3.2 Regulation
From the regulatory standpoint, the Federal Aviation Administration (FAA), as other equivalent agencies around the world, and transportation regulatory agencies need to assess the requirements for these types of transportation: Is a pilot license required? What airspace can these occupy? What are the airworthiness requirements of the vehicle? There has been progressing since the FAA has already begun discussing certification options with some manufacturers and believes that initially these vehicles should be manned, then autonomously
assisted and then converted into a fully autonomous aircraft at a later stage (Lineberg, R. et al, 2018).
2.3.3 Technology
In terms of technology, there are several considerations for manufacturers of VTOL's (Lineberg, R. et al, 2018):
• In a GPS denial environment, these vehicles would need sensors on board, such as radar, optical and geolocation sensors. Although these technologies exist and are being used in autonomous cars, they would have to be enhanced to provide the long-range sensing and recognition capabilities required to handle the multidirectional and convergence speeds associated with autonomous flight;
• These vehicles would require advanced technologies, such as artificial intelligence and cognitive systems, to enable advanced detection and prevention capabilities. Machine learning can be essential as operations go from piloting to autonomous: a vehicle would need to learn from the pilot's actions for thousands of operating hours to become fully autonomous over time;
• Energy management is crucial: carry a load of energy sufficient to carry passengers or cargo, maintain a margin of safety and recharge for the next flight. While battery technology is improving rapidly in order to increase passenger and cargo capacity and extend the ranges of passenger drones, it needs to improve further, or alternatives will have to be found.
2.3.4 Infrastructure
Infrastructure restrictions include proper take-off and landing zones, parking lots and battery recharging stations. A broad network of vertiports would require new infrastructures or modify and prepare existing infrastructures such as heliports, roofs of large public buildings and unused land.
To create a truly unified traffic management system, it may be necessary to install additional infrastructure along predefined flight corridors to assist in high-speed data communication and geolocation. All these changes in infrastructure would require the collaboration of stakeholders and local urban planning authorities (Lineberg, R. et al, 2018).
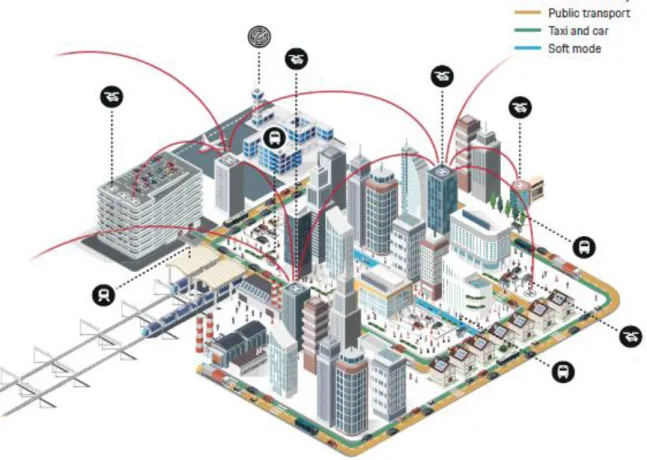
Figure 3 illustrates an example of integrating a VTOL transport network into the urban environment and the infrastructure used.
2.3.5 Air traffic management
A robust air traffic management system would have to ensure safe and efficient VTOL operations, which would meet the requirements of the FAA and the European Aviation Safety Agency (EASA). To this end, industry leaders and manufacturers are likely to agree on a reliable traffic management framework that integrates with other modes of transportation, especially in urban areas. In the United States, progress has already been made, with Uber and the National Aeronautics and Space Administration (NASA) recently signing a space saw agreement for the management of low-altitude autonomous vehicle traffic (Lineberg, R. et al, 2018). 2.3.6 Safety
For VTOL's adoption of passenger scale, operators of these vehicles would need to demonstrate a near-perfect safety record, covering both mechanical integrity and safe operations (Lineberg, R. et al, 2018).
As we have seen in autonomous cars, any accident can attract significant attention and slow down the pace of use. While facilitating mechanical integrity is easier, VTOL operations in suburban and urban areas may represent unique challenges (Lineberg, R. et al, 2018).
2.3.7 Psychological barriers
To other considerations, people also need to overcome any psychological barriers they may have associated with the idea of flying on an aircraft without a pilot, as these vehicles will eventually be autonomous.
In addition, for passenger drones and flying cars to be widely accepted, they would probably have to be ubiquitous and as versatile as a car - people should be able to take the vehicle to a store or take it to the beach and should be able to cover longer distances safely. Psychological barriers can be overcome if manufacturers and regulatory authorities ensure that these vehicles are as safe as an aircraft, and vehicles have well-documented safety records (Lineberg, R. et al, 2018).
2.3.8 Advantages of vertical mobility
Getting stuck in traffic is a worldwide phenomenon that has serious negative consequences in terms of wasted time as well as increased fuel consumption, higher emissions, and loss of quality of human life. The infrastructure provided by cities, to channel ever-increasing traffic flows, has reached its limit or is about to hit, often due to lack of funding, available space or both (Grandl, G. et al, 2018).
The increase of populations in the big cities, causes the population to spend more and lose more time along the way. Despite the worsening of road congestion, cities do not lose their attraction. The United Nations (UN) estimates that by 2050, 70% to 80% of the world's population will be urbanized, bringing with it new challenges and opportunities for more efficient and sustainable mobility solutions. Some of these solutions consist of leaving the traffic jams behind and literally raising a flight (Grandl, G. et al, 2018).
Saving time in transport - or avoiding traffic jams in the ground is the basic condition for this market to develop.
At the same time, the hub-to-hub architecture requires passengers to be transferred, which can be time-consuming. In most cases, vertical mobility will only gain against other modes of transport when passengers can save at least 20% of total travel time, despite transfers (Grandl, G. et al, 2018).
Customers already have a wide variety of modes in which VTOL's will have to find their space. At one end of the spectrum are fixed-line modes, such as subway, train or commercial airlines, which are expected to range from A to B. At another extreme are individual means of transport such as cycling, taxi or personal car. A perfect mobility-on-demand experience via personal flight will allow customers to quickly set up their itinerary, order their flight, catching ground transportation for a vertiport, board the electric VTOL (eVTOL) flight and, once landed, have a waiting service to travel the last kilometers to the final destination, as shown in Figure 4.
2.4 Peripherally and accessibility
The concept of peripherally is related to something (or someone) located in the periphery, that is in the limits or the circumference - in relation to a "center" (Silva, 2005).
2.4.1 A geographical approach of the periphery
From the geographical point of view, the periphericity can be considered as the location beyond the range that limits a certain area, precisely at the maximum distance from the respective geographic center. However, and in terms of regional development, the periphery should also reflect the distance to the most relevant economic activity/activities in the region, country, or even a group of countries.
In this sense, periphericity is marked by both the physical configuration of the territory and the geographic distribution of economic activities within it; that is: from the relationship with regional development it is observed that the periphericity is synonymous with relative accessibility - or inaccessibility - to the economic activity, as it is distributed geographically throughout the territory (Silva, 2005).
2.4.2 Economic approach of the periphery
The conditions of relative centrality or periphericity influence the industrial sector, both in terms of investment decision-making and in terms of competitive efficiency. In other words, variations in the degree of periphericity are reflected, in the direct ratio, in distance costs. The simplest way to assess distance costs in peripheral regions is to analyze the costs incurred by companies in, for example, transporting products to the market and accessing services and/or materials. These costs are lower for businesses located in the center. Transport costs are not the only costs attributable to the distance in peripheral regions, taking into account technological advances in recent years, telecommunication and access to information costs are further examples of what these regions have to endure at higher levels than in central regions.
Increased economies of scale (coupled with progress towards full European integration) also end up influencing the center-periphery relationship in areas such as industry growth and regional economic development. Central location, as it facilitates contact with broader market areas, leads - as a rule - to economies of scale in production, lower product costs, and significant sales increases. Clearly, firms located in central regions may also incur higher costs related, for example, to labor or the value of space; conversely, those of the periphery (Silva, 2005).
2.4.3 Accessibility
The concept of accessibility is intrinsic to the concept of peripherality. Accessibility translates the relative opportunities of interaction between companies and industries, distributed and confined to a given space. Reflecting the costs inherent to the distance in monetary terms, access time to the information, organizational adjustments, and other terms end up marking the differences between the region’s degrees of economic activity. The term accessibility closes (at least) two concepts: location and market potential (or economic), any of them important enough so that it does not go unnoticed in the approach to the theme that we intend to do (Silva, 2005).
2.4.4 Market potential
In a simplistic form, the designation of market potential is closely linked to the concept of population density (Silva, 2005).
If we look at the distribution of the main urban centers in Portugal (or if we look more closely at the population density of the country) we can easily conclude that a large part of the population is concentrated on the coast (with the exception of the Alentejo coast), within a territorial band covering Lisbon, Sintra, Vila Nova de Gaia and Oporto councils (INE, 2012). Outside this central nucleus, a considerable number of regions (Cascais, Loures, Braga, and Matosinhos) with high population emerge. Outside this ring, in turn, we find other important territorial spaces that assume certain relevance in the national context, such as Amadora and Almada (INE, 2012).
This very irregular distribution of the Portuguese population is conditioned by natural and human factors. Among the natural factors that most influence this distribution can be (Queirós, 2013):
• The climate: the milder and more humid climate of the coast has always been a factor of attraction for the Portuguese population since it favors the development of various human activities;
• The relief;
• The fertility of the soil: the fertile plains of the coast have always attracted the population, helping to fix it, as it facilitates the practice of agriculture and promotes the development of transport and communications.
But more than the natural factors, the human factors are the ones that best explain the regional asymmetries observed in population distribution. It is in fact on the coast that most of the cities are located, true poles of attraction and population fixation, for (Queirós, 2013):
• The job offers: generated by the intense commercial and industrial activity and by the numerous services and equipment available to the population;
• The existence of a dense transport network on the coast: reinforced by the intense port and airport activity, is a factor of attraction and fixation of numerous national and international companies that see, in this way, their activity and contacts facilitated, also contributing to fixing the population.
When we look closely at the map of the distribution of purchasing power per capita by the municipality and compare it to the population density map by the municipality (Figure 5Erro! A origem da referência não foi encontrada.), we conclude that wealth seems to be concentrated in the central regions.
Figure 5: Distribution of Purchasing Power per capita by Municipality (at Left) and population density map by the municipality (at Right), in Portugal. (INE, IGP, & PORDATA, 2017; INE & PORDATA, 2016) 2.4.5 Location and access time
Until very recently, and with due regard to network failures and quality, road distance was a tool used to assess market potential in any region, especially on the (economic) cost of market access. Currently, the distance has been relegated to a secondary plan, taking into account the time of access. The occurrence of this change is due not only to the increase in the quality of the networks but also to the progressive use of various modes of transport and to the variety of goods which have been transported. Taking into account the access time, we verified the change that this parameter will operate in the traditional model of accessibility based solely on distance. Let us see: certain peripheral regions (insular regions, for example) in an analogous situation can benefit compared to others located in continental spaces; especially if insular populations use the airplane as a regular mean of transport.
At the same time, many regions located on the mainland do not have any aerodrome locally open to commercial traffic, being completely dependent on terrestrial means of transport to
meet their communication needs, and considerable time is required to travel - by road or by railroad. However, this does not allow us to infer that insular spaces have (always) good accessibility. As a general rule, they depend on a single mode of transport, with infrequent connections, and on a limited range of destinations (Silva, 2005).
2.4.6 Study framework
As we have previously shown, the determination of the peripherality of a region imposes not only the geographic and economic analysis of the region but also an analysis of its level of accessibility. According to the national economic and geographic context, and looking at the accessibility that each region has, we can define as peripheral regions the Portuguese interior regions and as central the Portuguese coast regions, mainly the regions of Lisbon and Oporto. Thus, for this study we consider as central districts: Viana do Castelo, Braga, Oporto, Aveiro, Coimbra, Leiria, Lisbon, Santarém, Setúbal and Faro. Consequently the districts considered peripheral are: Vila Real, Bragança, Viseu, Guarda, Castelo Branco, Portalegre, Évora and Beja. Peripheral districts of Portugal:
The districts that we consider peripheral, although they have a small business fabric, compared to the central districts, are of great importance in the regional and national economy. In spite of the disadvantages that companies in these regions have to compare to companies in the central regions, such as the quality of transport networks, there are advantages that are important not to forget, such as cheaper labor and the lower spaces cost.
There are many companies that, in peripheral areas, export a large part of their production. Many exports involve a large amount of business travel to the countries to which they export or may export. The major problem that companies located in these regions have is the time they take to travel to international airports, with examples of traveling time to the airport being longer than the travel time from the airport to the international destination. To eliminate this problem, it would be important to improve the quality of the transport network serving these areas. Since air transport, more specifically the fastest and most flexible executive aviation service, the creation of an air transportation service in the peripheral areas would not only lead to an increase in the companies’ quality of transport but could also create a possible increase of the establishment of new companies.
2.5 Business models
The business model concept is relatively new, making its first peek at the beginning of this millennium, during the internet boom and the emerging of e-commerce transactions. Driving forces such as outsourcing and offshoring procedures, better economic perception and huge financial restructuration’s also boosted business model notions (Silva, 2014).
There is no overall established theory defining business models, instead, there are several designations proposed by different authors. Some examples of new business models that
emerged at the beginning of the millennium and that have changed the way business is done are:
• The Business Model for Disruption: In terms of money flow, disruptive entrepreneurs spend investors’ funds until they get big enough to figure out how to generate revenue on their own, some examples of this business model users are Facebook, Twitter and Pinterest (Berry, 2012).
• The Circular Shift, from Singular to Circular. Value is created in re-use and reduction of waste and a value proposition customer are willing to pay for (Pijl, P.2019).
• OGSM: The OGSM is developed by Marc van Eck and Ellen van Zanten of Business Openers into the Business plan on 1 page. Translated in several languages all over the world. The foundation of Business plan on 1 page is the OGSM - Objectives, Goals, Strategies and Measures (dashboard and actions) (Story, 2015).
• Business model canvas: As Osterwalder defines, “A business model describes the rationale of how an organization creates, delivers, and capture value” (Osterwalder, 2010:14).
The business model is how an organization creates and delivers value to customers, delineating the business logic necessary to generate profit. This view is shared by several authors such as Osterwalder. Osterwalder sees business models as a collection of organizational roles, system functionalities, detailed mechanisms descriptions and relationships among parties. He introduced a detailed analysis of business models in a simplified format with the nine-block canvas proposition. According to him, the business model is commonly associated as the company’s blueprint, revealing how an organization does business and interacts with other entities in order to generate profit (Osterwalder, 2010).
2.5.1 Osterwalder business model
The essence of business models is to create value for companies, customers and society. Osterwalder created an ontology for business models description, exploiting synergies and avoiding conflicts among the involved agents.
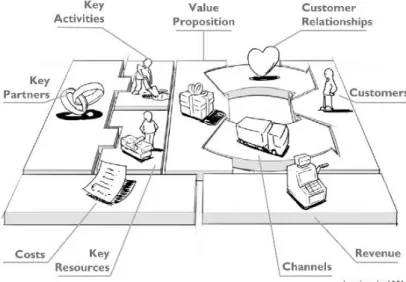
Osterwalder develops and proposes the nine blocks canvas. The business model canvas consists of nine interrelated building blocks, showing how a company or organization plans to make a profit. This canvas can be used to design business models but can also function as a diagnostic tool, helping in planning scenarios. The nine building blocks consist in (Osterwalder, 2010):
• Customer segments: define which clients or group of people the company intends to reach and serve with their products or services. This block is usually the starting point of designing a business model;
• Value proposition: describes a variety of products and services, or a combination of both, that an organization could do, creating added value to a specific customer segment;
• Channels: represents how an organization reaches its customer segments, delivering value propositions. Customers reach the company’s products and services through communication, distribution and sales channels;
• Customer relationships: type of relationship that an organization wants to have with their customer segments;
• The revenue streams: the cash flow generated by offering a product or service to customer segments. This can be generated through asset sales, usage fees, renting or leasing;
• Key resources: the required assets to practice a certain business model. Through customer segments, profiting with this operation these resources allow a company to create and offer value propositions into the market;
• Key activities: for a business model to work, a company must produce or provide key activities to their customers that combined with key resources must offer a value proposition, reaching customer segments through channels;
• Key partnerships: creating strategic partnerships with important suppliers and partners enables business model’s optimization, reducing risks and acquiring resources;
• Cost: this building block describes the most important induced costs of running a business model. To create revenues, a company must support the running costs of making and delivering products.
We chose the Osterwalder business model because this model fits well in the type of business that we intend to develop. Figure 6 shows how these blocks are organized and interconnected.
2.6 Business plan
A business plan describes what the new activity intends to fulfill. They usually have two different uses: inside and outside the company. Inside the company, the plan helps to develop a “roadmap” with the steps to follow while the plan and strategies are implemented. Outside the company, it gives to the stakeholders and potential investors the business opportunity that the company strives for and how it plans to do so (B. Neto, C. Carvalho, and J. Silva, 2010)
.
In order to prepare a business plan, it is necessary to conduct at least three main studies (Pires, 2017):• Market study: where a comprehensive and sectoral analysis, a market analysis, a strategic analysis and finally a marketing plan are carried out;
• Technical study: where a production plan or operations and human resources and organizational plan are drawn up;
• Economic-financial feasibility study: where an economic-financial plan and a sensitivity analysis are made.
2.6.1 Market study
Surrounding environment analysis:
In the surrounding environment analysis, we can divide the surrounding environment into two means (Pires, 2017):
• Contextual environment means: it covers the political-legal context, the economic context, the socio-cultural context and the technological context of the country or region;
• Transactional environment means: constituted by the customers, the suppliers, the community and the competitors.
Market analysis:
In market analysis, the geographic area of influence (company's area of activity), the market’s size and the prospects for this market (forecasting the evolution of demand) are analyzed and defined. This allows knowing not only who the customers/consumers are, the products/services, the motivation of the purchase, the size of the market, the distribution channels and the price level, but also who is the competitor, the competing products/services, market shares, distribution markets and the price and conditions of sale (Pires, 2017).
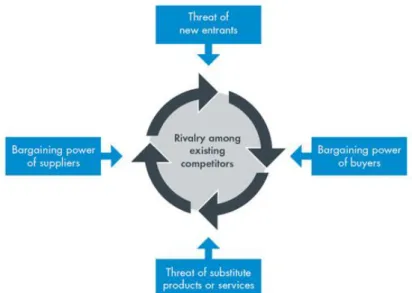
One of the most used exercises in market analysis, whether to open a new business or to define a new strategy, is Porter’s Five Forces analysis that aims to evaluate the attractiveness of each specific segment, diagnose where the main competitive pressures are from and assess how strong and important each of them is. Figure 7 evidences that the five forces of this model are the supplier power, the buyer power, the competitive rivalry, the threat of substitution and the threat of a new entry (Porter, M., 1979).
Figure 7: Porter’s five forces model (Porter, M., 1979).
Strategic analysis:
A company's strategic analysis clarifies what a company's goals, mission, and vision are, and helps the organization to make more assertive decisions, study and understand the scenario, understand its market position, and indicate how positioning and performance of the company should be.
Through Strengths, Weakness, Opportunities, and Threats (SWOT) analysis, a diagnosis is made about the company and the market where it is inserted. Created in the matrix to facilitate its elaboration, the SWOT analysis is simple and practical and measures the strengths, weaknesses, opportunities, and threats (external or internal) allowing to adopt an appropriate strategy (Pires, 2017).
Marketing plan:
The marketing plan defines how to sell the product/service that the company produces or sells. Thus, the following policies are presented (Pires, 2017):
• Product/service: a clear definition of the product/service that produces and/or sells; • Price: definition of price and sale conditions;
• Distribution: definition of the distribution/sale channel;
• Communication: definition of the product/service dissemination way to the market.
Technical study
The organizational and Human Resources (HR) plan is the presentation of the organizational structure and planning of the HR which consists in (Pires, 2017):
• Specifying jobs, necessary tasks, and necessary skills; • The workers' remuneration and benefits;
• The HR policy (recruiting, selecting and hiring staff) and staff training program. The production/operations plan consider several criteria in the (Pires, 2017):
• The decision of the location of the company (facility’s needs);
• Definition of how the manufacture of products or the provision of services is performed; • Explanation of each of the stages of the production/service process;
• Choice of machinery, equipment, raw materials, subsidiary materials and technology to adopt;
• Schedules the project, the activities and the seasonality of the activities. Economic-financial feasibility study
The economic-financial plan of a company begins with an investment plan, where it is necessary to define (Pires, 2017):
• Incorporated fixed capital: such as studies and projects, constitution expenses, patents, trademarks and licenses and training of personnel;
• Fixed tangible capital: such as land, buildings and facilities, machinery and equipment, cargo and transport materials, social and safety equipment.
This represents assets of a company, i.e. equity or net worth and non-equity or liabilities, which are the resources needed for a company to start and develop its activity. To finance its activity, a financial plan is drawn up which describes the financial resources needed by the company. The sensitivity analysis consists of the construction of alternative scenarios, based on critical variables of the project, namely the sale price, the quantity of supply, changes in cost structure, changes in interest rates, inflation rate, among others (Pires, 2017).
2.7
Conclusion
Through the state of the art, we can see that the reality of mobility in Portugal is very different between regions. We have seen that on the coast the transport networks are more developed than in the interior of the country, making the interior regions of difficult and time-consuming access. In addition, in large cities, it is very common to have road congestion because of the high use of personal/private transport.
The use of small aircraft and/or VTOL aircraft will contribute to increased mobility and flexibility in Portugal. As we can verify there is no air transport network in Portugal that is able to meet the needs of companies located in peripheral and central regions.
In order to elaborate a model and business plan for the creation of a fictitious company with an air transport system through VTOL aircraft, it was important to make the state of art of these two concepts.
Chapter 3- Methodology
3.1
Introduction
Operational research translates the study and development of optimization models that support decision making. Within the extended universe of optimization models, there is a specific group of management models, called mathematical programming models, that allow determining under what conditions a given objective can be maximized or minimized given the existence of a set of limitations (Hill, M. M., and dos Santos, M. M., 2015).
The models of mathematical programming, in turn, include the linear programming models, these models are deterministic, that is, they translate a clear and unique reality, leaving no room for approximations, estimates, expected values or probabilities of occurrence (Hill, M. M., and dos Santos, M. M., 2015).
In many situations of our professional activity, whether business or not, we are faced with the need to achieve well-defined goals. However, these objectives are generally conditioned by certain limitations, in particular, the availability of the resources available to us for use. These types of situations are classic problems of linear programming. Its resolutions involve the development of an adequate process, which allows finding the maximum profit solution, according to the preferences of the manager or the shareholder of the company (Hill, M. M., and dos Santos, M. M., 2015).
3.2
Traveling salesman problem
The Traveling Salesman Problem (TSP) is the name that usually occurs to a series of real problems that can be modeled in terms of Hamiltonian cycles in complete graphs. The TSP considers a set of cities - in one of which the salesman leaves (city-based or depot). He must visit all the cities or a subset of them, and the goal is to optimize one or more objectives (distance traveled or the associated costs). TSP is defined in directed and non-directed graphs (Arenales, M. et al, 2007).
The different heuristics procedures to solve the TSP are: • The Nearest Neighbor Rule (NNR);
• The cheapest cost insertion rule; • The Lin’s r-optimal heuristic; • Christofide’s Heuristic.
Before formulating the TSP, let's begin by introducing some basic concepts of combinatorial optimization (Arenales, M. et al, 2007).
Definition 1.1
A graph G = (V, A) is a system formed by sets V and A, where V = {v1, ..., vn} is the set of n vertices/nodes of the graph and A = {a1, ..., ap} ⊂ V × V the set of edges/arcs of the graph. When A is a set of ordered pairs, the graph is said to be oriented. If none of the elements of A is an ordered pair, the graph is said to be non-oriented.
Definition 1.2
The degree of a vertex v ∈ V, deg (v), is given by the number of edges in G connected to it. When the graph is oriented, it is called the degree of input, indeg (v), and degree of output, outdeg (v) the number of arcs entering and leaving v, respectively.
Definition 1.3
A path between two vertices vi, vj ∈ V, is a sequence of vertices and arcs < u1, (u1, u2), u2, ..., uk > checking:
(i) ui ∈ V, i ∈ {1, ..., k},
(ii) (ui, ui+1) ∈ A, i ∈ {1, ..., k − 1}, (iii) u1 = vi e uk = vj.
Definition 1.4
We call the path to a path in which no vertex (and hence no arc) is traversed more than once except possibly the initial and terminal vertex that may coincide, that is if ui = uj so i = j or i = 1 and j = k. In this case, where u1 = uk, we have a cycle.
Definition 1.5
We call the Hamiltonian cycle a cycle that contains all the vertices of the graph, that is, a path of length |V| that passes through each and every vertex once.
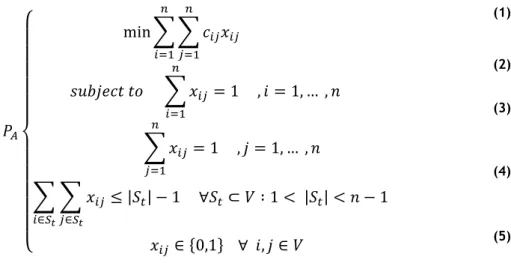
Formulation
{
x
ij=1 , if the arc (i,j) is the optimal TSP tour (Hamiltonian Circuit)
x
ij=0 ,otherwise
Considering the distance (or cost) associated with the arc from city i to city j, the total cost of the route is given by ∑ ∑𝑛𝑗=1𝑐𝑖𝑗𝑥𝑖𝑗
𝑛 𝑖=1