__________________________________________________________________________________________ “NOTICE: this is the author’s version of a work that was accepted for publication in BioChip Journal. Changes resulting from the publishing process, such as peer review, editing, corrections, structural formatting, and other quality control mechanisms may not be reflected in this document. Changes may have been made to this work since it was submitted for publication. A definitive version will be subsequently published in BioChip Journal, [DOI:10.1007/s13206-016-0102-2)].”
_______________________________________________________________________________________
In vitro Blood Flow and Cell-Free Layer in Hyperbolic
Microchannels: Visualizations and Measurements
Raquel O. Rodrigues1,2, Raquel Lopes1, Diana Pinho1,3, Ana I. Pereira1,4, Valdemar Garcia1, Stefan Gassmann5, Patrícia C. Sousa3, Rui Lima1,3,6*
1 LCM- Laboratory of Catalysis and Materials – Associate Laboratory LSRE-LCM, Faculdade de Engenharia da Universidade do Porto (FEUP), R. Dr. Roberto Frias, 4200-465 Porto, Portugal
2 Polytechnic Institute of Bragança, ESTiG/IPB, C. Sta. Apolónia, 5301-857 Bragança, Portugal
3 CEFT, Faculdade de Engenharia da Universidade do Porto (FEUP), R. Dr. Roberto Frias, 4200-465 Porto, Portugal
4 Algoritmi R&D Centre, University of Minho, Campus de Gualtar, 4710-057 Braga, Portugal
5 Jade University of Applied Science, 26389 Wilhelmshaven, Germany
6 Mechanical Engineering Department, University of Minho, Campus de Azurém, 4800-058 Guimarães, Portugal
* Correspondence and requests for materials should be addressed to Rui Lima ([email protected])
Abstract Red blood cells (RBCs) in microchannels has tendency to undergo axial migration due to the parabolic velocity profile, which results in a high shear stress around wall that forces the RBC to move towards the center induced by the tank treading motion of the RBC membrane. As a result there is a formation of a cell free layer (CFL) with extremely low concentration of cells. Based on this phenom-enon, several works have proposed microfluidic designs to separate the suspending physiological fluid from whole in vitro blood. This study aims to characterize the CFL in hyperbolic-shaped microchan-nels to separate RBCs from plasma. For this purpose, we have investigated the effect of hyperbolic contractions on the CFL by using not only different Hencky strains but also varying the series of con-tractions. The results show that the hyperbolic contractions with a Hencky strain of 3 and higher, sub-stantially increase the CFL downstream of the contraction region in contrast with the microchannels with a Hencky strain of 2, where the effect is insignificant. Although, the highest CFLs thickness oc-cur at microchannels with a Hencky strain of 3.6 and 4.2 the experiments have also shown that cells blockage are more likely to occur at this kind of microchannels. Hence, the most appropriate hyperbol-ic-shaped microchannels to separate RBCs from plasma is the one with a Hencky strain of 3.
Keywords: Blood, Cell-free layer, Hyperbolic microchannels, Hencky strain, Microcirculation, Microfluidic systems, Red blood cells
Introduction
Red blood cells (RBCs) are the most abundant kind of cells that flows within the human circulatory system. Additionally they are responsible for the supply of oxygen and nutrients to the body and removal of carbon dioxide and metabolic wastes from tissues. In microcirculation, blood flow behaviour depends on several combined effects such as cell deformability, flow shear rates and geometry of the microvessel [1, 2].
scavenging effects (push NO from tissue to RBCs) by RBCs and it may lead to heterogeneous distribution of blood cells in microvascular networks [3-5]. It is of great importance to understand the behaviour of the CFL in microcirculation as it contributes to the rheological properties of blood flowing in microvessels. In this context, Yaginuma et al. (2013) [11] demonstrated that microfluidic devices, composed of a hyperbolic contraction followed by an abrupt expansion, are able to perform separation of RBCs from plasma. Hence, the main objective of this work is to perform a more detailed investigation on the effect of the extensional flow field in the formation of the CFL in microfluidic devices. This investigation will bring new insights for the development of microfluidic devices for medical purposes, as for instance separating blood cells from whole blood, including the separation of healthy and infected cells in blood. Additionally, in vitro experiments are useful not only to gain further insights into the mechanisms related with CFL formation but also as a valuable tool to develop and validate multiscale vascular computational models.
The progresses in microfabrication, visualization and image analysis techniques made it possible to develop microfluidic devices able to precisely measure and manipulate the flow of blood cells through microchannels. The advantage of the microfluidic systems to test a large number of cells using a small volume of blood has promoted a large amount of research in the field of biomicrofluidics [1, 2, 6, 7]. Furthermore, lab-on-a-chip technology combines portability, integration and automation in a single chip, and is thus a promising platform for point-of-care devices, which may be particularly useful for detection and diagnosis of circulatory disorders.
The flow of blood in physiological conditions typically involves large deformation rates. Therefore, valuable information can be obtained from the characterization of blood under conditions of extensional flow, since these can be encountered in the human body and medical devices when the fluid flows from a wide to a narrow region of the microchannel. Some examples are the flow in microstenosis, flow in microvascular networks composed of bifurcations or small irregular vessel segments and in flow through syringe needles. Nevertheless, despite the recognized relevance of this nonlinear canonical flow in hemodynamics, the vast majority of blood flow measurements were performed under shear flow conditions whereas those under extensional flow conditions are scarce.
Recently, Lee et al. (2009) [8], Faustino et al. (2009, 2010) [9, 10], Yaginuma et al. (2013) [11] and Sousa et al. (2011) [12] studied the effect of the extensional flow in a hyperbolic converging microchannel using animal blood, human blood and blood analogue fluids, respectively. The importance to study these types of geometries is mainly due to their ability to impose a constant strain rate along the centreline [13, 14] and consequently generate strong extensional flows. The flow behaviour under extensional flow is known to be different from that under shear flow conditions. Sousa et al. (2011) [12] investigated the flow behaviour of two viscoelastic fluids, known as blood analogue fluids, and concluded that despite their similar shear rheology, the behaviour under a strong extensional flow is different due to differences in the elastic components of both solutions. Recently, Brust et al. (2013) [15] also found that blood plasma revealed a different rheological behaviour when experiencing a shear or an extensional flow. Although a Newtonian behaviour was observed in shear flow, a viscoelastic behaviour was found in pure extensional flow with the relaxation time of plasma being measured in uniaxial extensional flow using a capillary break-up extensional rheometer, with reported values of a few milliseconds.
Materials and Methods
Working fluids and microchannel geometry
The fluid used in this study was the dextran 40 (Dx40) containing about 5 % of haematocrit (i.e. Hct = 5%) by volume of RBCs. The samples of blood were collected from an ovine and K-EDTA was added in order to prevent coagulation. The RBCs were washed twice with a physiological saline (PS) solution and diluted with Dx40 to make up the required RBC concentration. All blood samples were stored hermetically at 4 ºC, until the experiments have been performed at room temperature.
The microchannels evaluated in this work were fabricated using a soft-lithography technique [17] which consist of hyperbolic-shaped microchannels with four different (2, 3, 3.6 and 4.2) and varying the number of series of hyperbolic contractions (1, 10 and 20). More detail about the microchannels geometries and dimensions can be found in Table 1, Figure 1, 2 and 3.
Table 1. Hencky strain ( for the various microchannels tested.
Microchan nel Number
Hencky Strain ()
Number of Hyperbolics
A1 2 1
A2 2 10
A3 2 20
B1 3 1
B2 3 10
B3 3 20
C1 3.6 1
D1 4.2 1
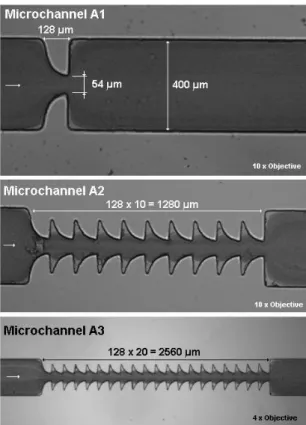
Figure 1 and 2 shows the main dimensions of the microchannels with a of 2 (A1, A2 and A3)
and of 3 (B1, B2 and B3), respectively.
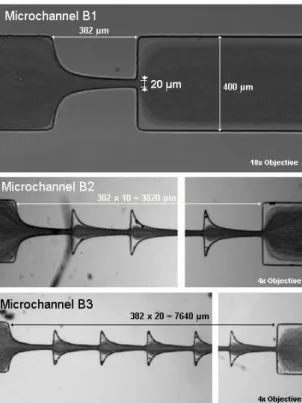
Figure 2. Main dimensions of the microchannels (B1, B2 and B3) and blood flow visualizations obtained by us-ing the Zproject plugin from ImageJ. The depth of the microchannels is 50 µm.
Figure 3 shows the main dimensions of a microfluidic device having a single hyperbolic contraction with a of 3.6 (C1) and 4.2 (D1).
Figure 3. Main dimensions of a microfluidic device having a hyperbolic contraction with a of 3.6 (C1) and 4.2 (D1) and blood flow visualizations. The depth of the device is 50 µm.
Experimental set-up
The high-speed video microscopy system used consists of an inverted microscope (IX71, Olympus, Japan) combined with a high-speed camera (FASTCAM SA3, Photron). All the microfluidic devices were placed on the stage of the inverted microscope. A syringe pump (Harvard Apparatus PHD
ULTRA) was used to produce a constant flow rate of about 10 L/min (Reynolds number about 0.2).
flowing through the hyperbolic-shaped microchannels can be found elsewhere [18.
Image Analysis
The image sequence were captured around the middle of the microchannels, at a rate of 3000 frames/s and a shutter of 1/7500, then all videos were transferred to the computer and evaluated in the ImageJ Software (NIH).
A manual tracking plugin (MTrackJ), of the image analysis software ImageJ was used to track individual RBC flowing around the boundary of the RBCs core. Moreover, the nearest wall position was measured so the distance between the tracked RBCs (more than ten cells) and the wall can be calculated. As a result, it is possible to obtain the CFL thickness. The procedure to track individual RBCs is presented and discussed in more detail elsewhere [7, 19].
Results and Discussion
In this section the results of the flow visualizations are presented and discussed, as well as the effect of hyperbolic-shaped microchannels on the CFL thickness, is evaluated.
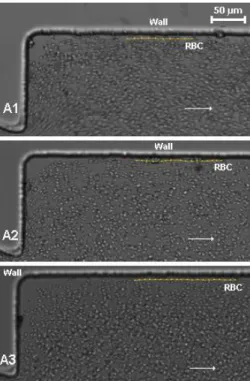
Figure 4 shows the tracking of a representative individual RBC flowing around the boundary of the RBCs core at hyperbolic microchannel with a H = 2 and with one (A1) ten (A2) and twenty (A3) series of hyperbolic contractions. The tracking was measured upstream of the hyperbolic contraction and it was investigated the effect of having only one (A1), ten (A2) and twenty (A3) elements containing this kind of hyperbolic contraction.
Figure 4. Trajectory of an individual RBC flowing around the CFL and upstream of a hyperbolic contraction with a H = 2 and with one (A1) ten (A2) and twenty (A3) series of hyperbolic contractions.
Figure 5 shows the tracking of an individual RBC flowing around the boundary of the RBCs core and downstream of a hyperbolic contraction with equal to 2 and with one (A1), ten (A2) and twenty (A3) series of hyperbolic contractions. These qualitative results show that this kind of hyperbolic microchannel does not enhance the CFL thickness at the downstream region. Additionally, the results indicate that by increasing the number of hyperbolic contractions, the CFL thickness is not
affected. In contrast, with microchannels having a hyperbolic contraction with a equal to 3, 3.6 and
Figure 5. RBC trajectory located around the CFL and downstream of a hyperbolic contraction with H of 2 and with one (A1), ten (A2) and twenty (A3) series of hyperbolic contractions.
Figure 6 shows a RBC trajectory flowing around the boundary of the RBCs core and downstream of a hyperbolic contraction with a of 3 and with one (B1) ten (B2) and twenty (B3) series of hyperbolic contractions. In this Figure it is possible to observe that the CFL thickness tend to increase with the increment of hyperbolic contractions. Although not shown here, the CFL thickness upstream
the contraction is close to the value observed for the microchannels with a equal to 2 (A1, A2 and
A3).
Figure 6. RBC trajectory flowing around the boundary of the RBCs core and downstream of a hyperbolic con-traction with a of 3 and with one (B1) ten (B2) and twenty (B3) series of hyperbolic concon-tractions.
To obtain a quantitative evaluation of the hyperbolic contractions effect, more than ten individual
4.2 (D1). The results shown in Figure 7 demonstrate that the has a strong effect on the CFL thickness as it is observed a significant increase of the CFL with increasing . Experiments with
different flow rates (5 and 15 L/min) were also performed. The results corroborate with past studies
[6, 11] were they found that flow rate has a weak effect on the downstream CFL. Additionally, Figure
4 shows that the highest CFLs thickness occur at microchannels with a of 3.6 and 4.2. However,
during our experiments we have found that microchannels having of 3.6 and 4.2, cells blockage and clogging are likely to occur at the contraction outlet. In contrast, such a problem did not happen at
the microchannels with a of 3. Hence, we believe that microchannels having hyperbolic contraction
with a = 3 are the most appropriate to separate RBCs from plasma.
Figure 7. CFL thickness upstream and downstream of the hyperbolic contraction with a Hencky strain of 2 (A1), 3 (B1), 3.6 (C1) and 4.2 (D1). Note that the results were obtained with a single hyperbolic contraction.
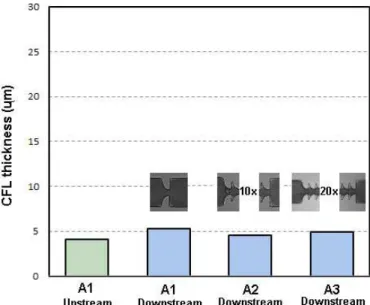
Figure 8 shows the CFL thickness upstream and downstream of the hyperbolic contraction with a
= 2 and with one (A1) ten (A2) and twenty (A3) series of contractions. These results show clearly
that this kind of hyperbolics contractions (Hencky strain 2) does not interfere in the CFL thickness. Additionally, the contraction increment does not enhance the CFL thickness.
Figure 8. CFL thickness upstream and downstream of the hyperbolic contraction with a Hencky strain of 2 and with one (A1) ten (A2) and twenty (A3) series of hyperbolic contractions.
promotes the increasing of the CFL thickness downstream of the contraction. In this microchannel, the higher value of the or total deformation experienced by the cells, indicates that the extensional flow is enhanced. On the other hand, it is important to note that the shear effects in the narrow part of
the microchannel with H = 3 can be more significant than in the microchannel with H = 2 16.
Moreover, it is also clear that the enhancement is more pronounced by increasing the number of the series of contractions. It is possible to observe an increase higher than twelve times in the CFL
thickness when comparing the results obtained with the microchannel A3 (H = 2) and B3 (H = 3).
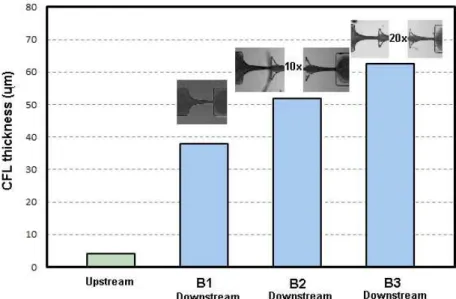
Figure 9. CFL thickness upstream and downstream of the hyperbolic contraction with aof 3 and with one (B1) ten (B2) and twenty (B3) series of hyperbolic contractions.
The present results corroborate the study performed by Yaginuma et al. (2013)[11], where by using a single hyperbolic contraction with a = 3, they have showed that for this particular hyperbolic contraction the downstream CFL enhanced by nearly ten times relatively to the CFL upstream of contraction region.
The present study shows for the first time that by increasing the number of series of hyperbolic
contractions (= 3) the downstream CFL thickness can increase up to sixty times relatively to the
CFL upstream of contraction region (cf. Figure 9). In contrast, with hyperbolic contractions with a
= 2, this phenomenon does not happen. A possible explanation for these results is that the CFL
tends to increase both with the strain rate and with the time that RBCs spend within the hyperbolic contraction. However, this study clearly indicates that the strain rate has a stronger effect as the tested
series of hyperbolic contractions with a = 2 had a weak effect on the thickness of the downstream
CFL. Further detailed investigations by studying hyperbolic microchannels with different need to
be conducted, in order to elucidate the true effect of hyperbolic contractions on the enhancement of the downstream CFL. In addition, experiments using microchannels with different depths can help in understanding the influence of the shear effects in the formation of the CFL downstream of the hyperbolic elements.
Conclusions
Four different hyperbolic microchannels, with Hencky strains of 2, 3, 3.6 and 4.2 were tested and compared. Additionally, series of hyperbolic contractions were investigated in order to elucidate its effect on the downstream CFL.
In general, the reported results show evidence that the hyperbolic contractions with a Hencky strains of 3, 3.6 and 4.2 have a strong impact on the CFL thickness. However, our experiments have shown that cells blockage and clogging are likely to occur at microfluidic devices having hyperbolic
contractions with a of 3.6 and 4.2. In contrast, such limitation did not happen at the microchannels
shown a strong effect on the thickness of the downstream CFL. Hence, these results demonstrate that, for clinical applications, the most appropriate hyperbolic microchannel to separate RBCs from plasma, is the one with a Hencky strain of 3.
Acknowledgment The authors acknowledge the financial support provided by PTDC/SAU-ENB/116929/2010 and EXPL/EMS-SIS/2215/2013 from FCT (Fundação para a Ciência e a Tecnologia), COMPETE, QREN and European Union (FEDER). R.O. Rodrigues, D. Pinho and P. C.
Sousa acknowledge the scholarships SFRH/BD/97658/2013, SFRH/BD/89077/2012 and
SFRH/BPD/75258/2010, respectively, all attributed by FCT.
References
[1] Lima, R., Ishikawa, T., Imai, Y. and Yamaguchi, T. in In Single and two-Phase Flows on Chemical and Biomedical Engineering, edited by Ricardo Dias, Antonio A. Martins, Rui Lima and T. M. Mata (Bentham science, 2012), pp. 513-547.
[2] Garcia, V., Dias, R. and Lima, R. in Applied Biological Engineering – Principles and Practice,
ed-ited by G. R. Naik (InTech, 2012), pp. 393-416.
[3] Fedosov, D. A., Caswell, B., Popel, A. S. and Karniadakis, G. E. Blood flow and cell-free layer in microvessels. Microcirculation (New York, N.Y.) 17 (8), 615-628 (2010).
[4] Kim, S., Ong, P. K., Yalcin, O., Intaglietta, M. and Johnson, P. C. The cell-free layer in microvas-cular blood flow. Biorheology 46 (3), 181-189 (2009).
[5] Namgung, B., Liang, L. and Kim, S. in Visualization and Simulation of Complex Flows in Bio-medical Engineering, edited by R. Lima, Y. Imai, T. Ishikawa and M. S. N. Oliveira (Springer Nether-lands, 2014), Vol. 12, pp. 75-87.
[6] Abkarian, M., et al. Cellular-scale hydrodynamics. Biomed. Mater. 3 (3), 034011 (2008).
[7] Pinho, D., Yaginuma, T. and Lima, R. A microfluidic device for partial cell separation and de-formability assessment. BioChip J. 7 (4), 367-374 (2013).
[8] Lee, S. S., Yim, Y., Ahn, K. H. and Lee, S. J. Extensional flow-based assessment of red blood cell deformability using hyperbolic converging microchannel. Biomed Microdevices 11 (5), 1021-1027 (2009).
[9] Faustino, V., et al. Extensional flow-based microfluidic device: deformability assessment of red blood cells in contact with tumor cells. BioChip J. 8 (1), 42-47 (2014).
[10] Faustino, V., et al. in Visualization and Simulation of Complex Flows in Biomedical Engineering, edited by R. Lima, Y. Imai, T. Ishikawa and M. S. N. Oliveira (Springer Netherlands, 2014), Vol. 12, pp. 151-163.
[11] Yaginuma, T., Oliveira, M. S. N., Lima, R., Ishikawa, T. and Yamaguchi, T. Human red blood cell behavior under homogeneous extensional flow in a hyperbolic-shaped microchannel. Biomicroflu-idics 7 (5), 054110 (2013).
[12] Sousa, P. C., Pinho, F. T., Oliveira, M. S. and Alves, M. A. Extensional flow of blood analog so-lutions in microfluidic devices. Biomicrofluidics 5, 14108 (2011).
[13] James, D. F., Chandler, G. M. and Armour, S. J. Measurement of the extensional viscosity of M1
in a converging channel rheometer. J. Nonnewton. Fluid. Mech. 35 (2–3), 445-458 (1990).
[14] Oliveira, M. N., Alves, M., Pinho, F. and McKinley, G. Viscous flow through microfabricated hyperbolic contractions. Exp. Fluids 43 (2-3), 437-451 (2007).
[15] Brust, M., et al. Rheology of Human Blood Plasma: Viscoelastic Versus Newtonian Behavior. Phys. Rev. Lett. 110 (7), 078305 (2013).
[16] Sousa, P. C., Pinho, F. T., Oliveira, M. S. N. and Alves, M. A. Efficient microfluidic rectifiers for
[17] Lopes, A., The study of the effect of microcontractions in the separation of blood cells: soft li-thography and micromilling. Polytechnic Institute of Bragança (2014).
[18] Pinto E., Faustino V., Rodrigues R., Pinho D., Garcia V. , Miranda J., Lima R. A rapid and low-cost nonlithographic method to fabricate biomedical microdevices for blood flow analysis. Mi-cromachines 6, 121-135 (2015).