W O R K I N G P A P E R S E R I E S
N O . 3 0 3 / F E B R U A R Y 2 0 0 4
FISCAL POLICY
EVENTS AND
INTEREST RATE
SWAP SPREADS:
EVIDENCE
In 2004 all ECB publications will feature a motif taken from the €100 banknote.
W O R K I N G P A P E R S E R I E S
N O . 3 0 3 / F E B R U A R Y 2 0 0 4
FISCAL POLICY
EVENTS AND
INTEREST RATE
SWAP SPREADS:
EVIDENCE
FROM THE EU
1by António Afonso
2and Rolf Strauch
31 We are grateful to Manfred Kremer, José Marin, Stephan Monissen, Ludger Schuknecht, Jürgen von Hagen, an anonymous referee, participants at an internal ECB seminar, and at the Tor Vergata Conference on Banking and Finance for helpful comments, Gerhard Schwab and Anna Foden for able research assistance, Ioana Alexopoulou and Jorge Sicilia for helping us with data and
JP Morgan for making data on CDS rates available to us. All remaining mistakes are ours.The opinions expressed herein are those of the authors and do not necessarily reflect those of the author’s employers or of the ECB.
© European Central Bank, 2004
Address Kaiserstrasse 29
60311 Frankfurt am Main, Germany Postal address
Postfach 16 03 19
60066 Frankfurt am Main, Germany Telephone
+49 69 1344 0 Internet http://www.ecb.int Fax
+49 69 1344 6000 Telex 411 144 ecb d
All rights reserved.
Reproduction for educational and non-commercial purposes is permitted provided that the source is acknowledged.
The views expressed in this paper do not necessarily reflect those of the European Central Bank.
The statement of purpose for the ECB Working Paper Series is available from the ECB website, http://www.ecb.int.
C O N T E N T S
Abstract 4
Non-technical summary 5
1. Introduction 7
2. Fiscal policy events in 2002 8
2.1. A chronology of the year 9
2.2. Capital market’s view of
the Stability and Growth Pact 13
3. Measurement of default risk and stylised facts about yields and
swap spreads 15
3.1. Measuring default risk 15
3.2. Developments in 2002 18
3.3. Stylised facts for selected
fiscal policy events 22
4. Analytical framework 26
4.1. Model specification 28
4.2. Estimation results and
discussion 30
4.3. Testing anticipation and
persistence 35
4.4. Additional evidence from CDS 38
5. Conclusion 39
Appendices 41
References 44
Annex 45
European Central Bank
Abstract
In this paper we assess the importance given in capital markets to the credibility of the European fiscal framework. We evaluate to which extent relevant fiscal policy events taking place in the course of 2002 produced a reaction in the long-term bond segment of the capital markets. Firstly, we identify the fiscal policy events and qualitatively assess the views of capital market participants. Secondly, we estimate the impact of these fiscal events on the interest rate swap spreads, which is our measure for the risk premium. According to our results the reaction of swap spreads, where it turned out to be significant, has been mostly around five basis points or less.
JEL: C22; G15; H30
Non-technical summary
During 2002 the Stability and Growth Pact (SGP) was put to a test due to the
implementation of the surveillance process and the discussion about the framework
itself in the context of the economic slowdown endured by euro area economies. The
fiscal policy events that occurred in 2002 challenged the credibility of the European
fiscal framework. Therefore, they present a first opportunity to assess how capital
markets react when the SGP is put under stress and that is the purpose of this paper.
We assess some stylised facts on long-term interest rates, using weekly and daily data.
Then we explore how these events were interpreted in capital markets by reviewing
weekly notes and newsletters of four major investment banks for 2002, and we
provide a chronology of major fiscal policy events throughout the year. The fiscal
policy events are classified either as country specific actions and decisions related to
the implementation of the surveillance procedures (“type 1” fiscal events), or as
announcements of policy targets and discussions on the European institutional
framework (“type 2” fiscal events). The relation of some of these selected fiscal
events with long-term government yields, the implied break-even inflation rate, and
interest rate swap spreads is then discussed.
In the second part of the paper we estimate reaction of interest rate swap spreads for
the European Union countries to fiscal policy events using a SUR approach. Interest
rate swap spreads are defined as the difference between the interest rate of the fixed
leg of the 10-year interest rate swap and the 10-year government bond yield. The
Our results indicate only a significant reaction of interest rate swap spreads to some
policy events. Among others, the rumours of the early warning for Portugal and
Germany on 17 January led to a decrease of the swap spread for Portugal, pointing to
increasing concerns about fiscal developments. In contrast, when the Council declared
that Portugal has an excessive deficit on 5 November, swap spreads increased both for
Portugal and Germany indicating a possible positive confidence effect. Furthermore,
the change in swap spreads, when significant, has been mostly five basis points or
less, and not exceeding ten basis points according to our estimates. Using moving
window regressions around policy events, we cannot detect any persistence of the
market reaction in terms of a continuous upward or downward shift of the swap
spread after a fiscal policy event, but our estimates suggest an anticipation effect in
two instances.
The main message of our paper is therefore the lack of a strong reaction of the default
risk premium in long-term government interest rates to the identified fiscal policy
events in 2002, even if some specific events had a temporary and limited impact on
1. Introduction
The process of European integration that culminated in the European Monetary Union
was based on the belief that fiscal discipline is necessary for a functioning monetary
union. Since the monetary union would allow members to free-ride on the common
monetary policy by running excessive deficits and increasing debt ratios, a European
fiscal policy framework was adopted setting deficit and debt limits for EU member
states and installing an elaborated surveillance procedure.
The main thrust of the European fiscal framework, coupled with no bailout and no
monetary financing clauses, is to ensure the sustainability of public finances since
high or rapidly increasing debt levels in one Member State could have several
externalities on others. Due to the monetary union, government securities would be
more perfect substitutes and large supply of government securities could raise the
costs of borrowing for other governments. Moreover, unsustainable public finances
could raise pressure on the central bank to monetize these liabilities. Finally, high
debt levels in the extreme could lead to default – partially or fully, either on interest
payments or on the principal – with repercussions in the banking sector. The ECB
could be forced to step in and similarly monetize government debt if this would spark
a financial crisis.
The different implications of high government debt and unsustainable public finances
should be reflected in prices for government securities. The existence and
implementation of the European fiscal framework should therefore have a twofold
effect. First, the credibility of the European fiscal framework and its ability to deter
“excessive” deficits and debt in the perception of market participants generally affect
future risks associated with liabilities of all member states. Second, the surveillance
process could reveal information to market participants when valuing individual
government liabilities. Either due to the perception of the credibility of the framework
or the information content of the surveillance procedure, these budgetary institutions
should affect the risk component included in government bond yields.
In 2002, the Stability and Growth Pact (SGP) was put to a test due to the
itself in the context of the economic slowdown. The fiscal events that occurred in
2002 challenged the credibility of the European fiscal framework. They present
therefore a first opportunity to assess how capital markets react when the SGP is put
under stress. We address this issue by analysing whether the long-term bond segment
reacts to the worsening of fiscal positions in some countries and/or to the criticisms
made to the SGP fiscal rules.
As a starting point, we look at publications from investment banks and at the
development of interest rate swap spreads around key fiscal policy events. The euro
interest rate swap spread seems to be a good indicator of the relative risk of private
versus government long-term bonds versus the private inter-bank market. The main
result of our review of investment bank newsletters and notes is that market
participants closely observe and contribute to the debate on the SGP and its
implementation. But they do not share a unanimous view on specific aspects of
institutional credibility and the optimal implementation. Correspondingly, we only
find a significant reaction in the interest rate swap spread to a few policy events. In
those cases, the reaction was sizeable and interestingly pointed into different
directions. The results suggest that the overall debate on the Pact in Autumn has
actually created some uncertainty about its future, and that any action against member
states was eventually assessed as “a credibility yielding event”, rather than
information revealing higher country risks. We do not find any persistent impact of
policy events on the level of spreads.
The remainder of the paper is organised as follows. Section 2 selects and discusses the
relevant fiscal policy events of 2002. Section 3 addresses the measurement of default
risk and examines the stylised facts of some of the proposed fiscal events. Section 4
presents the parametric analysis and discusses the several results. Section 5 concludes
the paper.
2. Fiscal policy events in 2002
In 2002 the SGP was put to a test. Due to the economic slowdown and lack of fiscal
close to or even breached the 3% deficit to GDP limit for excessive deficits set in the
Maastricht Treaty. Thus two developments, closely intertwined, prevailed during the
year 2002. First, the procedures specified in the SGP and in the Maastricht Treaty
became relevant and had to be implemented for the first time for Portugal and for
Germany. Secondly, as governments felt the restraint from the SGP and as the
implementation process proceeded, a debate emerged on the implementation of the
Pact and the criteria defined therein. The public debate and the implementation of the
surveillance procedures are marked by certain key events, which should have figured
into the public perception of the credibility of the Pact or revealed some information
on the state of public finances in member states.
2.1. A chronology of the year
The developments in 2002 started with the Commission’s recommendation for an
early warning when it became apparent that Germany and Portugal would deviate
significantly from the envisaged consolidation paths and would be close to the 3% of
GDP limit for the deficit. When the Commission launched its annual review of public
finances in Member States, rumours spread out on 17 January that it was considering
an early warning to Germany and Portugal. This early warning was then
recommended officially by the European Commission on Wednesday 30 January, as
expected since Commissioner Solbes had clearly indicated his intention to launch the
procedure beforehand.
After the Commission launched the initiative, a debate emerged of whether the early
warning should be issued. Eventually, European governments abstained from an early
warning. Eventually the ECOFIN Council decided on 12 February to close formally
the procedure without issuing any early warning since Germany and Portugal renewed
their firm commitment to their consolidation plans and medium-term targets. This
gave rise to a more general discussion on the credibility of the Pact.
Over the course of the summer, various setbacks took place concerning the attainment
of a close to balance position in several countries. France and Italy revealed budget
plans indicating that they planned to deviate from their previously announced
campaign. This initiative became part of the official policy line when the centre-right
interim government indeed won the general elections on 16 June.
The French position was partly accommodated in the ECOFIN meeting on 20 June,
by making the attainment of a close-to-balance position for France contingent on
highly optimistic growth rates, i.e. it implicitly allowed the deadline for the
achievement of the medium-term position to be missed. Italy took this outcome as a
common understanding in the Council that allowed for a focus on growth and more
flexibility in the fiscal framework. The government started then openly to discuss tax
reductions, which would delay the attainment of the close to balance or in surplus
position. These proposals were eventually included in the Documento di
Programmazione Economica e Finanziaria, which was released on 8 July.3
Moreover in the summer, after the change in government following general elections
in Portugal, it became clear that the actual Portuguese budgetary balance for 2001
drastically surpassed the value declared previously. The Portuguese Prime Minister
revealed, first in a speech in Parliament on 26 June, that a report from the ECB
indicates a deficit of 3.9% of GDP for 2001. The Portuguese government then
submitted the official figure of 4.1% of GDP to the European Commission on 26 July,
although it was already known in the press a few days before. As a consequence, the
Commission declared its intention to write a report in order to launch the excessive
deficit procedure (EDP) on 26 July. On 16 October the Commission then formally
adopted an EDP against Portugal, and the country was indeed declared to be in
excessive deficit by the ECOFIN Council on 5 November.
As the expected economic recovery did not materialise in the second half of the year,
and economic prospects deteriorated, the attainment of a close to balance or in surplus
position by 2004 became unrealistic for countries with large remaining imbalances.
Therefore, on 24 September the Commission announced a new strategy for budgetary
consolidation, which would give countries time to balance their budgets by 2006.
France seized on this more flexible approach and declared that it would not achieve a
balanced budget by 2004. Later on (on 30 September) Budget Minister Alain Lambert
revealed that the budget would be brought into balance by 2007 rather than 2006. In
an Eurogroup meeting on 8 October all euro area ministers of finance backed the
Commission approach, with the exception of France which did not commit to start
consolidation immediately.
The relative peace following the common position among government officials and
representatives of EU institutions was suddenly put into question on 17 October. At
that date the President of the European Commission Romano Prodi declared that
excessively strict rules are not sensible and the rigid implementation of the Pact is
“stupid,” as all rigid decisions. Shortly thereafter on 24 October, the ECB Council
reacting to the debate sparked by Prodi's remark issued a statement expressing its firm
support for the existing European fiscal framework since it felt that the debate could
be damaging the credibility of the Pact in the public.
By the time, when the EU Commission updated its autumn forecasts and the “new”
strategy was discussed, it became also apparent that several member states would
incur in deficits close to or even above the 3% of GDP limit in 2002 and in 2003.
Therefore the Commission openly started to consider whether to issue an early
warning against France and an excessive deficit procedure against Germany. The
issue of an early warning to France was discussed first on 9 October immediately after
the Eurogroup meeting.
On 13 November the Commission released its autumn forecasts, significantly revising
downward the budgetary prospects for several member states. According to these
forecasts Germany would clearly breach the 3% of GDP limit for the deficit and the
Commission announced that it would launch an excessive deficit procedure and
would write a report on Germany. Both, the early warning to France and the excessive
deficit procedure for Germany were discussed in the Economic and Financial
Committee in January 2003 and were adopted by the ECOFIN Council in the same
month.
On 27 November the Commission released a public communication taking stock of
Table 1. Chronology of fiscal policy events in 2002
17 Jan Rumours of early warning for Portugal and Germany
30 Jan Recommendation of early warning by the EC to Portugal and
Germany
12 Feb ECOFIN does not launch the procedure against Portugal and
Germany
20 Jun ECOFIN accommodates France deviation from consolidations plans
by making achievement of target conditional on growth rates
26 Jun Portuguese Prime Minister reveals deficit for 2001 was above 3%
limit
8 Jul Italy proposes tax reductions that will delay close to balance
position
Empha
si
s on co
unt
ry s
p
ec
ifi
c
surve
il
lan
ce
26 Jul Portuguese government officially reports to the EC a deficit of 4.1%
in 2001
24 Sep EC announces new strategy on balanced budgets
30 Sep France announces balanced position only for 2007
8 Oct Eurogroup: all countries commit to start consolidation immediately,
except France
9 Oct Eurogroup: early warning for France is discussed
16 Oct EC adopts an EDP against Portugal
Discus
sio
n
on
the SGP
17 Oct President of the EC declares that a rigid implementation of the SGP
is “stupid”
24 Oct ECB press statement in favour of the SGP
5 Nov Council declares that Portugal has an excessive deficit
13 Nov EC adopts an EDP against Germany
Stren
g
th
eni
ng of
the
cred
ibi
lity o
f
the
SGP
27 Nov Commission issues a Communication addressing some of the
criticisms and implementation problems of the SGP
disappointment about the current situation and trying to accommodate some of the
criticism expressed by government officials against the Pact. The declared objective
was to re-invigorate the Pact by making its implementation somewhat more flexible
under well-defined circumstances while strengthening the surveillance process.
A summary overview of the events described above is also given in Table 1 and this
additionally helps to identify three different periods in 2002. In the first half of the
year, the surveillance procedure concentrated on Portugal and Germany, but there was
relatively little discussion on the SGP as such. Later on in the summer, the challenge
the comments of the President of the EC on 17 October. In the autumn and winter,
following the ECB’s press statement on 24 October and the EC declaration in
November, there was a certain strengthening of the SGP.
2.2. Capital market’s view of the Stability and Growth Pact
Before moving on to the summary analysis of the stylised facts, it is useful to look at
the discussion on the European fiscal framework and the events taking place in 2002
through the lenses of capital markets. This is done in this sub-section in order to
identify some working hypotheses on the reaction of capital markets to the discussion
on the Stability and Growth Pact. Therefore we screened the weekly notes and
newsletters of four major investment banks for 2002.4
First, all policy events mentioned above were reported and discussed in some of the
regular newsletters. The more important events, such as the early warning and the
developments taking place in autumn 2002, were actually discussed in all newsletters
and notes. Secondly, when looking at the material, it becomes apparent that there
seems to be consensus on the need for a Pact as an institutional framework. None of
the investment banks advocated abolishing the Pact altogether and leaving public
finances in member states without any overall guidance or control. However, beyond
that point, support for the specific regulations of the Pact and the decisions taken by
the Council varies considerably.
The main reason for diverging assessments of the virtues of the Stability and Growth
Pact is the position investment banks take with respect to the trade-off between
credibility and short-term growth, that became particularly important in the second
half of 2002. All investment banks saw that the need to keep the budgetary deficit
below the 3% of GDP limit could force governments to take pro-cyclical policy
measures. Even those acknowledging the need for fiscal restraint to reinforce the
credibility of the European fiscal framework, always pointed to the concomitant
reduction of short-term growth prospects during the current downturn.
4
Eventually investment banks developed a clear policy line in their newsletters, and
some proposed changes to the Pact along these lines. For example, Morgan Stanley’s
(07/11/02) views were in line with the ECB, arguing that the Pact is not
fundamentally flawed, but a valuable compromise, which should be kept as a
framework for fiscal policies in EMU. Countries not complying with the Pact should
not try to change the rules since it is their responsibility that they have not done
enough to consolidate their public finances in good times. Similarly, Credit Suisse
First Boston argued that changing the Pact would seriously damage its credibility.5 By
comparison, Goldman Sachs took a much more critical position. It argued that neither
the Commission had indicated sufficient willingness to reform the alleged restrictive
bias in the Stability and Growth Pact, nor had the ECB signalled its support for such
an initiative. According to Goldman Sachs' own view, the Treaty and the Pact needed
to be implemented more flexibly by giving more weight to the medium-term position
required by each country to stabilise the debt level, and by understanding the 3% to
GDP limit in cyclically adjusted terms.6
Given these diverse viewpoints, understandably, the assessment of individual events
was also different among investment banks. One bank considered the struggle about
the early warning to Germany and Portugal in February, and the Council’s decision
not to issue such a warning was considered a lost opportunity to enforce the Stability
and Growth Pact as the existing procedure of fiscal co-ordination among European
countries.7 Conversely another bank argued “no warning, no problem,” since the two
countries confirmed their commitment to their fiscal target.8 The embarrassment of
the “sinners” resulting from the public debate of the issue had been an effective
mechanism to enforce commitment to the European fiscal framework in this instance.
This position is fully in line with the Commission and the ECB statements on the
event at the time.
5
Credit Suisse First Boston, 22/09/02. 6
See above all Europe's Stability Pact: “In Need for New Clothes,” Global Economics Paper 81, 30/08/02.
7
Credit Suisse First Boston, 15/02/02. 8
Similarly, when the Commission gave its revised recommendation for an appropriate
fiscal strategy in autumn 2002, deviating from the original dates for achieving a safe
budgetary position was conceived by CSFB as bending the Pact, although not
breaking it.9 In contrast, Goldman and Sachs welcomed the change of the proposed
Commission strategy as a more realistic target, but it was refuted as still being too
restrictive.10
Towards the end of the year, investment banks mostly saw the rules of the Stability
and Growth Pact as being invigorated. The first reason for this was the declaration of
an excessive deficit for Portugal, and more importantly, the initiation of such a
procedure against Germany, which seemed to be also willing to accept a Council
decision to declare an excessive deficit for Germany.11 Second, the Commission
Communication was considered as an attempt to re-interpret the Pact rather than
changing the rules.12 One bank saw this as recovering the ground that was lost in the
preceding debate and it was expected that the Council would follow the Commission
proposal, eventually strengthening the Stability and Growth Pact.13
3. Measurement of default risk and stylised facts about yields and swap spreads
3.1. Measuring default risk
The main concern of this paper, which according to the review of investment bank
documents is shared by some market participants, is the credibility of the SGP. The
credibility of the Pact ultimately refers to its ability to prevent unsustainable fiscal
policies that could eventually lead to the risk of default, financial crisis and possible
central bank bailout.
It is important to distinguish two types of events in our sample: actions or decisions
related to the implementation of the surveillance procedures, “type 1” fiscal events;
and other announcements of policy targets and discussions on the European
institutional framework, “type 2” fiscal events.
9
Credit Suisse First Boston, 22/09/02. 10
Goldman Sachs, 14/10/02. 11
See for example Deutsche Bank 08/11/02, Credit Suisse First Boston, 25/10/02. 12
Credit Suisse First Boston, 28/11/02. 13
The first type of event is similar to a credit rating action, i.e. it relates to an individual
country. The informed public or other market participants are often able to anticipate
the decision or action taken. Thus, at the date of the decision or action hardly any new
information regarding the country itself may be revealed. After it has been taken,
however, it is assumed to have a more lasting impact on the pricing of bonds issued
by the agent. In contrast, the second type of events, such as the communication by the
Commission, may not have been known in advance since it is not part of a regular
procedure. The “surprise element” should therefore be larger for this type of events
compared to the first one. A second difference is that these political statements often
have the entire euro area or all EU member states as a reference point. This distinction
is somewhat blurred in 2002. Since several procedural steps were implemented for the
first time, and the implementation was accompanied by a strong discussion on the
usefulness of the rules in general. Therefore even the more regular and country
specific procedural events (“type 1”) where seen as test cases for the credibility of the
European fiscal framework in general.
The different views presented in the previous section suggest different aspects of how
the SGP could affect capital market expectations about future developments, and
hence prices for fixed government securities. If a strict interpretation of the SGP
reduces budgetary flexibility and short-term growth prospects, it might lead to lower
short or medium term interest rates. Conversely, if the central bank considers any
breach or lax implementation of the Pact as an indication of an unduly expansionary
fiscal policy leading to higher inflation, it could foreclose a monetary easing.
Institutional strictness could then be conducive to lower short or medium-term rates.
Finally, if the default risk premium prevails, this would lead to an overall increase of
the marketable yield for a government security. This risk would mainly affect the
long-term rates since such default is relatively unlikely in the short or medium-term
under current circumstances, as sovereign bond ratings indicate.
Looking at government bond yields as such does not allow identifying the existence
of a default risk premium since bond yields also reflect expectations about different
monetary policy reactions. There are various ways to control for this and capture
bonds issued by governments and international organisations, and interest rate swap
spreads, 14 are among the most common that can be found in the literature.15 The first
two measures carry among others the difficulty that the financial market instruments
do not exist for all countries or that they are comparatively illiquid. Changes in
spreads could then capture trading activity and market liquidity rather than a genuine
default risk. For these reasons, we will look primarily at interest rate swap spreads,
defined as the difference between the 10-year interest rate swap and the 10-year
benchmark government bond yield.16
The market for the 10-year benchmark bonds (or the closest available maturity) is the
most liquid segment for sovereign debt. The euro interest rate swap market, moreover,
is one of the largest and most liquid financial markets in the world.17 It was among the
first financial markets to become integrated following European monetary union, and
quickly gained benchmark status. An important characteristic of this market is the
robustness of liquidity, although liquidity might indeed evaporate in times of high
volatility.18
14
An interest rate swap is an agreement to exchange a flow of fixed interest payments in return for a variable rate of interest. Additionally, the swap spread is defined as the difference between the interest rate of the fixed leg of the 10-year interest rate swap and the 10-year government bond yield.
15
See section 4 for references. 16
Nevertheless, we try to get some aditional evidence from credit default swaps in section 4.4. 17
According to data from the BIS (2003), in terms of notional principal outstanding, over-the-counter markets for euro and US dollar denominated interest rate derivatives are the largest financial markets in the world. The euro interest rate swap market has actually roughly the same size as the dollar one: the notional stock of euro denominated interest rate swaps and forwards totalled WULOOLRQDWHQG-XQHWKHVWRFNRI86GROODUGHQRPLQDWHGFRQWUDFWVZDVVOLJKWO\ smaller, at WULOOLRQ )RU WKH HXUR GHQRPLQDWHG LQWHUHVW UDWH VZDSV WKH PDUNHW VHHPV WR EH particularly liquid in the short-term segment (see ECB (2001)).
18
3.2. Developments in 2002
In this section we look at data concerning 10-year government bond yields. Although
our main interest is the default risk, this presents only one channel through which
fiscal policies can affect long-term yields. There are other channels operating through
monetary-fiscal interaction, which should be reflected in the evolution of yields.
Therefore we start our descriptive analysis in this section by looking at yields,
forward rates and inflation expectations at a weekly frequency. Then we move to an
analysis of interest rate swap spreads, at a weekly and daily frequency.
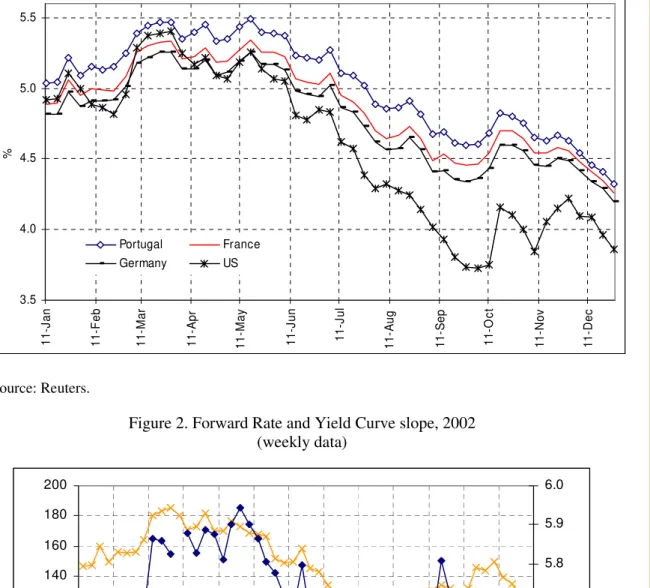
For the EU countries represented in Figure 1, the yields dropped from an interval of
4.9%-5.2% in the beginning of 2002 to around 4.2%-4.4% at the end of the year,
roughly a decrease between 72 and 82 basis points (bp). Comparing the development
of yields in the EU with the one recorded for the US, it is obvious that the decline in
the long-term interest rates was more significant in the US, around 132 bp. This
means that the positive yield differential between the US and the EU benchmark (we
take Germany here) of 18 bp at the beginning of the year shifted to a differential of –
36 bp at the end of the year.19
This development is also evident in the basic descriptive statistics reported in
Appendix 1 for the government bond yields in the EU15 countries and the US. We
also present the statistics for 10-year interest rate swaps and the corresponding swap
spreads vis-à-vis the government bond yields. It seems worthwhile to notice that the
respective yields for the countries more directly affected by fiscal policy events
reported in the previous section show only marginally different correlation levels
against the German benchmark than others. For France and Italy, the correlation
coefficient is 0.997 and 0.996 respectively, while the coefficient is around 0.991 for
Portugal.
19
Figure 1. Yields on 10-year government bonds for France, Germany, Portugal and the US, 2002 (weekly data)
3.5 4.0 4.5 5.0 5.5 11-J an 11 -F eb 11 -M ar 11 -A pr 11-M ay 11-J un 11-J ul 11-A ug 11 -Se p 11-O c t 11 -N o v 11 -D e c % Portugal France Germany US Source: Reuters.
Figure 2. Forward Rate and Yield Curve slope, 2002 (weekly data) 20 40 60 80 100 120 140 160 180 200 01 /1 1 02 /0 1 02 /2 2 03 /1 5 04 /0 5 04 /2 6 05 /1 7 06 /0 7 06 /2 8 07 /1 9 08 /0 9 08 /3 0 09 /2 0 10 /1 0 11 /0 1 11 /2 2 12 /1 3 bas is point s 5.3 5.4 5.5 5.6 5.7 5.8 5.9 6.0 (%)
Events Yield Curve slope (left hand scale) Forward Rate (rigth hand scale)
Notes: The yield curve is the 10-year German government benchmark yield minus the 3-month Euribor. The forward rate is the one year interest rate 9 years ahead (see Perez-Quiros and Sicilia (2002)).
To which extent this decrease in bond yields is associated with changes in short-term
or long-term rates becomes more evident when looking at the yield curve defined as
the 10-year government bond yield minus the three months Euribor shown in Figure
2. Over the entire year, the slope of the yield curve fell by roughly 20 bp to somewhat
less than 130 bp. The same trend is also illustrated by the implied one-year forward
rate in nine years, as extracted from the German zero-coupon curve.20 The rate falls
by 10 bp in the course of year, although there are sizeable developments over time. It
strongly increases in spring, shortly after the Council decision not to launch an early
warning, and then it remains fairly stable above 5.8%. Subsequently, it falls by
roughly 40 bp until September. After a renewed spike in mid-November, it decreases
to the end-year level. As the series of points in Figure 2 reveal, this development can
hardly be explained by the three phases of fiscal policy events.
A further issue is whether fiscal policy problems have lead to higher long-term
inflation expectations. The bold line in Figure 3, depicting long-term inflationary
expectations, as extracted from long-term index linked bond prices, indicates that this
was not the case. After an initial increase until May, break-even inflation decreased to
its initial level in October, and remained stable thereafter. This development is again
not clearly linked to fiscal policy events, although the initial implementation problems
may have contributed to the initial rise, and the renewed strengthening of the Pact in
November to the stability of inflation expectations. But the comparison with the
implied break-even inflation rate in the US and the UK reveals, the overall shape of
the curve is clearly related to expectations on long-term growth in the Europe and the
US.
Overall, changes in yields and implicit break-even inflation rates give little indication
that the worsening of the fiscal situation in the course of 2002 and the implementation
of the Pact have changed long-term expectations on inflation and monetary policy. In
Figure 4 we therefore look at the evolution of the long-term interest rate swap
spreads, as our preferred measure of default risk. The chart only depicts spreads for
20
Figure 3: Implied Break-even inflation for the Euro Area, France, UK and US in 2002 (weekly data) 0.5 1.0 1.5 2.0 2.5 3.0 01 /1 1 02 /0 1 02 /2 2 03 /1 5 04 /0 5 04 /2 6 05 /1 7 06 /0 7 06 /2 8 07 /1 9 08 /0 9 08 /3 0 09 /2 0 10 /1 0 11 /0 1 11 /2 2 12 /1 3 (% )
euro area Events France UK US
Note: Expectations from break-even inflation rate = 10-year nominal bond yields minus 10-year real bond yields. The real bond yields are derived from the market prices of inflation-indexed bonds. Source: French Treasury, ISMA and Reuters.
Figure 4. Long-term interest rate swap spreads, Portugal and Germany, 2002 (weekly data) -20 -10 0 10 20 30 40 04 /01 04 /02 04 /03 04 /04 04 /05 04 /06 04 /07 04 /08 04 /09 04 /10 04 /11 04 /12 S w ap s pr e ad ( bp )
Portugal Germany Events
Note: Interest rate swap spreads are defined as 10-year swap rates minus government bond years of the closest maturity.
Portugal and Germany, the countries mainly addressed in fiscal policy events. The
development is quite erratic and does not reveal any clear trend. If anything, swap
spreads tended to rise towards the end of the year for Portugal, while they started
falling for Germany.
3.3. Stylised facts for selected fiscal policy events
In the previous sub-section we have described the evolution of yields and interest rate
spreads in 2002 using weekly data. If the information revealed by policy events is
processed efficiently in capital markets, it may nevertheless be necessary to look at
higher frequencies to detect any impact of fiscal policy events.
In this section we therefore focus more carefully on specific events using daily data.
As an illustration, we select two periods for a closer look. Event 1 is the episode
leading to the ECOFIN decision to not issue an early warning against Portugal and
Germany on 12 February, and event 2 is the remark made by President Prodi on the
SGP followed by the press statement of the ECB in late October. While event 1 is
more related to the regular surveillance procedure, and therefore to individual
countries, event 2 was not part of any standard procedure and might be considered as
having a potential effect for the entire EU.
Event 1 – 12 February 2002 (early warning episode for Portugal and Germany)
Visual inspection reveals that around the time of the EC recommendation of the early
warning to Portugal and Germany (rumours on 17 January, recommendation on 30
January), there was an increase in Portuguese 10-year government bond yields. The
cumulative increase in the Portuguese 10-year government bond yields reached 23 bp
to decline thereafter to 10 bp in the beginning of February. This movement of the
long-term yields implied a decline of the swap spread became negative in some days
of the period between 17 January and 30 January (see Figure 5). A similar
development can be tracked after the announcement of 30 January. The cumulative
change in the yield reached a peak again on 13 February, while the swap spread
These daily movements in the Portuguese long-term interest rates could reflect a risk
premium. The EC recommendation clearly signalled to markets that Portuguese
public finances were facing difficulties. Therefore, markets might have attributed
additional risk to the government debt, demanding a higher interest rate to hold the
long-term bonds. At the same time, the risk of private bonds might have decreased
relatively to government bonds, since this EC recommendation was not seen as
directly damaging this segment of the market. All in all, these movements pushed
down, even if temporarily, the swap spreads.
This development of the Portuguese long-term bond segment went in parallel with the
evolution of the yields in the benchmark segment, the German 10-year bond market,
and the corresponding swap spreads (see Figure 6). Indeed, swap spreads for
Germany also decreased after the rumours of the early warning for this country.
The changes in the interest rate swap for the German 10-year bonds attained a
cumulative peak around 24/5 January, with the swap spread staying at a low of 10 bp
on 25 January.
Figure 5. 10-year interest rates and swap spreads for Portugal (2002: 16 Jan – 18 Feb)
4.9 4.9 5.0 5.0 5.1 5.1 5.2 5.2 5.3 5.3 16- Jan-02 18- Jan-02 22- Jan-02 24- Jan-02 28- Jan-02 30- Jan-02 01- Feb-02 05- Feb-02 07- Feb-02 11- Feb-02 13- Feb-02 15- Feb-02 Y iel d, sw aps (% ) -20 -15 -10 -5 0 5 10 15 S w ap spr ead (bp)
Furthermore, the changes in the yields and in the swap spreads for both Portugal and
Germany, were not directly related to the change in the yield and in the swap spread
in the leading international long-term interest rates market, the US. Between 17
January and 28 January, 10-year interest rates declined in the US and swap spreads
increased around 40 bp (see Figure 7). This is worthwhile noticing since the US and
the German government 10-year benchmark interest rates were strongly correlated
during 2002.
All in all, the event of 17 January, informally announcing to markets that an early
warning and an excessive deficit procedure was in the pipeline for Portugal and
Germany, seems to have been relevant information to the long-term interest rate
segment of the market.
Event 2 –17 October 2002 (President of the EC calls the strict implementation of the SGP “stupid”) and 24 October 2002 (press statement of the ECB supporting the SGP)
After the declarations of the President of the EC, labelling the strict implementation of
the SGP as “stupid”, there was almost no increase in the 10-year German yield (see Figure 6. 10-year interest rates and swap spreads for Germany
(2002: 16 Jan – 18 Feb)
4.5 4.6 4.7 4.8 4.9 5.0 5.1 5.2 5.3 16- Jan-02 18- Jan-02 22- Jan-02 24- Jan-02 28- Jan-02 30- Jan-02 01- Feb-02 05- Feb-02 07- Feb-02 11- Feb-02 13- Feb-02 15- Feb-02 Y iel d, sw aps (% ) 0 5 10 15 20 25 30 35 40 S w ap spr ead (bp)
Figure 7. 10-year interest rates and swap spreads for the US (2002: 16 Jan – 18 Feb)
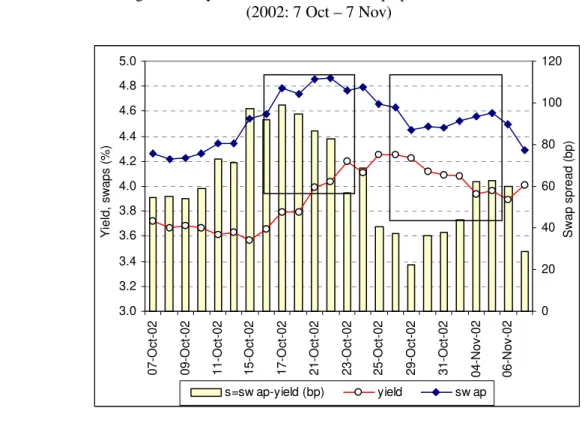
Figure 8. 10-year interest rates and swap spreads for Germany (2002: 7 Oct – 7 Nov)
4.5 4.7 4.9 5.1 5.3 5.5 5.7 5.9 16- Jan-02 18- Jan-02 22- Jan-02 24- Jan-02 28- Jan-02 30- Jan-02 01- Feb-02 05- Feb-02 07- Feb-02 11- Feb-02 13- Feb-02 15- Feb-02 Y iel d, sw aps (% ) 0 10 20 30 40 50 60 70 80 90 100 S w ap spr ead (bp)
s=sw ap-yield (bp) yield sw ap
3.9 4.0 4.1 4.2 4.3 4.4 4.5 4.6 4.7 4.8 4.9 5.0 07-O c t-02 09-O c t-02 11-O c t-02 15-O c t-02 17-O c t-02 21-O c t-02 23-O c t-02 25-O c t-02 29-O c t-02 31-O c t-02 04-N o v-02 06-N o v-02 Y iel d, sw aps (% ) 0 5 10 15 20 25 30 35 S w ap spr ead (bp)
Figure 8). Additionally, the swap spreads were also quite stable around 24 bp between
17 October and 24 October. This last date is also relevant because it was the day when
the ECB issued a press statement in favour of the SGP. After the press statement there
was indeed some decline, around 10/15 bp, in the yields in the subsequent 4/5 days.
Again, these developments have to be gauged against the international market. Just
after the declaration of the President of the EC, yields were quite stable for US bonds
(see Figure 9). After the press statement from the ECB, the decline of German yields
was accompanied by the falling of US long-term yields. Notice however that the swap
spreads for Germany remained relatively stable, around 22-24 bp in the period 17
Oct/30 Oct, while in the US the swap spreads declined from 99 bp to around 36 bp.
Overall, there is no clear evidence that the announcements affected the risk premium.
4. Analytical framework
There are several studies, which try to empirically assess the impact of the fiscal and
political factors on government bond risk premia.21 These studies mostly trace
21
See, for example, Alesina et al (1992), Bernoth et al (2003), Goodhard and Lemmen (1999), Løning (2000).
Figure 9. 10 year-interest rates and swap spreads for the US (2002: 7 Oct – 7 Nov)
3.0 3.2 3.4 3.6 3.8 4.0 4.2 4.4 4.6 4.8 5.0 07-O c t-02 09-O c t-02 11-O c t-02 15-O c t-02 17-O c t-02 21-O c t-02 23-O c t-02 25-O c t-02 29-O c t-02 31-O c t-02 04-N o v-02 06-N o v-02 Y iel d, sw aps (% ) 0 20 40 60 80 100 120 S w ap spr ead (bp)
term developments and use data at a monthly or even lower frequency for a
cross-section of countries or bond issues. The purpose of our study is to analyse the impact
of specific fiscal policy events, and how the information content inherent in these
events is reflected in bond yields.
Extracting the information content of the aforementioned events can be achieved with
different approaches. For a rating action study, one would look at the evolution of
yields over a longer-time horizon before and after the action takes place and data at
daily or lower frequency may suffice.22 To extract the surprise element from an
announcement or event, one should use data as close as possible to the incidence of
the announcement to see the immediate market reaction to this particular information.
Therefore, announcement studies often use higher, intra-day frequencies.23
Using high frequency data and looking at very short time windows however is not
suitable for our fiscal policy events. Official data releases, for example, often follow a
pre-specified calendar and markets participants are prepared to absorb that
information. By comparison, when the Commission releases a communication, the
precise timing of the event may be difficult to determine, since some information may
have leaked before the official announcement. Moreover, the document is only made
available on the Internet with a lag. In addition, the dissemination process may take
longer since market participants are not always alert in advance, and the assessment of
the event may be more complicated than, for example, more straightforward corporate
news. Under these circumstances, using intra-day data seems not suitable.24
The closest to our analysis are the studies by Favero et al (1997) and Codogno et al
(2002). They analyse, among others, developments of government bond yields
vis-à-vis the German benchmark from 1992 onwards. The above description of events
makes clear that this is not a suitable approach for our study since the German bond
yield and the risk premium reflected therein is endogenous to the impact of policy
22
See, for example, Steiner and Heinke (2001). 23
See for example Fleming and Remolna (1999). 24
events. Therefore we cannot use a risk measure based on the relative performance of
European sovereigns.
4.1. Model specification
Taking into account the stylised facts described in the previous section, we now
formally assess the specific effect on interest rate swap spreads of the selected fiscal
policy events. In our model specification we tried to explain the swap spread of the
relevant country in a quite parsimonious way. We used as determinants of the interest
rate swap spreads the interest rate swap spread in the US, a measure of bond market
liquidity, a measure of the stock market risk/volatility, the slope of the yield curve in
the US, and also the already discussed fiscal policy events. 25 As mentioned before,
for a given country we define the swap spread, S, as
t t
t swap yield
S = − , (1)
where swap is the 10-year rate reported for the inter-bank swap market, and yield is
the 10-year government yield. The swap spread is then modelled as
+ +
+ +
+ +
+
= − − t− t
ba t US t US
t t
t S S S Y STOX SLP
S α1 α2 1 α3 α4 1 α5 α6 1 α7
∑
=
+ n
j
j
jdum ddmm
1
_
δ . (2)
SUS is the interest rate swap spread for the US, Yab the bid-ask spread for the 10-year
government bonds, STOX the average of the volatility of put and call options on the
Eurostoxx index, SLP the slope of the US yield curve, and dum_ddmm are dummies
used as proxies for the fiscal policy events.
As a measure of the international factors that might have an impact on the
determination of the long-term swap spread for the European swap spreads, we use
the long-term interest rate swap spread for the US. This is done taking into account
25
the leading role of the US economy and its capital markets in the world. Furthermore,
we assume that the US interest rate swap spread does not react to changes in the
European interest rate swap spread. One would expect the long-term US swap spread
to increase as a sign of a fall of government bond yields relative risk vis-à-vis the
swap market, if there is an increase in the demand for US government bonds.
Assuming the existence of spillover effects to the European government bond market,
there might also be a raise in the demand for European long-term bonds. This leads to
rising prices, declining 10-year government bond yields, and the consequent increase
of European interest rate swap spreads. If instead of a spill-over effect, the increase in
the demand for US government bonds implies demand substitution vis-à-vis European
government bonds, i.e. less demand for sovereign European debt, then a decrease of
European interest rate swap spreads might occur.
Liquidity is an important element in spread valuation. Our liquidity measure is the
bid-ask spread relative to each 10-year benchmark government bond. An increase in
the bid-ask spread implies a larger distance between offer and demand orders,
therefore less liquidity for the benchmark bond market segment. This in turn might
raise the short-term relative risk of government bonds vis-à-vis the swap rates and
tighten the swap spread. Therefore, one should expect a negative relation between the
bid-ask spread and the swap spread.26
Concerning the effects of stock market volatility on the interest rate swap spreads, we
selected the average of the volatility of the put and call options on the Eurostoxx
equity index. For instance, if there is an increase of the average volatility of puts and
calls, implying that the equity segment might be temporarily experiencing a riskier
period, then some demand for securities can shift towards less riskier segments,
namely long-term government bonds. This movement will raise prices and decrease
the yield-to-maturity of 10-year government bonds, increasing therefore the
corresponding swap spread. Consequently, a positive relation between the measure of
equity risk and the interest rate swap spread is expected.
26Most standard measures of market liquidity (trade size, trade impact, spread between more and
The slope of the yield curve is computed as the difference between the 10-year
government bond yields and the 3-month interest rates. Future growth expectations,
related to a steeper slope of the yield curve, may indeed reduce the relative risk of
private versus government bonds. Therefore, one might expect that the decrease in the
relative risk of private bonds, vis-à-vis government bonds – depicted for example in
the increase of the government yields and of the yield curve slope – reduces the swap
spread.
For the fiscal policy events reported on Table 1, we created dummy variables that
takes the value one for the date of the event and assumes the value zero for the rest of
the year. Afterwards, an alternative approach is tested using a time window for these
dummy variables, and this is explained in more detail in sub-section 4.3.
4.2. Estimation results and discussion
Our data sample covers the entire year 2002 including 253 daily observations. We
estimate seemingly unrelated regressions for the specification given in (2), for 13
countries. Luxembourg is not included due to missing data. The UK is excluded since
unit root tests showed that the swap spread is non-stationary (unit root tests for the
variables are reported in Appendix 2). For the same reason, both the proxy for the
stock market volatility (the STOX variable) and the yield curve inclination (the SLP
variable) are used in first differences. The model specification to be estimated is
+ ∆
+ ∆
+ +
+ +
+
= − − t− t
ba t US t US
t t
t S S S Y STOX SLP
S α1 α2 1 α3 α4 1 α5 α6 1 α7
∑
=
+ n
j
j
jdum ddmm
1
_
δ . (3)
Overall, the estimation results do not seem to differ substantially for the sample
countries. In fact, most of the fiscal policy events turned out not to be statistically
significant in explaining the swap spreads for the majority of countries. We report in
Table 2 the estimation results of specification (3) for the countries more directly
Table 2. Selected SUR estimates of equation (3) for Portugal, Germany and France (01/04/2002 to 12/31/2002)
Panel A Panel B
Portugal Germany France Portugal Germany France Constant 0.0070 (0.77) 0.0519 (5.62) *** 0.0484 (5.65) *** 0.0071 (0.77) 0.0511 (5.48) *** 0.0476 (5.52) *** 1 − t S 0.6057 (17.38) *** 0.7608 (28.21) *** 0.6771 (27.97) *** 0.6001 (17.11) *** 0.7611 (28.19) *** 0.6764 (28.02) *** US t S -0.0676 (-2.22) *** -0.0663 (-2.47) *** -0.0475 (-1.49) -0.0777 (-2.55) *** -0.0727 (-2.70) *** -0.0524 (-1.66) * US t
S−1
0.0593 (1.84) ** 0.0731 (2.56) *** 0.0453 (1.35) 0.0687 (2.12) *** 0.0795 (2.78) *** 0.0511 (1.52) ba t Y -0.0053 (-0.0665) -0.0003 (-1.73) * -0.0132 (-0.86) -0.0110 (-0.13) -0.0003 (-1.76) * -0.0121 (-0.78) ∆STOXt 0.0007
(0.70) 0.0008 (0.99) 0.0015 (1.47) 0.0007 (0.67) 0.0010 (1.11) 0.0018 (1.73) * t SLP ∆ -0.0040 (-0.10) -0.0674 (-1.84) * -0.0091 (-0.21) -0.0102 (-0.25) -0.0690 (-1.88) * -0.0138 (-0.32) Dum_1701 -0.0613 (-1.88) * -0.0305 (-1.04) 0.0103 (0.30) Dum_1202 -0.0389 (-1.20) -0.0528 (-1.82) * 0.0136 (0.40) Dum_2006 0.0075 (0.23) 0.0245 (0.84) 0.0200 (0.59) Dum_2607 -0.0078 (-0.24) 0.0217 (0.73) 0.0454 (1.31) Dum_0511 0.0635 (1.95) * 0.0554 (1.90) * 0.0411 (1.21) Dum_1311 0.0188 (0.57) 0.0062 (0.21) 0.0121 (0.35)
SE of reg. 0.03 0.03 0.03 0.03 0.03 0.03
Adj. R2 0.37 0.52 0.46 0.37 0.52 0.46
DW 1.94 1.97 1.96 1.93 1.96 1.93
Notes: total system (balanced) observations 3211. 1) t-statistics in brackets.
2) * - significant at the 10% level; ** - significant at the 5% level; *** - significant at the 1% level. 3) For the description and the date of the events, relating to the dummy variables, see Table 1. For instance, dum_1701 relates to the rumours of early warnings for Portugal and for Germany on 17 January.
Swap spreads react to the US swap spread, and this holds for all countries. The
bid-ask spread, the liquidity measure, seems to be only relevant for Germany, and is not
statistically significant for Portugal or France. There is also evidence that equity
market volatility is relevant in determining swap spreads in France, at least at the 10
per cent significance level, but no such evidence exists for Germany or Portugal.
Regarding the fiscal policy events, all belonging to the first type, estimates indicate
little relevance in terms of their explanatory power for swap spreads. However, one
may perhaps notice a few interesting points. The rumours of the early warning for
Portugal and Germany on 17 January (see dum_1701) seem to have actually
decreased the swap spread for Portugal in line with the rationale presented in section 3
effects for Germany, except maybe when ECOFIN did not launch the EDP procedure
on 12 February (see dum_1202), there was also a decline of the German swap spread
(at the 10 per cent level).
Concerning the event that occurred on 5 November, when the Council declares that
Portugal has an excessive deficit, there is some statistical evidence of an increase in
the swap spreads both for Portugal and Germany (see Panel B of Table 2). This
particular episode is additionally illustrated for Portugal in Figure 10 that clearly
depicts the increase of the swap spread on that date.
A possible interpretation of that finding is that capital markets viewed the actual
decision to adopt an EDP against Portugal not as new information on a risky position
of public finances in Portugal. Rather it might have been seen as an event signalling
the credibility of the European fiscal framework as such, in the context of the general
uncertainty created by the public debate, since rules were actually implemented.
Alternatively it might also have reflected a reassurance that Portugal in the first case,
but possibly Germany later on, would actually make more serious efforts to adjust
their public finances. The coefficient for Portugal is slightly larger than for Germany.
But the difference between the two coefficients is very small pointing, if anything, Figure 10. 10-year interest rates and swap spreads for Portugal
(2002: 7 Oct – 7 Nov)
4.2 4.3 4.4 4.5 4.6 4.7 4.8 4.9 5.0 5.1 5.2 07-O c t-02 09-O c t-02 11-O c t-02 15-O c t-02 17-O c t-02 21-O c t-02 23-O c t-02 25-O c t-02 29-O c t-02 31-O c t-02 04-N o v-02 06-N o v-02 Y iel d, sw aps (% ) -2 -1 0 1 2 3 4 5 6 7 8 S w ap spr ead (bp)
more to a “common credibility effect” rather than to the assessment of adjustments in
the each country.
In Table 3 we report estimation results for another set of events for the same three
countries as above, as well as for Spain and for Greece.
Table 3. Selected SUR estimates of equation (3) for Portugal, Germany, France, Spain and Greece (10/04/2002 to 12/31/2002)
Portugal Germany France Spain Greece
Constant 0.0075 (0.81) 0.0541 (5.77) *** 0.0494 (5.71) *** 0.0395 (4.53) *** -0.0111 (-0.99) 1 − t S 0.6037 (17.30) *** 0.7534 (27.84) *** 0.6734 (27.85) *** 0.6876 (31.82) *** 0.5693 (18.46) *** US t S -0.0825 (-2.66) *** -0.0656 (-2.37) *** -0.0466 (-1.43) 0.0008 (0.03) 0.0266 (0.70) US t
S−1
0.0729 (2.24) *** 0.0709 (2.44) *** 0.0438 (1.29) -0.0281 (-0.81) -0.0547 (-1.37) ba t Y -0.0141 (-0.17) -0.0003 (-1.73) * -0.0124 (-0.80) -0.0033 (-0.08) -0.1588 (-1.98) ** ∆STOXt 0.0005
(0.51) 0.0007 (0.83) 0.0015 (1.44) 0.0004 (0.38) 0.0014 (1.14) t SLP ∆ -0.0163 (-0.39) -0.059 (-1.57) -0.0099 (-0.22) 0.0510 (1.13) 0.0998 (1.91) * Dum_2409 0.0030 (0.09) 0.0198 (0.67) 0.0100 (0.29) 0.0057 (0.16) 0.0304 (0.75) Dum_0810 0.0033 (0.10) 0.0089 (0.30) 0.0007 (0.02) -0.0231 (-0.66) -0.0077 (-0.19) Dum_1710 0.0087 (0.26) -0.0061 (-0.20) -0.0085 (-0.24) 0.0141 (0.39) -0.0225 (-0.5400) Dum_2410 0.0274 (0.84) 0.0060 (0.20) -0.0099 (-0.29) 0.0254 (0.73) 0.0326 (0.80) Dum_2711 0.0645 (1.97) ** -0.0101 (-0.34) 0.0061 (0.17) 0.0504 (1.44) 0.0836 (2.06) **
SE of reg. 0.03 0.03 0.04 0.04 0.04
adj. R2 0.37 0.51 0.45 0.51 0.44
DW 1.92 1.99 1.95 1.96 1.97
Notes: total system (balanced) observations 3211. 1) t-statistics in brackets.
2) * - significant at the 10% level; ** - significant at the 5% level; *** - significant at the 1% level. 3) For the description and the date of the events, relating to the dummy variables, see Table 1. For instance, dum_2711 relates to the attempt by the EC to accommodate some of the criticism expressed by government officials against the Pact.
Concerning the event of 17 October (see dum_1710), when the President of the EC
mentioned that a rigid application of the SGP would be a “stupid” avenue, there is no
evidence of significant reactions from the markets. Indeed, the markets may have
interpreted the announcement as not raising the risk of the European long-term
government bond benchmarks vis-à-vis the 10-year interest rate swaps and,
Regarding the event of 27 November, when the EC tried to accommodate some of the
criticism expressed by the government officials against the Pact, there is some
evidence of swap spread increases for Portugal and Greece. This can be interpreted as
capital markets assigning a lower relative level of risk to those countries sovereign
debt vis-à-vis the swap interest rates. Interestingly, these countries are precisely the
ones with the lowest GDP per capita of the EU.27 Therefore, the fact that markets
might perceive some loosening in the EC attitude could have led to a decrease in the
relative risk level vis-à-vis private debt of countries with a lower credit rating.
Alternatively, the result could again be interpreted as reflecting a credibility effect
related to the European fiscal framework, as our review of investment bank
documents indicates. Market participants might have seen this as re-invigorating of
the Stability and Growth Pact.
Given the different sensitivity of market participants regarding the credibility of the
Pact and a strict implementation of rules, this lack of clear significant reaction may
not come as a surprise. Our results however do not allow distinguishing between
simple neglect, on the one hand, and opposite reactions cancelling out each other at
the aggregate level, on the other hand. The only assessment that can be made is that
the reaction to the events, if any, was not sufficiently unanimous to produce any
sizeable result. In cases where the reaction of swap spreads turned out to be
significant, the impact has been mostly 5 bp or less, but not exceeding 10 bp,
according to our estimates. This is still sizeable provided that maximum spreads
between government bond yields on average were around 30 bp for euro area
countries in recent years (Blanco 2001).28
27
For instance, Afonso (2003) reports that sovereign rating is highly correlated with GDP per capita. Indeed, with the exception of Spain, rated triple A in 2002 by Moody’s (but not by S&P), Portugal and Greece’s government debt had lower ratings than the EU15 average. Aside from Portugal and Greece, Spain is the only country for which the estimated coefficient for this event attains statistical significance (14%) close to standard levels.
28
4.3. Testing anticipation and persistence
As discussed at the beginning of this section, ‘type 1’ events resemble some
characteristics of credit rating action. They may have been anticipated and they could
be expected to have a lasting impact on spreads. Therefore, we use now forward and
backward moving windows of dummy variables, extending to several days before and
after the event, in our regressions. This should allow us to assess if interest rate swaps
react to fiscal policy events with leads and how they change thereafter.29
Specifically, we used an increasing backward window of 10 days before the date of
the fiscal policy event and a forward increasing window of 10 days after the date of
the event. Coding a dummy variable for these different intervals before and after the
event with one (and zero otherwise)30 captures the shifting mean swap spreads over
this time period. This implies that one has to estimate 20 additional SUR systems for
each relevant policy event.
As an example of the results obtained from these additional estimations, we present in
Figure 11 and Figure 12 the estimates for the coefficient of the dummy variable used
to capture the effect of the early warning decision on 12 February on German and
Portuguese swap spreads.
Concerning the fiscal policy event of 12 February 2002 the estimates indicate an
anticipating behaviour in capital markets during the 4-5 days before the event (notice
that t-2 and t-3 was a weekend). This behaviour was clearer for Germany than for
Portugal and the estimated coefficients are always negative in line with the results
reported in Table 3. Additionally, one should notice that the absolute value of the
estimated coefficient for the case of Germany was around 0.022/0.023 in days t-4, t-5
and t-6 and it was a bit higher, 0.053, on the day of the event itself. A similar point
can be made for Portugal, with a slightly higher absolute coefficient for the dummy
on the day of the event, 0.0387, than in days t-4 and t-5 (0.021/0.025).
29
Steiner and Heinke (2001) compute excess returns with rolling forward and backward windows, although the analytical impementation is different from ours.
30
Figure 11. Statistical significance of the dummy coefficient on the “failed” early warning
(12 Feb 2002) on German interest rate swap spreads
0 0.1 0.2 0.3 0.4 0.5 0.6 0.7 0.8 0.9 1
-10 -9 -8 -7 -6 -5 -4 -3 -2 -1
12
Feb
02 1 2 3 4 5 6 7 8 9 10
days around event
probabilit
y
-0.07 -0.06 -0.05 -0.04 -0.03 -0.02 -0.01 0.00 0.01 0.02
c
oef
fi
c
ient
probability (lhs scale) coefficient (rhs scale)
Note: the two horizontal bars denote the 10% and 5% significance levels respectively.
Figure 12. Statistical significance of the dummy coefficient on the “failed” early warning (12 Feb 2002) on Portuguese interest rate swap spreads
0 0.1 0.2 0.3 0.4 0.5 0.6 0.7 0.8 0.9 1
-10 -9 -8 -7 -6 -5 -4 -3 -2 -1
12
Feb
02 1 2 3 4 5 6 7 8 9 10
days around event
probabilit
y
-0.04 -0.03 -0.02 -0.01 0.00 0.01 0.02
c
oef
fi
c
ient
probability (lhs scale) coefficient (rhs scale)
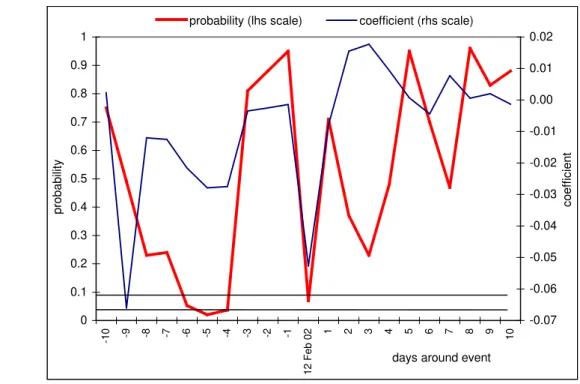
In Figure 13 we present the results of similar SUR estimations for the fiscal policy
event that occurred when the Council declared that Portugal had an excessive deficit,
on 5 November 2002. We only present the results for Portugal.
Notice that the statistical significance of the estimated coefficient for the dummy
variable is slightly increasing two days before the event. The absolute value of the
estimated coefficient for the dummy variable again is higher at the date of the event,
0.064, than in days t-1 and t-2 before (0.035/0.038).
We also performed this estimation strategy of backward/forward windows for other
fiscal policy events. The exercise did not produce any further informative results and
estimates are therefore not reported. Based on this analysis, fiscal policy events seem
to bring additional information for the pricing of long-term bonds in capital markets
mainly at the date of the event, and there is little indication for anticipation effects. Figure 13. Statistical significance of the dummy coefficient on the declaration by the Council
(5 Nov 2002) on Portuguese swap spreads
Note: the two horizontal bars denote the 10% and 5% significance levels. 0
0.1 0.2 0.3 0.4 0.5 0.6 0.7 0.8 0.9 1
-1
0 -8 -6 -4 -2
12
Feb
02 2 4 6 8 10
days around event
pr
obab
ility
0.00 0.01 0.02 0.03 0.04 0.05 0.06 0.07
coef
fi
ci
ent
4.4. Additional evidence from CDS
We also assess the responsiveness of credit default swaps (CDS) to the
aforementioned fiscal policy events.31 CDS rates have been used as measures of
default risk in other studies. For instance, Hull, Predescu and White (2003) report that
CDS spread changes tend to anticipate negative rating announcements (one might also
think of “adverse” fiscal policy events) using a sample of 1,599 entities, including
corporations, sovereigns and quasi-sovereigns.
In Figure 14 we present the evolution of the 10-year CDS in basis points, in the fourth
quarter of 2002, for the relevant countries. We include Austria as a control country
that in principle should have been less affected by country specific fiscal events. The
data that we got for CDS basically show nearly no changes for the first three-quarters
Figure 14. 10-year CDS (2002: Sep 2-Dec 31)
0 5 10 15 20 25
9/2 9/7
9/12 9/17 9/22 9/27 10/2 10/7
10/12 10/17 10/22 10/27 11/1 11/6 11/11 11/16 11/21 11/26 12/1 12/6 12/11 12/16 12/21 12/26 12/31
bas
is
poi
nts
E V E N T S IT A L Y F R A N C E P O R T UG A L A US T R IA G E R M A N Y
Source: JPMorgan.
31