Carlos Pestana Barros & Nicolas Peypoch
A Comparative Analysis of Productivity Change in Italian and
Portuguese Airports
WP 006/2007/DE
_________________________________________________________
João Carlos Lopes & Paula Cristina Albuquerque
The characteristics and regional distribution of
older workers in Portugal
WP 22/2012/DE/UECE/SOCIUS
_________________________________________________________
De p a rtm e nt o f Ec o no m ic s
W
ORKINGP
APERSISSN Nº 0874-4548
1
The characteristics and regional distribution of older workers in Portugal
João Carlos Lopes
1, Paula Cristina Albuquerque
2 1ISEG (School of Economics and Management) - Technical University of Lisbon, and UECE (Research Unit on Complexity and Economics), Portugal, [email protected]
2
ISEG (School of Economics and Management) - Technical University of Lisbon, and SOCIUS (Research Centre in Economic and Organizational Sociology) Portugal, [email protected]
ABSTRACT
Population ageing is a common trend in most developed countries with many important economic, social and political consequences. In Portugal, this trend has been particularly strong. The ageing index was 34% in 1970, it is about 129% in 2011, according to the provisory results of the last Census and most recent demographic projections, is expected to be over 240% in 2030. One of the main issues associated with ageing is its effect on the composition of the labour force. The main purpose of this paper is to study the changes in the age structure of the Portuguese labour force between 1989 and 2009. First of all, the size and relative weight of older workers are quantified, both as a group (people with more than 54 years old), by age sub-groups (55-59; 60-64; 65 +) and gender. Then, particular attention is given to the regional distribution of these workers, both at the Nuts II (7 regions) and Nuts III (30 regions) levels. The sectoral distribution is also measured, at national and regional levels. Finally, a comparative analysis is made between younger and olderer workers, considering the education levels,
establishments’ size, labour compensation and part-time versus full time work regime. The main data used are Quadros de Pessoal, from Ministry of Solidarity and Social Security covering
people working in the private business sector (around 3,3 million workers, in 2009) and excluding liberal professionals.
Keywords: Older workers; Private business sector; Portuguese regions
1. INTRODUCTION
Population ageing has many consequences, some of which affect the workforce and the labour market. Although population ageing is a nationwide phenomenon, it does not affect all parts of Portugal equally. The consequent change in the age composition of the workforce has implications in terms of productivity, of labour costs and of the suitability of management strategies. It is important to acknowledge regional differences in order to adapt policies and the management of firms accordingly.
There are significant and persistent differences in the regional composition of the workforce in Portugal, related to its dimension, age composition, education level, industry specialization and remuneration. In this study, we analyze these differences, trying to grasp the most noticeable changes between 1989, 1999 and 2009.
2
Although the definition of an older worker starting at a particular age is arbitrary, we identify older workers with those 55 and older, which is in accordance with other studies (e.g. [7] and [15]
).
Population ageing, together with a trend to stop working later in life, will give this group of workers a greater weight. Differing age profiles across regions and across occupational sectors provide us with information about potential future labour force needs.
While pension reforms are directed at increasing labour supply of older workers, it is necessary to involve the demand side, in order to promote active ageing [8, 9, 10]. The level of qualifications and skills is a characteristic that affects the retention of workers in the labour market. Even if they do not want to retire, they are particularly at risk of unemployment. And older workers exhibit lower levels of education, on average. We analyse the evolution in the profile of the education level of older workers, in Portugal, comparing it to that of younger workers.
Flexible work is a potential way of extending the working lives of older workers [11]. In our study, we look at rates of part time work of Portuguese workers.
We use Quadros de Pessoal, a large database collected on an annual basis about the
Portuguese firms and its workers, provided by the Ministry of Solidarity and Social Security. It covers people working in the private business sector (around 3,3 million workers, in 2009), excluding liberal professionals.
2. THE MAIN DIFFERENCES BETWEEN YOUNGER AND OLDER WORKERS
In this section, an analysis is made of the main differences between younger and older workers in Portugal, its evolution in time (1989, 1999 and 2009) and by gender, as well as by sector and several other dimensions: education level, part time/full time regimes, establishment size and average labour compensation.
Age structure and dynamics of older and younger male and female workers
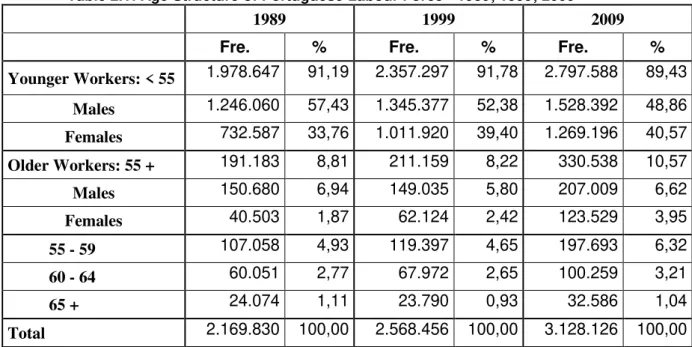
The older workers (55 or more years old) registered in Quadros de Pessoal – 2009 (QdP)
represent 10,57% of the total Portuguese Labour Force, or 330.538 in 3.128.126 (see Table 2.1). Among this age group, 6,62% are male and 3,95% female, and this gender bias is more pronounced than among younger workers (48,9 % male versus 40,57% female). The proportion of older workers diminishes significantly with age, as expected: 6,32% are in the sub-group 55-59 years old; 3,21% in 60-64, and interestingly and sometimes forgotten, 1,21% (or 32.586) above the legal (normal) retirement age of 65.
The ageing of the Portuguese labour force is a recent phenomenon, in relative terms. As a matter of fact, in Table 1 it is shown that the weight of older workers has slightly decayed from 8,81% in 1989 to 8,22% in 1999 (corresponding to an absolute increase of 19.976 workers and a growth rate of only 10,45% in the entire decade).
3
Table 2.1: Age Structure of Portuguese Labour Force - 1989; 1999; 2009
1989
1999
2009
Fre.
%
Fre.
%
Fre.
%
Younger Workers: < 55
1.978.647
91,19
2.357.297
91,78
2.797.588
89,43
Males
1.246.060
57,43
1.345.377
52,38
1.528.392
48,86
Females
732.587
33,76
1.011.920
39,40
1.269.196
40,57
Older Workers: 55 +
191.183
8,81
211.159
8,22
330.538
10,57
Males
150.680
6,94
149.035
5,80
207.009
6,62
Females
40.503
1,87
62.124
2,42
123.529
3,95
55 - 59
107.058
4,93
119.397
4,65
197.693
6,32
60 - 64
60.051
2,77
67.972
2,65
100.259
3,21
65 +
24.074
1,11
23.790
0,93
32.586
1,04
Total
2.169.830 100,00
2.568.456 100,00
3.128.126 100,00
Table 2.2: Changes in Age Structure of Portuguese Labour Force
1989/1999
1999/2009
Δ
Fre.
Δ
Fre. %
Δ
Rel %
Δ
Fre.
Δ
Fre. %
Δ
Rel %
Younger Workers: < 55
378.650
19,14
0,59
440.291
18,68
-2,35
Males
99.317
7,97
-5,05
183.015
13,60
-3,52
Females
279.333
38,13
5,64
257.276
25,42
1,18
Older Workers: 55 +
19.976
10,45
-0,59
119.379
56,54
2,35
Males
-1.645
-1,09
-1,14
57.974
38,90
0,82
Females
21.621
53,38
0,55
61.405
98,84
1,53
55 - 59
12.339
11,53
-0,29
78.296
65,58
1,67
60 - 64
7.921
13,19
-0,12
32.287
47,50
0,56
65 +
-284
-1,18
-0,18
8.796
36,97
0,12
Total
398.626
18,37
0,00
559.670
21,79
0,00
Analysis by sector
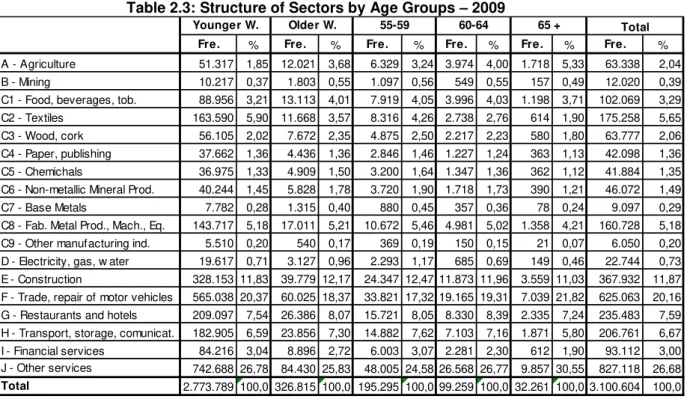
The analysis of the distribution of older workers by sector in Portugal shows that, in 2009 (Table 2.3), they are concentrated in services, the most labour intensive sectors: 25,8% in Other Services; 18,4% in Trade; 12,2% in Construction; 8,1% in Restaurants and Hotels; 7,3% in Transport Services. The large sector outside services is Fabricated Metal Products, Machinery and Equipment (with 5,2% of all older workers), followed by Food, Beverages and Tobacco (4%), Agriculture (3,7%), Textiles (3,6%), Wood and cork (2,4%) and Non-metallic Mineral Products (1,8%).
4
communications has lost a position (from 4th to 5th) to Restaurants and hotels, mainly by the strong growth of this last sector, from 4,2% in 1989 to 6,7% in 1999 and the already mentioned 8,1% in 2009.
Table 2.3:Structure of Sectors by Age Groups – 2009
Table 2.4:Structure of Sectors by Age Groups – 1999
Fre. % Fre. % Fre. % Fre. % Fre. % Fre. %
A - Agriculture 51.317 1,85 12.021 3,68 6.329 3,24 3.974 4,00 1.718 5,33 63.338 2,04
B - Mining 10.217 0,37 1.803 0,55 1.097 0,56 549 0,55 157 0,49 12.020 0,39
C1 - Food, beverages, tob. 88.956 3,21 13.113 4,01 7.919 4,05 3.996 4,03 1.198 3,71 102.069 3,29
C2 - Textiles 163.590 5,90 11.668 3,57 8.316 4,26 2.738 2,76 614 1,90 175.258 5,65
C3 - Wood, cork 56.105 2,02 7.672 2,35 4.875 2,50 2.217 2,23 580 1,80 63.777 2,06
C4 - Paper, publishing 37.662 1,36 4.436 1,36 2.846 1,46 1.227 1,24 363 1,13 42.098 1,36
C5 - Chemichals 36.975 1,33 4.909 1,50 3.200 1,64 1.347 1,36 362 1,12 41.884 1,35
C6 - Non-metallic Mineral Prod. 40.244 1,45 5.828 1,78 3.720 1,90 1.718 1,73 390 1,21 46.072 1,49
C7 - Base Metals 7.782 0,28 1.315 0,40 880 0,45 357 0,36 78 0,24 9.097 0,29
C8 - Fab. Metal Prod., Mach., Eq. 143.717 5,18 17.011 5,21 10.672 5,46 4.981 5,02 1.358 4,21 160.728 5,18
C9 - Other manufacturing ind. 5.510 0,20 540 0,17 369 0,19 150 0,15 21 0,07 6.050 0,20
D - Electricity, gas, w ater 19.617 0,71 3.127 0,96 2.293 1,17 685 0,69 149 0,46 22.744 0,73
E - Construction 328.153 11,83 39.779 12,17 24.347 12,47 11.873 11,96 3.559 11,03 367.932 11,87
F - Trade, repair of motor vehicles 565.038 20,37 60.025 18,37 33.821 17,32 19.165 19,31 7.039 21,82 625.063 20,16
G - Restaurants and hotels 209.097 7,54 26.386 8,07 15.721 8,05 8.330 8,39 2.335 7,24 235.483 7,59
H - Transport, storage, comunicat. 182.905 6,59 23.856 7,30 14.882 7,62 7.103 7,16 1.871 5,80 206.761 6,67
I - Financial services 84.216 3,04 8.896 2,72 6.003 3,07 2.281 2,30 612 1,90 93.112 3,00
J - Other services 742.688 26,78 84.430 25,83 48.005 24,58 26.568 26,77 9.857 30,55 827.118 26,68
Total 2.773.789 100,0 326.815 100,0 195.295 100,0 99.259 100,0 32.261 100,0 3.100.604 100,0
Total Younger W. Older W. 55-59 60-64 65 +
Fre. % Fre. % Fre. % Fre. % Fre. % Fre. %
A - Agriculture 41.125 1,75 10.058 4,77 4.245 3,57 4.062 5,98 1.751 7,36 51.183 1,99
B - Mining 13.042 0,55 1.678 0,80 818 0,69 678 1,00 182 0,77 14.720 0,57
C1 - Food, beverages, tob. 81.781 3,47 9.659 4,58 5.367 4,51 3.167 4,66 1.125 4,73 91.440 3,56
C2 - Textiles 283.082 12,02 12.282 5,83 7.628 6,41 3.692 5,44 962 4,04 295.364 11,51
C3 - Wood, cork 40.196 1,71 4.668 2,22 2.437 2,05 1.721 2,53 510 2,14 44.864 1,75
C4 - Paper, publishing 43.061 1,83 4.185 1,99 2.535 2,13 1.206 1,78 444 1,87 47.246 1,84
C5 - Chemichals 38.251 1,62 4.118 1,95 2.553 2,14 1.204 1,77 361 1,52 42.369 1,65
C6 - Non-metallic Mineral Prod. 61.939 2,63 6.349 3,01 3.646 3,06 2.118 3,12 585 2,46 68.288 2,66
C7 - Base Metals 9.217 0,39 1.094 0,52 711 0,60 325 0,48 58 0,24 10.311 0,40
C8 - Fab. Metal Prod., Mach., Eq. 189.591 8,05 13.283 6,30 8.409 7,06 3.703 5,45 1.171 4,92 202.874 7,91
C9 - Other manufacturing ind. 47.909 2,03 3.877 1,84 2.115 1,78 1.382 2,03 380 1,60 51.786 2,02
D - Electricity, gas, w ater 16.280 0,69 971 0,46 723 0,61 203 0,30 45 0,19 17.251 0,67
E - Construction 247.678 10,52 22.956 10,89 12.190 10,24 8.386 12,35 2.380 10,01 270.634 10,55
F - Trade, repair of motor vehicles 485.810 20,63 44.652 21,19 23.499 19,74 14.952 22,02 6.201 26,07 530.462 20,67
G - Restaurants and hotels 160.217 6,80 14.006 6,65 8.042 6,76 4.580 6,74 1.384 5,82 174.223 6,79
H - Transport, storage, comunicat. 135.385 5,75 16.033 7,61 11.043 9,28 4.116 6,06 874 3,67 151.418 5,90
I - Financial services 80.442 3,42 6.279 2,98 4.740 3,98 1.288 1,90 251 1,06 86.721 3,38
J - Other services 380.063 16,14 34.582 16,41 18.332 15,40 11.129 16,39 5.121 21,53 414.645 16,16
Total 2.355.069 100,0 210.730 100,0 119.033 100,0 67.912 100,0 23.785 100,0 2.565.799 100,0
5
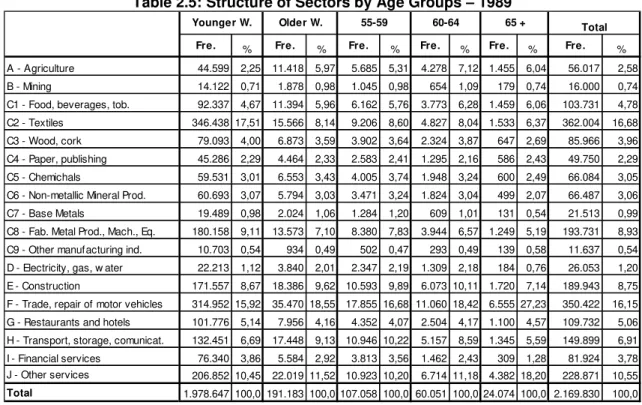
Table 2.5:Structure of Sectors by Age Groups – 1989
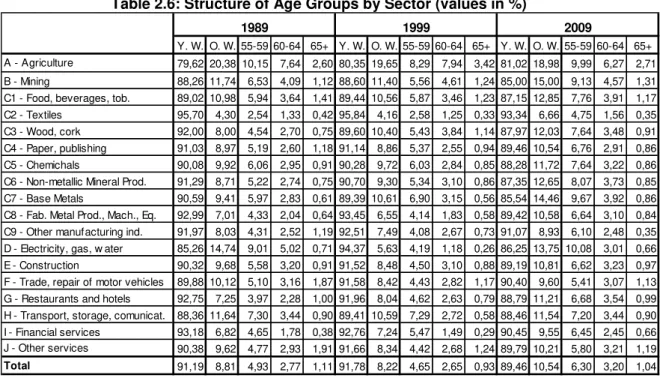
It is important to notice that the relatively small percentage of older workers in Agriculture is explained by the absence in this Database (QdP) of independent farmers. In fact, this sector
has by far the most aged labour force of all, around 20% in all the years covered (see Table 2.6). The second sector according to this criterion is Mining (15% in 2009; 11,4% in 1999 and 11,8% in 1988), followed by Basic Metal products (14,46%) and Electricity, gas and water (13,8%). This last sector has had a strange ageing process, with a percentage of older workers of only 5,6% in 1999, below the national average (8,2%), and 14,7% in 1989, clearly above the average for that year (8,8%). Closing the top five “aged” sectors in 2009 is Food, beverages and
tobacco with 12,9%, slightly above the previous levels around 11% in 1999 and 1989.
On the other hand, the “younger” sector in Portugal, since 1989, is Textiles, starting with only
4,3% of the labour force with 55 years old and above, 4,2% in 1999 and 6,7% in 2009. As it is well known, this sector has been the most representative of a global trend of de-industrialization in Portugal [12], particularly after the beginning of Economic and Monetary Union, in 1999, starting with 362 thousands of workers in 1989 (16,7%), 295,3 in 1999 (11,5%) and 175,2 in 2009 (5,6%). The other side of this coin is the strong growth of services, particularly Other Services (Rental, Business, Health and Education), Trade (by far the largest individual sector in Portugal, with 20% of QdP labour force), Restaurants and Hotels, Transport and Financial
Services, as well as the Construction sector. All these sectors have today the largest number of older workers in absolute terms, as expected, but its relative ageing is close to the national average (slightly above in three of them – Transport, Restaurants and Hotels and Construction and below the average in the others).
By sub-groups, it is worth mentioning the strong weight of the two oldest older (60 and above) in Agriculture, and its almost insignificant weight in Textiles, just to mention the two extreme cases.
Fre. % Fre. % Fre. % Fre. % Fre. % Fre. %
A - Agriculture 44.599 2,25 11.418 5,97 5.685 5,31 4.278 7,12 1.455 6,04 56.017 2,58 B - Mining 14.122 0,71 1.878 0,98 1.045 0,98 654 1,09 179 0,74 16.000 0,74 C1 - Food, beverages, tob. 92.337 4,67 11.394 5,96 6.162 5,76 3.773 6,28 1.459 6,06 103.731 4,78 C2 - Textiles 346.438 17,51 15.566 8,14 9.206 8,60 4.827 8,04 1.533 6,37 362.004 16,68 C3 - Wood, cork 79.093 4,00 6.873 3,59 3.902 3,64 2.324 3,87 647 2,69 85.966 3,96 C4 - Paper, publishing 45.286 2,29 4.464 2,33 2.583 2,41 1.295 2,16 586 2,43 49.750 2,29 C5 - Chemichals 59.531 3,01 6.553 3,43 4.005 3,74 1.948 3,24 600 2,49 66.084 3,05 C6 - Non-metallic Mineral Prod. 60.693 3,07 5.794 3,03 3.471 3,24 1.824 3,04 499 2,07 66.487 3,06 C7 - Base Metals 19.489 0,98 2.024 1,06 1.284 1,20 609 1,01 131 0,54 21.513 0,99 C8 - Fab. Metal Prod., Mach., Eq. 180.158 9,11 13.573 7,10 8.380 7,83 3.944 6,57 1.249 5,19 193.731 8,93 C9 - Other manufacturing ind. 10.703 0,54 934 0,49 502 0,47 293 0,49 139 0,58 11.637 0,54 D - Electricity, gas, w ater 22.213 1,12 3.840 2,01 2.347 2,19 1.309 2,18 184 0,76 26.053 1,20 E - Construction 171.557 8,67 18.386 9,62 10.593 9,89 6.073 10,11 1.720 7,14 189.943 8,75 F - Trade, repair of motor vehicles 314.952 15,92 35.470 18,55 17.855 16,68 11.060 18,42 6.555 27,23 350.422 16,15 G - Restaurants and hotels 101.776 5,14 7.956 4,16 4.352 4,07 2.504 4,17 1.100 4,57 109.732 5,06 H - Transport, storage, comunicat. 132.451 6,69 17.448 9,13 10.946 10,22 5.157 8,59 1.345 5,59 149.899 6,91 I - Financial services 76.340 3,86 5.584 2,92 3.813 3,56 1.462 2,43 309 1,28 81.924 3,78 J - Other services 206.852 10,45 22.019 11,52 10.923 10,20 6.714 11,18 4.382 18,20 228.871 10,55
Total 1.978.647 100,0 191.183 100,0 107.058 100,0 60.051 100,0 24.074 100,0 2.169.830 100,0
6
Table 2.6: Structure of Age Groups by Sector (values in %)
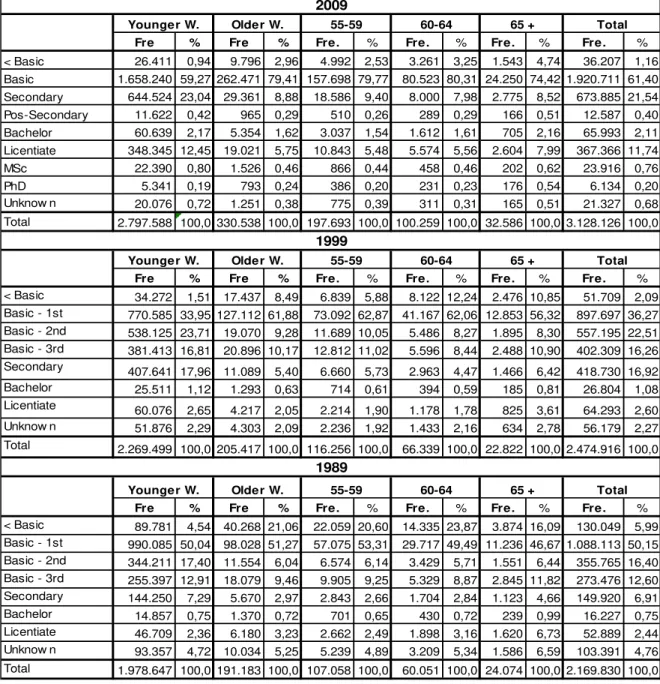
Education levels
One of the main structural problems of the Portuguese economy, and society at large, is the low education level of the labour force [13], and the results obtained in this paper confirm this stylized fact. Generally speaking, almost two thirds of all the workers registered in QdP – 2009 have at most a Basic education (Level I), around one quarter a Secondary or a Bachelor degree (Level II) and only 12,5% (Level III) a Licentiate degree or more (0,76% a MSc Degree, 0,2% PhDs). These numbers represent, however, a significant improvement from extremely low levels two decades before (89%; 8,4%; 2,5% for Levels I, II and III, respectively) and a reasonable progress from the numbers of a decade ago (76%, 19%, 5%) (see Table 2.7).
This general progress in education levels in Portugal is consistent, and in fact explains, the persistence of a large divide between younger and older workers, as far as educational attainment concerns. For older workers the percentage with at most a basic degree is in 2009 82%, not very far from the national average in 1989. On the other hand, Level I represents for younger workers today “only” 60,6%. The differences between these age groups are also significant for Level II (25% versus 11%) and Level III (13,5% versus 6,5%), and they are expected to persist for some years in the future.
An interesting fact worth mentioning is that the oldest older workers tend to be relatively more educated, confirming that one of the factors sustaining an active ageing is to have a better education. For example, in 2009 the percentage of 65 years old and above with a MSc degree are above the other aged sub-groups, and those with a PhD are even above the younger group.
Y. W. O. W. 55-59 60-64 65+ Y. W. O. W. 55-59 60-64 65+ Y. W. O. W. 55-59 60-64 65+ A - Agriculture 79,62 20,38 10,15 7,64 2,60 80,35 19,65 8,29 7,94 3,42 81,02 18,98 9,99 6,27 2,71 B - Mining 88,26 11,74 6,53 4,09 1,12 88,60 11,40 5,56 4,61 1,24 85,00 15,00 9,13 4,57 1,31 C1 - Food, beverages, tob. 89,02 10,98 5,94 3,64 1,41 89,44 10,56 5,87 3,46 1,23 87,15 12,85 7,76 3,91 1,17 C2 - Textiles 95,70 4,30 2,54 1,33 0,42 95,84 4,16 2,58 1,25 0,33 93,34 6,66 4,75 1,56 0,35 C3 - Wood, cork 92,00 8,00 4,54 2,70 0,75 89,60 10,40 5,43 3,84 1,14 87,97 12,03 7,64 3,48 0,91 C4 - Paper, publishing 91,03 8,97 5,19 2,60 1,18 91,14 8,86 5,37 2,55 0,94 89,46 10,54 6,76 2,91 0,86 C5 - Chemichals 90,08 9,92 6,06 2,95 0,91 90,28 9,72 6,03 2,84 0,85 88,28 11,72 7,64 3,22 0,86 C6 - Non-metallic Mineral Prod. 91,29 8,71 5,22 2,74 0,75 90,70 9,30 5,34 3,10 0,86 87,35 12,65 8,07 3,73 0,85 C7 - Base Metals 90,59 9,41 5,97 2,83 0,61 89,39 10,61 6,90 3,15 0,56 85,54 14,46 9,67 3,92 0,86 C8 - Fab. Metal Prod., Mach., Eq. 92,99 7,01 4,33 2,04 0,64 93,45 6,55 4,14 1,83 0,58 89,42 10,58 6,64 3,10 0,84 C9 - Other manufacturing ind. 91,97 8,03 4,31 2,52 1,19 92,51 7,49 4,08 2,67 0,73 91,07 8,93 6,10 2,48 0,35 D - Electricity, gas, w ater 85,26 14,74 9,01 5,02 0,71 94,37 5,63 4,19 1,18 0,26 86,25 13,75 10,08 3,01 0,66 E - Construction 90,32 9,68 5,58 3,20 0,91 91,52 8,48 4,50 3,10 0,88 89,19 10,81 6,62 3,23 0,97 F - Trade, repair of motor vehicles 89,88 10,12 5,10 3,16 1,87 91,58 8,42 4,43 2,82 1,17 90,40 9,60 5,41 3,07 1,13 G - Restaurants and hotels 92,75 7,25 3,97 2,28 1,00 91,96 8,04 4,62 2,63 0,79 88,79 11,21 6,68 3,54 0,99 H - Transport, storage, comunicat. 88,36 11,64 7,30 3,44 0,90 89,41 10,59 7,29 2,72 0,58 88,46 11,54 7,20 3,44 0,90 I - Financial services 93,18 6,82 4,65 1,78 0,38 92,76 7,24 5,47 1,49 0,29 90,45 9,55 6,45 2,45 0,66 J - Other services 90,38 9,62 4,77 2,93 1,91 91,66 8,34 4,42 2,68 1,24 89,79 10,21 5,80 3,21 1,19
Total 91,19 8,81 4,93 2,77 1,11 91,78 8,22 4,65 2,65 0,93 89,46 10,54 6,30 3,20 1,04
1999 2009
7
Table 2.7: Education level of younger and older workers in Portugal – 2009; 1999; 1989
Fre % Fre % Fre. % Fre. % Fre. % Fre. %
< Basic 26.411 0,94 9.796 2,96 4.992 2,53 3.261 3,25 1.543 4,74 36.207 1,16
Basic 1.658.240 59,27 262.471 79,41 157.698 79,77 80.523 80,31 24.250 74,42 1.920.711 61,40
Secondary 644.524 23,04 29.361 8,88 18.586 9,40 8.000 7,98 2.775 8,52 673.885 21,54
Pos-Secondary 11.622 0,42 965 0,29 510 0,26 289 0,29 166 0,51 12.587 0,40
Bachelor 60.639 2,17 5.354 1,62 3.037 1,54 1.612 1,61 705 2,16 65.993 2,11
Licentiate 348.345 12,45 19.021 5,75 10.843 5,48 5.574 5,56 2.604 7,99 367.366 11,74
MSc 22.390 0,80 1.526 0,46 866 0,44 458 0,46 202 0,62 23.916 0,76
PhD 5.341 0,19 793 0,24 386 0,20 231 0,23 176 0,54 6.134 0,20
Unknow n 20.076 0,72 1.251 0,38 775 0,39 311 0,31 165 0,51 21.327 0,68
Total 2.797.588 100,0 330.538 100,0 197.693 100,0 100.259 100,0 32.586 100,0 3.128.126 100,0
Fre % Fre % Fre. % Fre. % Fre. % Fre. %
< Basic 34.272 1,51 17.437 8,49 6.839 5,88 8.122 12,24 2.476 10,85 51.709 2,09
Basic - 1st 770.585 33,95 127.112 61,88 73.092 62,87 41.167 62,06 12.853 56,32 897.697 36,27
Basic - 2nd 538.125 23,71 19.070 9,28 11.689 10,05 5.486 8,27 1.895 8,30 557.195 22,51
Basic - 3rd 381.413 16,81 20.896 10,17 12.812 11,02 5.596 8,44 2.488 10,90 402.309 16,26
Secondary 407.641 17,96 11.089 5,40 6.660 5,73 2.963 4,47 1.466 6,42 418.730 16,92
Bachelor 25.511 1,12 1.293 0,63 714 0,61 394 0,59 185 0,81 26.804 1,08
Licentiate 60.076 2,65 4.217 2,05 2.214 1,90 1.178 1,78 825 3,61 64.293 2,60
Unknow n 51.876 2,29 4.303 2,09 2.236 1,92 1.433 2,16 634 2,78 56.179 2,27
Total 2.269.499 100,0 205.417 100,0 116.256 100,0 66.339 100,0 22.822 100,0 2.474.916 100,0
Fre % Fre % Fre. % Fre. % Fre. % Fre. %
< Basic 89.781 4,54 40.268 21,06 22.059 20,60 14.335 23,87 3.874 16,09 130.049 5,99
Basic - 1st 990.085 50,04 98.028 51,27 57.075 53,31 29.717 49,49 11.236 46,67 1.088.113 50,15
Basic - 2nd 344.211 17,40 11.554 6,04 6.574 6,14 3.429 5,71 1.551 6,44 355.765 16,40
Basic - 3rd 255.397 12,91 18.079 9,46 9.905 9,25 5.329 8,87 2.845 11,82 273.476 12,60
Secondary 144.250 7,29 5.670 2,97 2.843 2,66 1.704 2,84 1.123 4,66 149.920 6,91
Bachelor 14.857 0,75 1.370 0,72 701 0,65 430 0,72 239 0,99 16.227 0,75
Licentiate 46.709 2,36 6.180 3,23 2.662 2,49 1.898 3,16 1.620 6,73 52.889 2,44
Unknow n 93.357 4,72 10.034 5,25 5.239 4,89 3.209 5,34 1.586 6,59 103.391 4,76
Total 1.978.647 100,0 191.183 100,0 107.058 100,0 60.051 100,0 24.074 100,0 2.169.830 100,0
65 + Total 2009
1999
Younger W. Older W. 55-59 60-64 65 + Total
Younger W. Older W. 55-59 60-64
1989
Younger W. Older W. 55-59 60-64 65 + Total
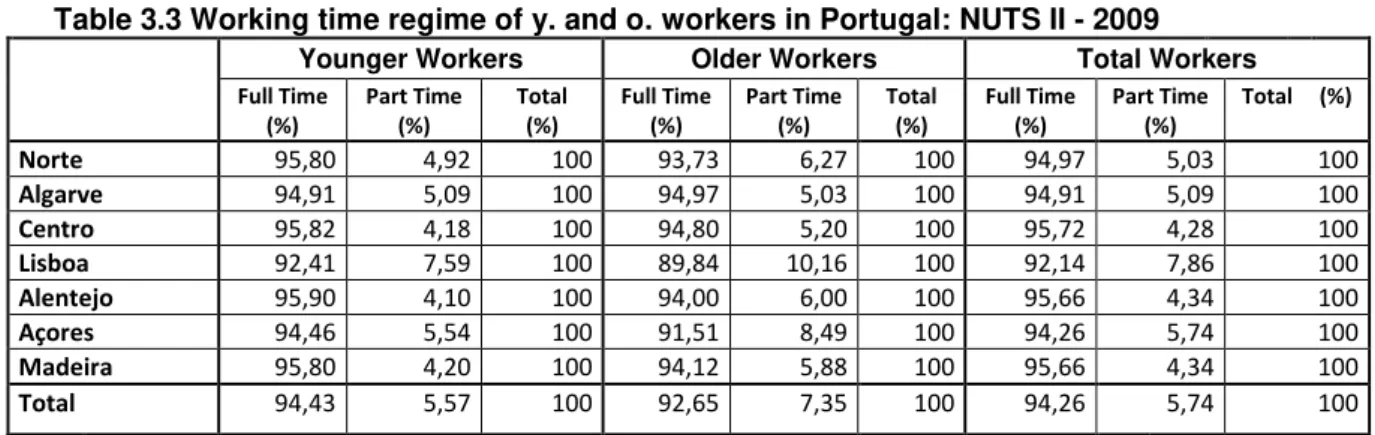
Working time regime
The labour market in Portugal is considered relatively rigid [14], and this assessment is confirmed by the small proportion of workers that use a part time regime: 5,74% in 2009 (see Table 2.8). Although there is a larger proportion of part time older workers (7,3% versus 5,6%), this difference is very small, and only assumes a significant value for the oldest older (14,7%) This is one of the most potential ways of promoting active aging, if appropriate measures are taken. Unfortunately, there are no numbers for this variable in QdP of 1999 and 1989.
Table 2.8: Working time regime of younger and older workers in Portugal - 2009
Younger Workers Older Workers 55-59 60-64 65 + Total
Fre % Fre % Fre. % Fre. % Fre. % Fre. %
8
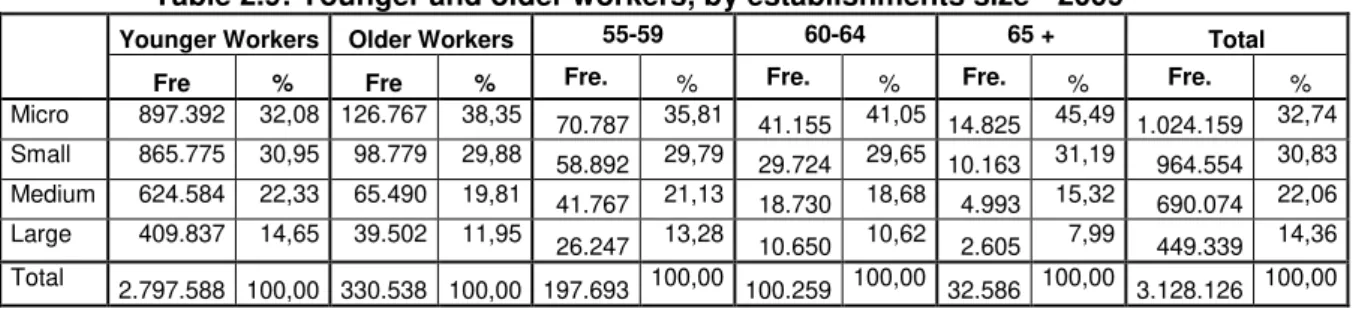
Establishments’ sizeThe Portuguese economy is ever since populated mainly by small and very small firms, and so it is not a surprise that almost two thirds of all workers belong to micro (0-9 workers) and small (10-49) establishments. 22% work in medium size establishments (50-249 workers) and only 14,4% in large ones (250+). These numbers are for 2009 (Table 2.9), and in this year the proportion of older workers in micro-establishments is bigger (38,4%) than that of younger ones (32,1%), and smaller in all the other size classes. This tendency is reinforced with age sub-groups, being significant the proportion of workers 60-64 and 65+ in micro units (41% and 45,6%, respectively). For example, only 8% of workers aged 65+ are in large companies (2.605 in 32.586).
Table 2.9: Younger and older workers, by establishments size - 2009
Younger Workers Older Workers 55-59 60-64 65 + Total
Fre % Fre % Fre. % Fre. % Fre. % Fre. %
Micro 897.392 32,08 126.767 38,35 70.787 35,81 41.155 41,05 14.825 45,49 1.024.159 32,74 Small 865.775 30,95 98.779 29,88 58.892 29,79 29.724 29,65 10.163 31,19 964.554 30,83 Medium 624.584 22,33 65.490 19,81 41.767 21,13 18.730 18,68 4.993 15,32 690.074 22,06 Large 409.837 14,65 39.502 11,95 26.247 13,28 10.650 10,62 2.605 7,99 449.339 14,36 Total 2.797.588 100,00 330.538 100,00 197.693 100,00 100.259 100,00 32.586 100,00 3.128.126 100,00
An interesting empirical fact related to the average size evolution of the Portuguese firms is that in 1989 and 1999 the proportion of workers in micro establishments is smaller than in 2009 (20,2% and 29,8%). This trend is associated with the strong tertiarization (and de-industrialization) of the Portuguese economy, previously mentioned, and it is a matter of serious concern affecting both younger and older workers. As a matter of fact, two decades ago more than 20% of workers were in large establishments, significantly more than today, almost the double in the older workers case.
Average labour compensation.
Considering the 3.128.126 workers registered in Quadros de Pessoal, the average monthly
remuneration in Portugal was €929,4 in 2009, €624,6 in 1999 and 259,2 in 1989, all in current prices (see Table 2.10). We calculate the labour remunerations summing the base salary, subsidies, bonuses and overtime pay.
Table 2.10: Average Monthly Remuneration by Age Group
Younger Workers Older Workers Total Value % Value % Value %
1989
258,765 99,82 264,132 101,89 259,238 100,001999
624,193 99,93 629,310 100,75 624,613 100,002009
927,877 99,83 942,435 101,40 929,415 100,00The average labour compensation of older workers in 2009 is €942,4, slightly higher (1,6%) than the €927,9 of the younger workers, meaning that the tenure effect is more important than the education effect, on average. The hourly average payment of older workers is much higher
(16,5%, €7,7 versus €6,6) as older people work less on average (see Table 2.11). These relative wage advantages of older workers were also a fact in 1989 and 1999.
9
Younger Workers Older Workers Total Value % Value % Value %
1989
1,752 98,11 2,134 119,53 1,786 100,001999
4,512 5,40 5,404 117,86 4,585 100,002009
6,631 98,28 7,728 114,54 6,747 100,003. THE REGIONAL DIFFERENCES IN THE WORKFORCE
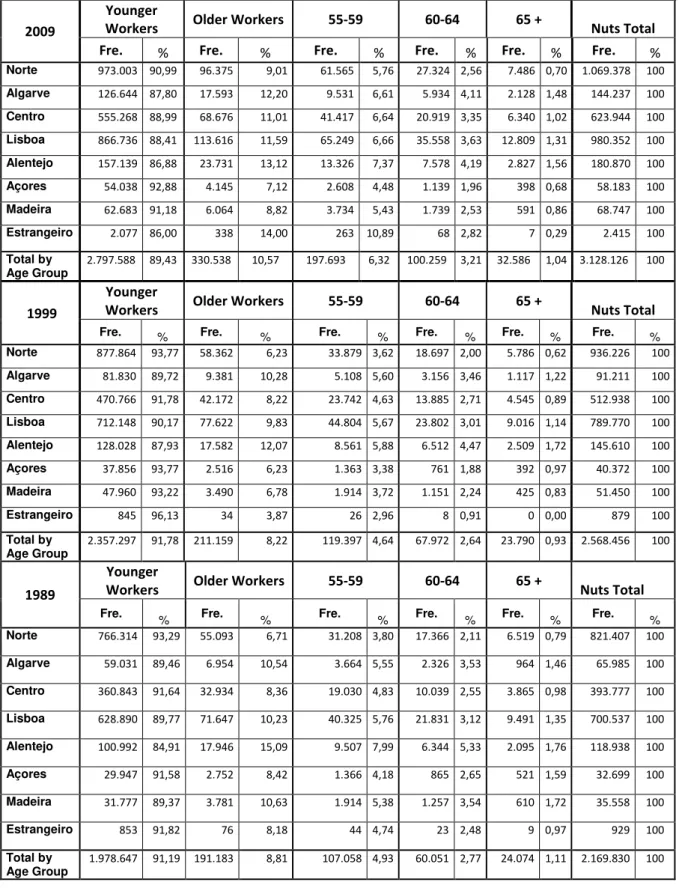
3.1. Norte Region
The Norte region is the one with more workers: 34,19% of all workers are there, in 2009. In 2009, it has still one of the youngest age structure of labour force, only after the islands: the older workers account for 9% of all workers, whereas the Portuguese average is 10,6%. However, 20 years before, it had the youngest age structure of all (Table 3.1). Tâmega, the NUTS III region with the youngest labour force structure is here. Of the NUTS III regions that belong to the Norte region, only Alto Trás-os-Montes has a slightly older age structure than the Portuguese average.
The rise in the level of education – although with a very low starting point - is quite visible in this region through the two decades considered: the proportion of workers with basic education at most has changed from 92,8% to 82,8% and then to 69,4% (Table 3.2). The proportion of workers with high education went from 1,57% to 3,7% and then to 10,53%. The education level of workers is significantly below the level of the Lisbon region. The Tâmega NUTSIII region, in particular, is the Portuguese region with the lowest levels of education: it has the smallest proportion of workers with Level III education and the largest proportion of workers with Level I education. In the Norte region, the NUTSIII region with the highest levels of education is Grande Porto. This is the sole Nuts III region in the Norte region that has better education levels than the national average.
The average education levels of the younger workers – 67,81% present Level I education, in 2009 - is considerably higher than that of the older workers – 85,18 have Level I education in 2009 (Table 3.2). In 1989, the situation was completely different: 92,68% of the younger workers had Level I education, comparing with 94,21% for older workers. Conversely, the percentage of workers with Level III education was slightly higher for older workers – 2,54% - than for younger workers – 1,5% - in 1989. The numbers were very similar for both groups in 1999: 3,45% against 3,72%, and finally in 2009 the difference was clearly favoring the younger workers: 5,47% for older workers compared with 11,04% for younger workers.
The sectors where the proportion of older workers in Norte region is above the national average in 2009, are Textiles, Wood and Cork, Paper and Publishing, Base Metal Industries, Metal Products, Machinery and Equipments, and Construction. In 1989, the labour force employed in Construction was younger than the national average, but that changed. Conversely, Electricity, Gas and Water was older in relative terms, and became younger.
Although part time work is not very expressive in Portugal, in 2009, Grande Porto exhibits the second highest proportion of workers in this regime, only after Grande Lisboa (Table 3.4).
10
Portugal in 1989 and in 1999 – respectively, 60% and 65% of the national average of hourly remunerations, 63% of the monthly remunerations in both years,– but Alto Trás-os-Montes had the 3rd highest average labour compensations of the Norte region – 85,27% of the national
average monthly remunerations, in 1989. In 1999, the remunerations of Alto Trás-os-Montes had already decreased a lot, in relative terms.
3.2. Algarve Region
Algarve is the smallest NUTSII region in continental Portugal. It has the second oldest labour force – 12,2% of its workers are 55 or older, whereas the Portuguese average is 10,57%, in 2009 (Table 3.1). This is due mainly to the larger proportions of workers above 60 years old and not so much to the proportion of workers between 55 and 60 years old. The relative position of the region in terms of the age composition of its labour force remained almost the same throughout the period under analysis, except that in 1989 Madeira had an even older labour force.
In 1989, the level of education of the Algarve labour force was the second highest in Portugal, after Lisboa, due particularly to the education of the younger workers. However, that changed. Specifically, the proportion of workers with higher education grew much more in other regions like Norte and Centro, than in Algarve (Table 3.2).
Hotels and Restaurants is undoubtedly the most important industry in this region (Table 3.3). More than 20% of Algarve older workers are employed there, and the proportion of older workers (compared to younger workers) in this industry went from 8,4% in 1989, to 9,7% in 1999, and to 13,5% in 2009. Trade and Construction represent two industries that employ large proportions of Algarve older workers: 17,26% and 15,72%, respectively, in 2009 (Table 3.3). In Algarve, in 1989, the proportion of workers in Construction that was 55+ was 12,74%, and in Trade was 8,92%. That was not much different in 2009: 13,10% and 9,42%. The group of Other Services has also some importance in Algarve, due to the inclusion of Real Estate and Rental, here. In 2009, the only NUTS III region with more workers in the Real Estate and Rental industry is Grande Lisboa. In 1989, Grande Porto had many more workers in this industry: 15,6% compared to 5,6% of Algarve. If one focuses only on older workers, Grande Porto still has more workers than Algarve in this activity area, in 2009, although only slightly more.
Only 5% of older workers in Algarve work part time, which is about the same as the value for younger workers (Table 3.4).
The average remuneration in Algarve is 88,92% of the Portuguese average, and the situation is worsened for older workers: their average remuneration is 80,49% of the Portuguese level (Table 3.5). The situation seems a bit improved when hourly remunerations are considered: they are 90,5% of the Portuguese average for total workers and 81,42% for older workers, respectively, but in truth, now older workers in this NUTS II region appear as the worst paid in Portugal. Of course, if it is seen as a NUTS III region, there are many other regions that exhibit lower hourly remunerations of their older workers.
Centro Region
11
The sectors that have a larger representation of older workers in Centro than the national average are: Non-metallic Mineral Products, Metal Products, Machinery and Equipments, Base Metal Industries, Chemicals, Trade, Agriculture and Mining, in 2009 (Table 3.3). More than half of the workers in the production of Non-metallic Mineral Products in Portugal are located in Centro. This is true for both younger and older workers. 32% of older workers in Portugal and 29% of all workers that are in Base Metal industries are in Centro. 31 and 32 percent of older and of total workers in Mining are here.
The education levels of workers in Centro are lower than the Portuguese average (Table 3.2) This is true for the older workers and the younger workers as well. Baixo Mondego, the Nuts III region where Coimbra is located, is the exception. Nevertheless, the education levels of workers, especially of younger workers, has risen significantly, since 1989. For example, the proportion of younger workers with higher education in Baixo Vouga was 1,53% in 1989, and 12,10% in 2009. In Dão Lafões, it was 1,14% in 1989 and 12,19% in 2009. Such improvement is not seen the same way for older workers.
In Centro, the proportion of older workers working part time is slightly above the percentage of younger workers working part time, although both under the already low national average (Table 3.4). Baixo Mondego is the Nuts III region where the use of part time schedules is above the national level, particularly for the older workers. In Beira Interior Sul, that is true only for the younger workers.
Centro is the region where older workers are paid less. Based on monthly remunerations, younger workers earn more, on average, than older workers, but the opposite happens when we hourly remunerations are used (Table 3.6). If we consider hourly remuneration, then Centro’s older workers are still not as badly paid as Algarve’s older workers. When all workers are taken together, Centro is the second region with the lowest hourly remuneration. The lowest average remunerations in Portugal are seen in Pinhal Interior Sul: they account for only 69,5% of the Portuguese average, for younger workers, and 61,28% of the Portuguese average, for older workers. This was totally different in 1989: younger workers here earned 81,28% of the Portuguese average, and older workers earned 94,92%! In 1999, the situation was already approaching that of 2009. Using hourly remunerations, the workers in Pinhal Interior Norte are the worst paid, because of younger workers (Table 3.5).
Lisboa Region
Lisboa is the second region in the number of workers, only after Norte (see Table 3.1). It is by far the region with more older workers, whatever the year we look at, of the three we consider. In 2009, 34,37% of older workers in Portuguese firms, and 39,31% of the workers 65+ work in the Lisboa region.
Lisboa NUTS II region has only two NUTS III regions, and they are very different. The dimension of the workforce in Grande Lisboa is almost five times that of Península de Setúbal. Although both have larger proportions of older workers than the national average, Península de Setúbal is older. In 1989, it was the other way round.
12
The industries that provide more jobs for older workers in Lisboa region are Financial Services, Other Manufacture Industries, Transport Services, Other Services (that include Real Estate and Renting). Some industries reduced the proportion of older workers, since 1989: Construction, Metal Products, Machinery and Equipment, Base Metal Industries, Non Metallic Minerals, Chemicals, Wood and Cork, and Mining (Table 3.3).
Lisboa is the region where there are more workers in part time regime: 7,59% of the younger workers and 10,16% of older workers (Table 3.4). This is particularly so in Grande Lisboa, because in Penísnsula de Setúbal the proportion of part time workers is lower, especially for older workers.
Lisboa region is where workers earn higher remunerations, on average, in Portugal (Table 3.5). This is similar for older and younger workers, but older workers earn, on average, slightly higher monthly remunerations than the younger. The inverse was true in 1989 and in 1999. In terms of hourly remunerations, the older workers earn substantially more in all the periods (Table 3.6). If we take only the Península de Setúbal region, remunerations are lower, and older workers earn less, on average, than younger workers. The difference in remunerations between the two NUTS III regions has grown considerably, since 1989.
Alentejo Region
Alentejo is the region with the largest proportion of older workers (Table 3.1). All NUTS III regions, in Alentejo, have more than 12,5% of older workers, when the Portuguese average is 10,57%, and the youngest regions have less than 8%. The NUTS III region with more older workers in Portugal – 14,38% - is Alentejo Litoral, followed by Alto Alentejo – 13,63% - and by Alentejo Central – 13,26%. Except in Alentejo Litoral, the proportion of older workers was even higher in these regions, in 1989.
Between 36% and 39% of older workers working in Agriculture have been in Alentejo. Mining and Food, Beverages and Tobacco are the other main industries (Table 3.3).
The education level of older workers is the lowest in Portugal (Table 3.2): only 3,78% have a level III education and 88,41% have a level I education.
95,9% of younger workers and 94% of older workers work full time, in Alentejo (Table 3.4).
Although the hourly remunerations of workers in Alentejo are below the national average, the older workers are more penalized in comparison to those of their age in the other regions (Table 3.5). However, this difference used to be larger and diminished since 1989.
Açores Region
Açores is the smallest and youngest NUTS II region in Portugal, in what workers are concerned (Table 3.1). Together with Tâmega, in the Norte region, it is also the youngest NUTS III region: in 2009, only 7,12% are older workers, compared to the national average of 10,57%. 2,64 is the percentage of workers 60+. In 1989, there was a larger proportion of workers 60+ - 4,24% -, but in 1999, that had already diminished - 2,86%.
13
The proportion of older workers in the region that work part time is 8,49%, higher than the Portuguese level, and the percentage of younger workers is 5,54%, similar to the Portuguese average (Table 3.4).
Most older workers work in Trade, in Construction and in Transports and Communications (Table 3.3). The important position of the Manufacture of Food Products, Beverages and Tobacco in 1989, has considerably receded. It passed from the employment of 20,49% of the Açores older workers to 14,47% in 1999, and to 8,83 in 2009. This accompanied the reduction of total workers in this industry, in Açores.
Despite under the Portuguese average, Açores is the third NUTS II region where workers earn more, although not in hourly terms (Table 3.5). In 2009, older workers receive higher monthly remunerations than younger workers, which did not happen in 1989 or in 1999. Older workers earned always more per hour than younger workers, during the period under analysis.
Madeira Region
Madeira is the second smallest NUTS II region in Portugal, and the second youngest, in what workers are concerned (Table 3.1). The proportion of younger workers increased in Madeira, since 1989: it was 89,37% and it is 91,18%, in 2009. It is the NUTS III region with the sixth higher proportion of younger workers.
The average education level of the workers in Madeira is under the national average (Table 3.2). However, the education level of older workers is one of the highest in Portugal. It is still under the national average, because this value is much influenced by the numbers of the regions with the three largest cities.
The proportions of workers in part time is under the national average, for younger and older workers (Table 3.4).
The most important industries are Hotels and Restaurants and Trade (Table 3.3). The workforce of Hotels and Restaurants, in particular, aged considerably since 1989. Then, it occupied 12,75% of older workers and 18,37% of total workers. In 2009, it employs 19,01% of older workers and 17,6% of total workers.
Average remunerations in Madeira are some of the highest in Portugal: as a NUTS II region, its remunerations are only behind Lisboa region (Table 3.5); as a NUTS III region, its remunerations are only behind Grande Lisboa, Alentejo Litoral and Grande Porto. In 1989, the main differences were that the average monthly remunerations in Madeira were lower than those in Península de Setúbal and in Algarve, and higher than those in Grande Porto. In 1999, the average monthly remuneration in Grande Porto had already caught Madeira’s. During the
14
Table 3.1: Age Structure of Workers by Nuts II
2009
Younger
Workers Older Workers 55-59 60-64 65 + Nuts Total
Fre. % Fre. % Fre. % Fre. % Fre. % Fre. %
Norte 973.003 90,99 96.375 9,01 61.565 5,76 27.324 2,56 7.486 0,70 1.069.378 100
Algarve 126.644 87,80 17.593 12,20 9.531 6,61 5.934 4,11 2.128 1,48 144.237 100
Centro 555.268 88,99 68.676 11,01 41.417 6,64 20.919 3,35 6.340 1,02 623.944 100
Lisboa 866.736 88,41 113.616 11,59 65.249 6,66 35.558 3,63 12.809 1,31 980.352 100
Alentejo 157.139 86,88 23.731 13,12 13.326 7,37 7.578 4,19 2.827 1,56 180.870 100
Açores 54.038 92,88 4.145 7,12 2.608 4,48 1.139 1,96 398 0,68 58.183 100
Madeira 62.683 91,18 6.064 8,82 3.734 5,43 1.739 2,53 591 0,86 68.747 100
Estrangeiro 2.077 86,00 338 14,00 263 10,89 68 2,82 7 0,29 2.415 100
Total by Age Group
2.797.588 89,43 330.538 10,57 197.693 6,32 100.259 3,21 32.586 1,04 3.128.126 100
1999
Younger
Workers Older Workers 55-59 60-64 65 + Nuts Total
Fre. % Fre. % Fre. % Fre. % Fre. % Fre. % Norte 877.864 93,77 58.362 6,23 33.879 3,62 18.697 2,00 5.786 0,62 936.226 100
Algarve 81.830 89,72 9.381 10,28 5.108 5,60 3.156 3,46 1.117 1,22 91.211 100
Centro 470.766 91,78 42.172 8,22 23.742 4,63 13.885 2,71 4.545 0,89 512.938 100
Lisboa 712.148 90,17 77.622 9,83 44.804 5,67 23.802 3,01 9.016 1,14 789.770 100
Alentejo 128.028 87,93 17.582 12,07 8.561 5,88 6.512 4,47 2.509 1,72 145.610 100
Açores 37.856 93,77 2.516 6,23 1.363 3,38 761 1,88 392 0,97 40.372 100
Madeira 47.960 93,22 3.490 6,78 1.914 3,72 1.151 2,24 425 0,83 51.450 100
Estrangeiro 845 96,13 34 3,87 26 2,96 8 0,91 0 0,00 879 100
Total by Age Group
2.357.297 91,78 211.159 8,22 119.397 4,64 67.972 2,64 23.790 0,93 2.568.456 100
1989
Younger
Workers Older Workers 55-59 60-64 65 + Nuts Total
Fre. % Fre. % Fre. % Fre. % Fre. % Fre. % Norte 766.314 93,29 55.093 6,71 31.208 3,80 17.366 2,11 6.519 0,79 821.407 100
Algarve 59.031 89,46 6.954 10,54 3.664 5,55 2.326 3,53 964 1,46 65.985 100
Centro 360.843 91,64 32.934 8,36 19.030 4,83 10.039 2,55 3.865 0,98 393.777 100
Lisboa 628.890 89,77 71.647 10,23 40.325 5,76 21.831 3,12 9.491 1,35 700.537 100
Alentejo 100.992 84,91 17.946 15,09 9.507 7,99 6.344 5,33 2.095 1,76 118.938 100
Açores 29.947 91,58 2.752 8,42 1.366 4,18 865 2,65 521 1,59 32.699 100
Madeira 31.777 89,37 3.781 10,63 1.914 5,38 1.257 3,54 610 1,72 35.558 100
Estrangeiro 853 91,82 76 8,18 44 4,74 23 2,48 9 0,97 929 100
Total by Age Group
15
Table 3.2 Education levels by Region NUTS II
2009
Younger Workers Older Workers Total Workers
Level I (%) Level II (%) Level III (%) Total (%) Level I (%) Level II (%) Level III (%) Total (%) Level I (%) Level II (%) Level III (%) Total (%) Norte 67,81 21,15 11,04 100 85,18 9,35 5,47 100 69,38 20,09 10,53 100
Algarve 62,24 28,01 9,75 100 84,63 11,16 4,22 100 65,00 25,93 9,07 100
Centro 64,65 24,12 11,23 100 88,08 8,01 3,91 100 67,24 22,34 10,42 100
Lisboa 47,94 32,34 19,72 100 75,66 14,46 9,88 100 51,17 30,26 18,58 100
Alentejo 65,03 25,34 9,62 100 88,41 7,81 3,78 100 68,11 23,03 8,85 100
Açores 71,16 19,86 8,98 100 84,42 9,86 5,72 100 72,11 19,14 8,75 100
Madeira 65,06 25,80 9,14 100 83,77 10,67 5,56 100 66,71 24,47 8,82 100
Total 60,64 25,82 13,54 100 82,68 10,84 6,48 100 62,98 24,23 12,79 100
1999
Younger Workers Older Workers Total Workers
Level I (%) Level II (%) Level III (%) Total (%) Level I (%) Level II (%) Level III (%) Total (%) Level I (%) Level II (%) Level III (%) Total (%)
Norte 82,28 14,00 3,72 100 91,01 5,54 3,45 100 82,83 13,47 3,70 100
Algarve 74,67 21,93 3,40 100 92,08 5,38 2,53 100 76,48 20,21 3,31 100
Centro 79,22 16,31 4,48 100 92,67 4,07 3,26 100 80,33 15,29 4,38 100
Lisboa 64,77 27,79 7,45 100 85,97 8,27 5,77 100 66,90 25,82 7,28 100
Alentejo 78,39 17,40 4,21
100 94,10 2,99 2,92 100 80,31 15,64 4,05 100
Açores 80,38 15,64 3,98
100 89,34 6,09 4,58 100 80,94 15,05 4,02 100
Madeira 80,07 18,58 1,35
100 91,86 6,47 1,67 100 80,87 17,76 1,37 100
Total 75,98 19,09 4,93 100 89,82 6,03 4,15 100 77,13 18,00 4,87 100
1989
Younger Workers Older Workers Total Workers
Level I (%) Level II (%) Level III (%) Total (%) Level I (%) Level II (%) Level III (%) Total (%) Level I (%) Level II (%) Level III (%) Total (%)
Norte 92,68 5,82 1,50
100 94,21 3,25 2,54 100 92,78 5,65 1,57 100
Algarve 87,63 10,74 1,63
100 95,68 2,80 1,52 100 88,48 9,90 1,62 100
Centro 92,22 6,40 1,38
100 95,29 2,55 2,16 100 92,48 6,07 1,45 100
Lisboa 82,47 12,87 4,65
100 88,80 5,69 5,51 100 83,12 12,14 4,74 100
Alentejo 91,69 6,92 1,39
100 97,26 1,54 1,20 100 92,53 6,11 1,36 100
Açores 89,99 8,68 1,32
100 48,65 50,05 1,30 100 90,23 8,35 1,42 100
Madeira 90,33 8,16 1,50
100 56,28 42,59 1,12 100 90,83 7,63 1,54 100
Total 89,09 8,44 2,47 100 90,35 6,33 3,32 100 89,40 8,04 2,56 100
Table 3.3 Working time regime of y. and o. workers in Portugal: NUTS II - 2009
Younger Workers Older Workers Total Workers Full Time (%) Part Time (%) Total (%) Full Time (%) Part Time (%) Total (%) Full Time (%) Part Time (%)
Total (%)
Norte 95,80 4,92 100 93,73 6,27 100 94,97 5,03 100
Algarve 94,91 5,09 100 94,97 5,03 100 94,91 5,09 100
Centro 95,82 4,18 100 94,80 5,20 100 95,72 4,28 100
Lisboa 92,41 7,59 100 89,84 10,16 100 92,14 7,86 100
Alentejo 95,90 4,10 100 94,00 6,00 100 95,66 4,34 100
Açores 94,46 5,54 100 91,51 8,49 100 94,26 5,74 100
Madeira 95,80 4,20 100 94,12 5,88 100 95,66 4,34 100
16
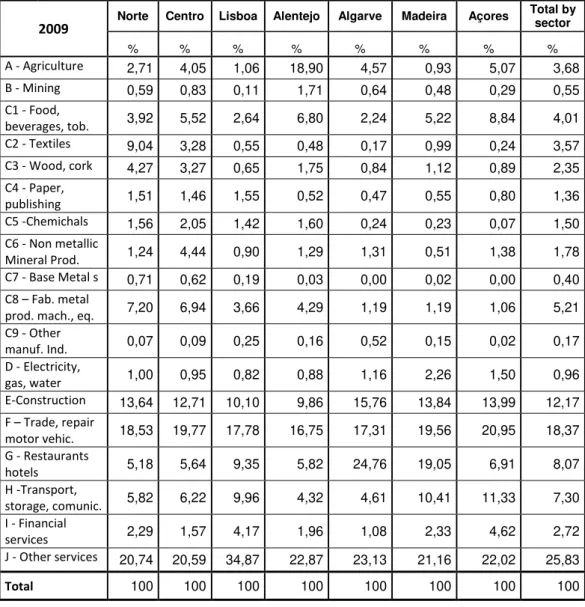
Table 3.4: Industries’ Older Workers by region
2009 Norte Centro Lisboa Alentejo Algarve Madeira Açores
Total by sector
% % % % % % % %
A - Agriculture 2,71 4,05 1,06 18,90 4,57 0,93 5,07 3,68
B - Mining 0,59 0,83 0,11 1,71 0,64 0,48 0,29 0,55
C1 - Food,
beverages, tob. 3,92 5,52 2,64 6,80 2,24 5,22 8,84 4,01
C2 - Textiles 9,04 3,28 0,55 0,48 0,17 0,99 0,24 3,57
C3 - Wood, cork 4,27 3,27 0,65 1,75 0,84 1,12 0,89 2,35
C4 - Paper,
publishing 1,51 1,46 1,55 0,52 0,47 0,55 0,80 1,36
C5 -Chemichals 1,56 2,05 1,42 1,60 0,24 0,23 0,07 1,50
C6 - Non metallic
Mineral Prod. 1,24 4,44 0,90 1,29 1,31 0,51 1,38 1,78
C7 - Base Metal s 0,71 0,62 0,19 0,03 0,00 0,02 0,00 0,40
C8 – Fab. metal
prod. mach., eq. 7,20 6,94 3,66 4,29 1,19 1,19 1,06 5,21
C9 - Other
manuf. Ind. 0,07 0,09 0,25 0,16 0,52 0,15 0,02 0,17
D - Electricity,
gas, water 1,00 0,95 0,82 0,88 1,16 2,26 1,50 0,96
E-Construction 13,64 12,71 10,10 9,86 15,76 13,84 13,99 12,17
F – Trade, repair
motor vehic. 18,53 19,77 17,78 16,75 17,31 19,56 20,95 18,37
G - Restaurants
hotels 5,18 5,64 9,35 5,82 24,76 19,05 6,91 8,07
H -Transport,
storage, comunic. 5,82 6,22 9,96 4,32 4,61 10,41 11,33 7,30
I - Financial
services 2,29 1,57 4,17 1,96 1,08 2,33 4,62 2,72
J - Other services 20,74 20,59 34,87 22,87 23,13 21,16 22,02 25,83
17
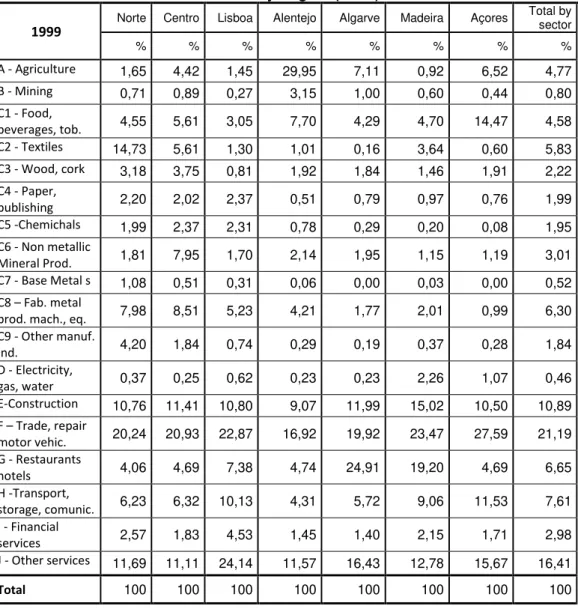
Table 3.4: Industries’ Older Workers by Region (cont.)
1999
Norte Centro Lisboa Alentejo Algarve Madeira Açores Total by sector
% % % % % % % %
A - Agriculture 1,65 4,42 1,45 29,95 7,11 0,92 6,52 4,77
B - Mining 0,71 0,89 0,27 3,15 1,00 0,60 0,44 0,80
C1 - Food,
beverages, tob. 4,55 5,61 3,05 7,70 4,29 4,70 14,47 4,58
C2 - Textiles 14,73 5,61 1,30 1,01 0,16 3,64 0,60 5,83
C3 - Wood, cork 3,18 3,75 0,81 1,92 1,84 1,46 1,91 2,22
C4 - Paper,
publishing 2,20 2,02 2,37 0,51 0,79 0,97 0,76 1,99
C5 -Chemichals 1,99 2,37 2,31 0,78 0,29 0,20 0,08 1,95
C6 - Non metallic
Mineral Prod. 1,81 7,95 1,70 2,14 1,95 1,15 1,19 3,01
C7 - Base Metal s 1,08 0,51 0,31 0,06 0,00 0,03 0,00 0,52
C8 – Fab. metal
prod. mach., eq. 7,98 8,51 5,23 4,21 1,77 2,01 0,99 6,30
C9 - Other manuf.
Ind. 4,20 1,84 0,74 0,29 0,19 0,37 0,28 1,84
D - Electricity,
gas, water 0,37 0,25 0,62 0,23 0,23 2,26 1,07 0,46
E-Construction 10,76 11,41 10,80 9,07 11,99 15,02 10,50 10,89
F – Trade, repair
motor vehic. 20,24 20,93 22,87 16,92 19,92 23,47 27,59 21,19
G - Restaurants
hotels 4,06 4,69 7,38 4,74 24,91 19,20 4,69 6,65
H -Transport,
storage, comunic. 6,23 6,32 10,13 4,31 5,72 9,06 11,53 7,61
I - Financial
services 2,57 1,83 4,53 1,45 1,40 2,15 1,71 2,98
J - Other services 11,69 11,11 24,14 11,57 16,43 12,78 15,67 16,41
18
Table 3.4: Industries’ Older Workers by Region (cont.)
1989 Norte Centro Lisboa Alentejo Algarve Madeira Açores
Total by sector
% % % % % % % %
A - Agriculture 1,27 5,43 1,44 38,86 9,53 1,53 7,38 5,97
B - Mining 0,62 1,09 0,45 4,06 1,16 0,66 0,22 0,97
C1 - Food,
beverages, tob. 5,81 6,93 4,32 8,25 6,50 8,36 20,49 5,96
C2 - Textiles 19,62 8,28 2,05 0,91 0,13 9,79 0,55 8,15
C3 - Wood, cork 5,42 5,46 1,78 2,74 2,93 1,64 2,18 3,60
C4 - Paper,
publishing 2,32 3,59 2,52 0,49 0,50 1,22 1,20 2,34
C5 -Chemichals 3,09 2,95 4,92 1,44 0,59 0,63 1,24 3,43
C6 - Non metallic
Mineral Prod. 1,52 7,92 2,45 1,78 2,80 1,16 1,38 3,03
C7 - Base Metal s 1,46 1,35 1,06 0,11 0,03 0,00 0,00 1,06
C8 – Fab. metal
prod. mach., eq. 8,33 8,87 7,60 2,33 1,70 1,40 1,05 7,10
C9 - Other manuf.
Ind. 1,13 0,19 0,33 0,02 0,09 0,00 0,18 0,49
D - Electricity, gas,
water 2,69 2,39 1,58 1,18 1,25 2,38 1,82 2,01
E-Construction 8,34 8,35 10,94 6,94 16,90 13,49 8,21 9,60
F – Trade, repair
motor vehic. 17,70 16,06 21,40 13,31 16,74 24,01 23,07 18,56
G - Restaurants
hotels 2,39 2,58 4,70 2,52 20,22 12,75 2,98 4,16
H –Transp. storage,
comunic. 7,75 8,81 11,16 6,12 7,82 7,11 13,37 9,13
I - Financial services 2,34 1,92 4,35 1,44 1,91 1,88 2,83 2,92
J - Other services 8,19 7,83 16,96 7,51 9,19 11,95 11,85 11,52
Total 100 100 100 100 100 100 100 100
19
Table 3.5: Regional relative position of labour remunerations of age groups, NUTS II and NUTS III
1989 1999
Younger Workers Older Workers Total by Nuts III Younger Workers Older Workers Total by Nuts III % % % % % %
NORTE 82,46
(84,85) 92,94 (89,01) 82,93 (85,10) 83,96 (83,91) 90,67 (86,44) 84,13 (84,05)
Minho Lima 80,59 87,70 80,98 76,47 82,35 76,50
Cávado 69,79 83,68 69,90 74,80 80,29 74,56
Ave 70,98 77,92 70,76 72,18 80,77 72,17
Grande Porto 97,45 104,39 98,05 101,20 106,01 101,53
Tâmega 60,58 69,51 60,47 65,55 63,17 64,92
Entre Douro e Vouga 70,60 69,24 70,06 79,11 76,27 78,70
Douro 86,84 88,33 87,04 77,27 75,47 77,07
Alto Trás-os-Montes 84,84 85,89 85,04 75,89 72,73 75,51 ALGARVE/ Algarve 105,37
(103,70) 85,26 (90,99) 103,23 (102,38) 94,16 (93,95) 79,89 (81,66) 92,81 (92,69)
CENTRO 85,62
(88,53) 85,01 (87,96) 85,47 (88,48) 85,35 (85,63) 81,63 (81,41) 84,99 (85,28)
Baixo Vouga 87,74 87,69 87,52 87,64 84,72 87,30
Baixo Mondego 95,37 93,22 95,33 94,52 90,56 94,18 Pinhal Litoral 87,61 83,44 86,87 92,69 92,62 92,60 Pinhal Interior Norte 72,86 74,19 72,59 71,50 66,14 70,89
Dão Lafões 75,88 78,44 75,85 79,51 72,31 78,78
Pinhal Interior Sul 83,21 98,07 84,84 74,14 63,36 73,12 Serra da Estrela 74,77 79,27 74,85 70,13 86,32 71,65 Beira Interior Norte 85,29 82,28 84,93 75,43 75,22 75,32 Beira Interior Sul 86,60 73,43 85,26 78,93 71,01 78,26 Cova da Beira 70,92 75,84 71,13 73,43 75,26 73,47
Oeste 85,41 81,22 84,89 84,91 76,75 84,14
Médio Tejo 89,22 88,09 89,65 85,92 81,78 85,72
LISBOA 130,80
(125,90) 122,39 (121,20) 130,17 (125,45) 132,21 (132,11) 124,99 (125,57) 131,79 (131,68) Grande Lisboa 135,55 127,03 134,95 137,75 131,03 137,42 Península de Setúbal 106,26 95,46 105,17 104,10 90,96 102,88
ALENTEJO 89,96
(91,64) 68,72 (77,44) 87,34 (89,58) 90,85 (90,35) 73,29 (78,36) 89,04 (88,92) Alentejo Litoral 111,57 81,37 107,79 106,23 80,67 103,41 Alto Alentejo 86,08 66,37 83,63 85,40 71,03 83,00 Alentejo Central 90,25 66,27 86,93 85,51 69,82 83,88 Baixo Alentejo 86,49 61,75 83,03 90,34 66,06 87,53 Lezíria do Tejo 84,95 72,52 83,76 92,34 78,27 91,01 AÇORES/ Açores 109,14
(101,87) 95,08 (83,67) 107,63 (100,30) 86,89 (91,43) 87,21 (86,54) 86,58 (91,11) MADEIRA/ Madeira 94,35
(100,42) 86,46 (99,25) 93,71 (100,33) 94,75 (100,03) 97,78 (104,66) 94,73 (100,34) Estrangeiro 121,60 145,35 123,76 163,58 183,42 163,10
20
Table 3.5: Regional relative position of labour remunerations of age groups, NUTS II and NUTS III (cont.)
2009 Younger Workers Older Workers Total by Nuts III % % %
NORTE 86,76
(85,78)
89,43 (88,33)
86,82 (85,99)
Minho Lima 82,96 78,21 82,22
Cávado 83,12 80,54 82,50
Ave 76,88 82,96 76,99
Grande Porto 100,38 104,46 100,83
Tâmega 72,03 68,36 71,32
Entre Douro e Vouga 82,93 83,06 82,89
Douro 81,14 72,74 80,10
Alto Trás-os-Montes 76,33 68,03 75,33 ALGARVE/ Algarve 91,69
(90,09)
81,42 (80,49)
90,50 (88,92)
CENTRO 88,60
(88,51)
81,92 (80,18)
87,82 (87,59)
Baixo Vouga 90,52 84,79 89,83
Baixo Mondego 95,37 92,87 95,12 Pinhal Litoral 96,39 85,48 95,06 Pinhal Interior Norte 74,07 65,03 72,98
Dão Lafões 87,63 72,84 85,85
Pinhal Interior Sul 74,48 63,06 73,08 Serra da Estrela 74,66 92,41 77,45 Beira Interior Norte 77,81 77,51 77,82 Beira Interior Sul 78,71 74,74 78,38 Cova da Beira 75,54 72,29 75,24
Oeste 86,84 82,62 86,43
Médio Tejo 89,13 81,25 88,26
LISBOA 125,38
(126,85)
124,42 (127,16)
125,46 (126,90) Grande Lisboa 130,01 130,09 130,22 Península de Setúbal 101,19 95,50 100,65
ALENTEJO 90,12
(90,05)
84,50 (84,95)
89,65 (89,40) Alentejo Litoral 100,25 101,46 101,07 Alto Alentejo 84,41 78,39 83,89 Alentejo Central 87,63 89,83 88,35 Baixo Alentejo 91,55 74,99 89,46 Lezíria do Tejo 89,37 79,93 88,30 AÇORES/ Açores 88,60
(90,89)
101,04 (99,74)
89,12 (90,74) MADEIRA/ Madeira 97,00
(98,27)
102,19 (102,66)
97,25 (98,64) Estrangeiro 224,41 254,10 230,42
Total by Age Group 100 100 100
Note: The values express the proportions of hourly remunerations, except those that are in
21
Table 3.6: Comparison of labour remunerations of age groups, by Region NUTS II and NUTS III
1989 1999
Total by Nuts III
Older
Workers Total by Nuts III Younger Workers Older Workers Total by Nuts III % % % % % % NORTE 100 133,95
(106,57) 100
98,20 (99,76)
127,03
(103,62) 100
Minho Lima 100 129,44 100 98,37 126,86 100
Cávado 100 143,09 100 98,71 126,91 100
Ave 100 131,62 100 98,41 131,90 100
Grande Porto 100 127,26 100 98,08 123,06 100
Tâmega 100 137,38 100 99,36 114,68 100
Entre Douro e Vouga 100 118,13 100 98,92 114,21 100
Douro 100 121,30 100 98,66 115,42 100
Alto Trás-os-Montes 100 120,72 100 98,89 113,51 100 ALGARVE/ Algarve 100 98,73
(90,56) 100
99,83 (101,29)
101,45
(88,77) 100
CENTRO 100 118,88
(101,29) 100
98,82 (100,34)
113,20
(96,19) 100
Baixo Vouga 100 119,76 100 98,79 114,38 100
Baixo Mondego 100 116,87 100 98,75 113,33 100
Pinhal Litoral 100 114,80 100 98,50 117,88 100
Pinhal Interior Norte 100 122,17 100 99,25 109,96 100
Dão Lafões 100 123,61 100 99,31 108,18 100
Pinhal Interior Sul 100 138,17 100 99,78 102,13 100
Serra da Estrela 100 126,59 100 96,32 142,00 100
Beira Interior Norte 100 115,80 100 98,54 117,70 100 Beira Interior Sul 100 102,94 100 99,25 106,95 100
Cova da Beira 100 127,44 100 98,35 120,73 100
Oeste 100 114,36 100 99,29 107,50 100
Médio Tejo 100 117,44 100 98,63 112,44 100
LISBOA 100 112,39
(98,44) 100
98,72 (100,26)
111,78
(97,61) 100
Grande Lisboa 100 112,51 100 98,63 112,37 100
Península de Setúbal 100 108,49 100 99,57 104,20 100
ALENTEJO 100 94,05
(88,08) 100
100,41 (101,54)
97,01
(88,79) 100
Alentejo Litoral 100 90,23 100 101,08 91,93 100
Alto Alentejo 100 94,86 100 100,05 99,66 100
Alentejo Central 100 91,12 100 100,31 98,09 100
Baixo Alentejo 100 88,89 100 101,56 88,95 100
Lezíria do Tejo 100 103,49 100 99,83 101,36 100
AÇORES/ Açores 100 105,59
(85,00) 100
98,76 (100,29)
118,72
(95,70) 100
MADEIRA/ Madeira 100 110,28
(100,79) 100
98,42 (99,63)
121,65
(105,10) 100
Estrangeiro 100 140,38 100 98,69 132,54 100
Total by Age Group