Printed version ISSN 0001-3765 / Online version ISSN 1678-2690 http://dx.doi.org/10.1590/0001-3765201620150026
www.scielo.br/aabc
Floristic evolution in an agroforestry system cultivation in Southern Brazil
LUÍS C.R. SILVA1
, SEBASTIÃO A. MACHADO1
, FRANKLIN GALVÃO1
and AFONSO FIGUEIREDO FILHO2
1
Universidade Federal do Paraná/UFPR, CIFLOMA – Engenharia Florestal, Avenida Prefeito Lothário Meissner, 900, 80210-170 Curitiba, PR, Brasil
2
Universidade Estadual do Centro-Oeste/UNICENTRO, Departamento de Engenharia Florestal, Rodovia PR-153, Km 7, Caixa Postal 121, 84500-000 Irati, PR, Brasil
Manuscript received on January 14, 2015; accepted for publication on April 10, 2015
ABSTRACT
Bracatinga (Mimosa scabrella Bentham) is an important pioneer tree species in Ombrophylous Mixed Forest of Brazil and is widely used as an energy source. In traditional agroforestry systems, regeneration is induced by fi re, then pure and dense stands known as bracatinga stands (bracatingais) are formed. In the fi rst year, annual crops are intercalated with the seedlings. At that time the seedlings are thinned, then the stands remain at a fallow period and cut at seven years old. The species is very important mainly for small landowners. We studied the understory species that occur naturally during the succession over several years in order to manage them rationally in the future and maintain the natural vegetation over time. Three to 20 year-old Bracatinga stands were sampled between 1998 and 2011. All tree species with diameter at breast height (DBH) ≥ 5 cm were measured.The fl oristic evolution was assessed with respect to Sociability Index, the Shannon Diversity Index and the Pielou Evenness Index. Graphs of rank/abundance over different age groups were evaluated using the Kolmogorov-Smirnov test. We identifi ed 153 species dispersed throughout the understory and tend to become aggregated over time.
Key words: bracatinga stands, Diversity Index, ecological succession, Evenness Index.
Correspondence to: Luís César Rodrigues da Silva E-mail: [email protected]
INTRODUCTION
Bracatinga (Mimosa scabrella Bentham) is a pioneer species, characterized by short life-span and fast growth, and surviving up to a maximum of 25 to 30 years. Management of the species has continued to be empirically driven, and settlers (small holders) in the Metropolitan Region of Curitiba, state of Paraná, Brazil, have used traditional methods since the fi rst decade of the twentieth century. Traditional management involves clearcutting once every seven
years, burning of the waste, natural regeneration and planting of annual crops (corn and beans) as an agroforestry system. Afterwards the stands are fallowed until the next rotation, when the process of clearcutting, burning, cropping and fallow is repeated (Somarriba and Kass 2001, Moreira et al. 2011).
practice for more than 100 years, and consider their bracatinga stands to be a kind of green savings account.
Soon after clearcutting and burning the waste, about a hundred thousand bracatinga seedlings per hectare may sprout. However during the fi rst year with the crop planting, bracatinga seedlings are thinned to approximately 25,000 seedlings per hectare. Since mortality is very intense, at seven years, around 4,000 bracatinga trees per hectare remain. At the same time, dozens of other tree species emerge, increasing in number and size. The process of succession continues and, at the age of 25, bracatinga virtually disappears from the forest, which takes on a more heterogenous and multi-aged fl oristic composition (Carpanezzi 1994, Carpanezzi et al. 1997).
It is known that a bracatinga stand ( bracatin-gal in Portuguese) is just one of the stages in plant succession, and this process has not been studied from a bracatinga stand, which is part of the pro-cess of secondary sucpro-cession. Horn (1974) defi nes the process as a pattern of changes in the specifi c composition of a community after a radical distur-bance or after the opening of a new patch in the physical environment for colonization by plants and animals.
To assess and compare the diversity of a local group or phase it is important to understand how diversity arises and what can be done to maintain it. The way in which diversity is measured is crucial in determining the relevance of the results that are found (Purvis and Hector 2000). Melo (2008) adds that understanding the diversity of species in an area at a given moment is fundamental to under-standing nature and, by extension, to improving manage ment of the area with respect to low-impact extraction, resource conservation or the restora-tion of degraded ecosystems. The literature shows a wide range of combinations of tools and analy-sis procedures to establish the succession process, among which is the work of Magurran (2004).
The objective of this work was to identify the tree species and the aggregation pattern in the understory of bracatinga stands and assess changes in species richness and evenness, over time.
MATERIALS AND METHODS
STUDY AREA
This research was conducted in bracatinga stands of the Metropolitan Region of Curitiba, Paraná, Brazil. These bracatinga stands are more preva-lent in the northern part of this region. Consider-ing the geographic coordinates, the study area is bounded to the north by latitude 24°58’11”S, to the south by latitude 25°55’44”S to the west by longitude 49°29’09”W, and to the east by longitude 49°03’58”W. The average altitude is 950 m above sea level.
The study area is located on the First Plateau of Paraná and the landscape has been incised in recent geologic time by the tributaries of the deep Ribeira River valley. According to the Köeppen classifi cation system, the climate of the region is Cfb, with an average annual temperature of 16.5 °C. During the warmest month, the average temperature reaches 20.4 °C and the coldest month is 12.7 °C. The wettest month is January, with 190.7 mm of precipitation, while the driest month is August with 78.2 mm of precipitation. The annual rainfall is around 1500 mm (Maack 2002). The number of frosts per year varies from 0 to 32, according to Carvalho (2002).
crystalline origin (granites and gneisses), with surface represented by loamy and sandy soils. Furthermore, diabase dikes, that cut the rocks of the two areas, occur more frequently in the north than in the south. Due to the high variability of the diabase forming minerals, large amounts of fi ne material are formed (i.e. larger quantities of clay.)
DATA SOURCES
The data used in this study came from 320 tempo-rary plots, which were installed and monitored in bracatinga stands from traditional agroforesty system with ages ranging from 3 to 20 years. Most of the plots were 300 m² (10 x 30 m) in area. Several smaller plots of 100 m² (10 x 10 m) were installed in younger bracatinga stands, while other larger plots of 400 m² (10 x 40 m) and 600 m² (20 x 30 m) were installed in older bracatinga stands, as shown in Table I.
The age of each bracatinga stand was cited by the owner or obtained by felling some bracatinga trees and counting the growth rings at the base of each tree. When uncertainties arose, trunk disks were collected, dried and sanded so that rings could be counted more accurately in the laboratory. When felling was not possible, bore holes were drilled at DBH and the increment cores were removed, dried, and sanded to facilitate ring counts.
For all sampling units only tree species whose individuals with diameter at 1.30 m (DBH) greater than or equal to 5.0 cm (circumference greater than or equal to 15.7 cm) were counted. These individuals were identifi ed by an expert in the fi eld. When species could not be identifi ed defi nitively, specimens were collected and deposited in the Forestry herbarium of the Federal University of Paraná in Curitiba, Paraná, for identifi cation.
The circumference of each specimen was measured with metric tape and the total height was measured with a telescopic rod graduated in centimeters for individuals up to 12 meters and with a Blume-Leiss hypsometer for taller individuals.
SAMPLING SUFFICIENCY
Following the guidelines of Magurran (2004), the Diversity Index was plotted against the cumulative sample size to assess whether the sampling was suffi cient. The order in which the samples were included was randomized 100 times and the Simpson Index was chosen for this purpose. The entire procedure was performed individually for each sampled age using the EstimateS program (http://viceroy.eeb.uconn.edu/EstimateS). For the bracatinga stands studied, the species that settled over time were the ones of interest. Thus a Diversity Index appeared to be the most suitable option to be used in evaluating the sampling.
Magurran (2004) also notes that the Simpson Diversity Index provides a good, consistent estimate, even when applied to relatively small populations. The average plot randomization TABLE I
Number of sampling units by age, with respective area sampled, in bracatinga stands.
Age (years)
Number of sampling units
Sampled Area (m²)
03 08 0,800
04 21 4,920
05 27 6,315
06 32 8,125
07 36 9,610
08 22 5,800
09 25 6,720
10 16 4,800
11 18 5,720
12 15 4,270
13 19 6,000
14 21 6,900
15 13 5,000
17 06 3,400
18 09 2,980
19 29 5,800
20 03 0,900
values for the Simpson index and the deviations generated by the EstimateS softwarewere exported to an eletronic spreadsheet for use in generating graphs.
FLORISTIC EVALUATIONOVER TIME
Each age group was sampled separately. Thus, the relative density for each species at each age could be calculated, in addition to its relative dominance and Sociability Index (SI). Subsequently, the Shannon Diversity Index (H’) and Pielou Evenness Index (J’) were calculated for each age, using the following formulas:
(1)
(2)
(3)
i = ith species, jth age; jn and jm = any two ages; n = number of individuals of a given species; N is the total number of individuals of a given age; S = number of species; Dme is the average density of the species e, by plot; and FAe is the absolute frequency of species e.
The Sociability Index was used to determine the behavior of the aggregation degree of species over time, according to Galvão (1989). Diversity and Evenness Indices were calculated to demonstrate the evolution of diversity and evenness over time and their values were compared with reference values found in the literature. Ranking charts/ graphs of abundance and dominance were created to more consistently than the H’ and J’ indices, express the evolution of diversity and evenness of bracatinga stands over time. Abundance means the relative density of each species which was
calculated together with the relative dominance. Then species were arranged in descending order with respect to these variables, and graphs were plotted for the 30 highest ranking species.
Graphs followed the guidelines of Magurran (2004) and we applied the Kolmogorov-Smirnov test in order to assess whether the differences between the rank/abundance curves of population pairs were statistically signifi cant at the α = 0.01 level.
RESULTS
SAMPLING SUFFICIENCY
Following the guidelines of Magurran (2004) Figure 1 was produced, which relates the inverse of the Simpson Richness Index (1/D) to the cumulative number of plots measured at each age of the bracatinga stands. If the diversity curve reaches an asymptote, one can be reasonably confi dent that the number of sampled plots was suffi cient with regard to the diversity expressed by this index.
Thus, the results indicated that only the sample of bracatingas aged 20, were not suffi cient. For other ages, especially younger ones, fewer plots would suffi ce. In general, the sampling performed bracatinga stands from different ages provides some support to the claims made in this study.
FLORISTIC EVOLUTIONIN BRACATINGA STANDSOVER TIME
Besides the number of species found over time, another important aspect in assessing fl oristic evolution over time is species behavior. To high-light this fact, Table SIII (Supplementary Material) was elaborated where species observed in the bra-catinga stands are listed from the most to the least frequent in the various stand ages. The values indicate the Sociability Index (SI) in each year, and the greater the value of this index at a certain age, the more aggregated species become compared to others of the same age. The absence of the SI value also indicates the absence of the species in a certain stand age. Three year old stands were disregarded since only the species bracatinga was found.
In observing Table SIII one will note that bracatinga, the dominant pioneer species, grows in an agglomerated pattern, but tends to be more Figure 1 - Behavior of the Simpson Index (expressed as 1/d ±1 standard deviation) with respect to the number of plots sampled, after 100 randomizations of the sampling, for br acatinga stands from different ages.
TABLE II
Number of families, genera and species found in bracatinga stands from different ages. Age (years) Families Genera Species
03 01 001 001
04 06 008 009
05 06 v06 006
06 16 026 028
07 21 031 034
08 23 031 033
09 24 036 044
10 25 037 042
11 28 052 066
12 27 048 058
13 34 064 086
14 32 065 088
15 35 055 071
17 31 047 062
18 25 040 048
19 30 050 069
20 19 024 028
dispersed, while the others tend to arise in a more scattered fashion but becoming more tightly aggregated.
However, the behavior of other species suggests that they become established in the understory of bracatinga stands in a less aggregated fashion, and that as bracatinga die, their progeny move in to occupy the gaps and evolve into a more aggregated pattern, as suggested by their Sociability Index values.
Exotic species such as Hovenia dulcis and Ligustrum lucidum were found only in 10 and 17 year-old bracatinga stands, in very few samples and in individual numbers much lower than the others, suggesting that these species did not pose problems as competitors in the study areas.
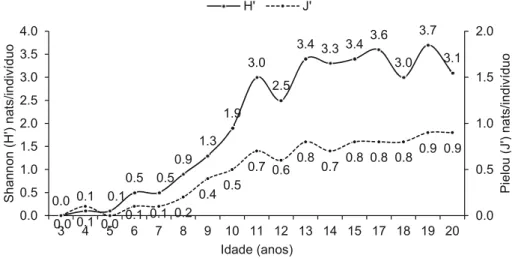
It is common to represent the state of plant assemblages using the Shannon Richness (H’) and the Evenness (J’) indices. Thus Figure 2 shows the evolution of these indices in the bracatinga stands studied.
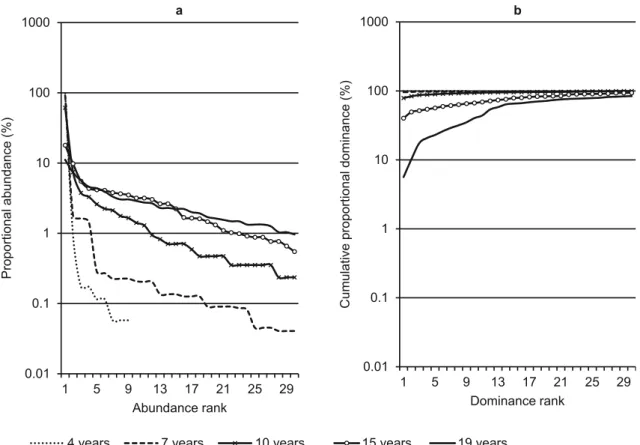
Since the values of H’ and J’ are widely used in evaluating diversity, many values exist in the literature for comparison. Thus, it was necessary to calculate them. However, in order to describe plant assemblages in a more consistent way, Magurran (2004) suggests using ranking/abundance charts. Figure 3 was created to depict the behavior of the 30 most abundant species in bracatinga stands of
fi ve different age groups. It is not necessary to use all of the age groups in this procedure, therefore, for the purpose of enhancing the readability of Fig-ure 3, several age groups were not included. Only age groups 4, 7, 10, 15 and 19 were chosen. At 4 years, other tree species with DBH>5.0 cm appear; at 7 years, bracatinga stands reach the preferred age for harvesting; by 10 and 15 years a large number of samples were available; and lastly, the age of 19 was the oldest group which could sampled suffi -ciently. By 20 years sample sizes were insuffi cient. The relative density was plotted on a logarithmic scale to more clearly illustrate more the differences between the age groups.
Figure 2 - Evolution of the Shannon Diversity Index (H ‘) and Pielou evenness index (J’) over the years in bracatinga stands.
Figure 3 shows that even at 10 years, the bracatinga stand is dominated by just one species and the others do not comprise even 5% of the density and dominance. This behavior was confirmed when pairwise comparisons of the
abundance distributions of different age groups were made using the Kolmogorov-Smirnov test, as indicated by Magurran (2004). The results are shown in Table IV where differences between the
10 year old stands are highlighted. In neither of the cases were differences statistically signifi cant at the α=0.01 level. However, differences between
the 10 and 15 year curves were signifi cant. Lastly, differences between the 15 and 19 year curves were not signifi cant.
Figure 3 - Graph of ranking/abundance (a) and relative dominances (b) of the fi rst 30 species in bracatinga stands from different ages.
TABLE IV
Komolgorov-Smirnov test to evaluate the rank/abundance curves of pairs of differently aged bracatinga stands. n1 and n2: number of species in the fi rst (1) and second (2) age considered; D:
largest absolute difference between the cumulative distributions of the densities of ages 1 and 2. Ages
(1 and 2) D n1 n2 n1.n2.D Dcritical n1.n2.Dcritical α (0.01)
4 and 7 0.0676 09 34 0020.672 0.6101 0186.7020 ns
04 and 10 0.3696 09 42 0139.706 0.5979 0225.9878 ns
04 and 15 0.8042 09 71 0513.901 0.5759 0368.0013 **
04 and 19 0.8715 09 69 0541.193 0.5768 0358.2177 **
07 and 10 0.3020 34 42 0431.309 0.3755 0536.1976 ns
07 and 15 0.7367 34 71 1778.326 0.3395 0819.4402 **
07 and 19 0.8039 34 69 1886.022 0.3410 0800.0859 **
10 and 15 0.4346 42 71 1296.082 0.3168 0944.8155 **
10 and 19 0.5028 42 69 1457.172 0.3185 0923.1338 **
15 and 19 0.1215 71 69 0595.096 0.2751 1347.9436 ns
ns
DISCUSSION
Since bracatinga stands are usually cut around the age of seven, it is diffi cult to fi nd bracatinga stands that are older than that. Thus studies of the under-story of bracatinga stands have traditionally been conducted near the harvest age and generally seek to identify other species for their potential uses, as they will inevitably be harvested along with the bracatinga. These studies are scarce and do not adopt the same criteria for including individuals, making comparisons diffi cult. However, all studies indicate high diversity of the understory of bracat-inga stands that underwent thinning in the fi rst year. In the same region Baggio et al. (1995), at the age of seven and considering individuals with total height of at least two meters, found 81 species in 34 families and mentioned that there are 220 native tree species in the region. Baggio and Carpanezzi (1998) studied six to eight year old bracatinga stands at a minimum DBH of 3.0 cm, and found 32 tree species with potential for use in manufacturing tool handles. Mazza et al. (2000b) studied 7-year-old bracatinga stands throughout the northern part of the Metropolitan Region of Curitiba and found 151 species in 46 families of trees, shrubs and herbaceous species.
When bracatinga stands are not subjected to thinning in the fi rst year, the understory that de-velops over time has fewer species, as Steenbock et al. (2011) observed in bracatinga stands in the state of Santa Catarina, where an annual crop is not produced an annual crop in the fi rst year of de-velopment of the bracatinga stands. Those authors studied 2 to 20 year old bracatinga stands and dur-ing this found that only 24 species reached DBH greater than 5.0 cm. Even when the inclusion crite-ria were altered to include species with a minimum DBH of 3.0 cm, just 31 species were recorded. This difference occurs because when thinning is not done in the fi rst year, bracatinga grows at high
density, blocking sunlight to the understory and hindering the establishment of other species.
It is also important to mention the wide variety of sites that exist in the region of bracatinga stands. This greatly infl uences ecological processes, and consequently changes the number of species that become established. This is the line of reasoning to which Schilling and Batista (2008) subscribe, who argue that spatio-temporal variability of a given vegetation assemblage results only from these ecological processes.
In this study, the aggregated pattern of species which occured over time is supported by the fi ndings of Matteucci and Colma (1982). According to these authors, when most of the individuals of a species are young, they tend to be concentrated spatially, and over time, intra-specifi c competition increases randomness in the species distribution pattern.
Another issue inherent to bracatinga stands is in determining the type of mature forest that will develop from them. The literature claims that bracatinga occurs exclusively in Ombrophylous Mixed Forest (OMF). Thus, this type of assemblage becomes the basis for investigating the succession of bracatinga stands and is considered one of the vegetation phases that will culminate in an OMF.
inclu-sion limit of 4.8 cm DBH, Cordeiro and Rodrigues (2007) determined an H’ of 2.79 and J’ of 0.9 for an OMF in Guarapuava, Paraná. In the same region of Guarapuava, Silvestre et al. (2012) found an H’ of 3.30 for a OMF fragment with a minimum DBH of 5.0 cm. Scheer and Blum (2011) analyzed a da-tabase of literature, with inclusion criteria ranging from 3.1 to 10.0 cm DBH, and calculated an H’ of 4.38 and evenness 0.82 for the Araucaria Forest in Paraná.
Based on these comparisons and given a value of H’ of approximately 3.0, it appears from Figure 3 that bracatinga stands aged 13 or older do not have H’ lower than this value. Thus at 13 years old the diversity of a bracatinga stand is similar to an OMF, although it appears in Table SIII that bracatinga continues to demonstrate a signifi cant presence at this age group when compared to the other species. One might also conclude that from age 13, there are as many species in a bracatinga stand as there are in an OMF, but that they have not yet developed to the same extent as in an OMF, since after the bracatinga stage, the forest cover becomes a so-called capoeirão, or tall shrub phase, followed by a young forest phase and fi nally a mature forest.
RESUMO
A bracatinga (Mimosa scabrella Bentham.) é uma im-portante espécie arbórea pioneira da Floresta Ombrófi la Mista no Brasil e é amplamente utilizada como fonte de energia. Em sistemas tradicionais agrofl orestais, a regeneração é induzida pelo fogo, em seguida povoa-mentos puros e densos conhecidos como bracatingais são formados. No primeiro ano, culturas anuais são in-tercaladas com as mudas. Naquele momento as mudas são raleadas, os povoamentos permanecem em posio e, em seguida, cortados aos sete anos de idade. A espécie é muito importante, principalmente, para os pequenos proprietários. Estudamos as espécies do sub-bosque que ocorrem naturalmente ao longo de vários anos, a fi m de manejá-las racionalmente no futuro, para manter a vegetação natural através dos anos. Bracatingais de 3 a 20 anos foram amostrados entre 1998 e 2011. Todas
as espécies de árvores com diâmetro à altura do peito (DAP) ≥ 5 cm foram medidas. A evolução fl orística foi avaliada com o Índice de Sociabilidade, Índice de Diversidade de Shannon e Índice de Equabilidade de Pielou. Gráfi cos de classifi cação ranking/abundância em diferentes grupos etários foram avaliados usando o teste de Kolmogorov-Smirnov. Identifi camos 153 espécies dispersas por todo o sub-bosque, as quais tendem a se tornarem agregadas com o passar dos anos.
Palavras-chave: bracatingais, Índice de Diversidade, sucessão ecológica, Índice de Equabilidade.
REFERENCES
BAGGIO AJ AND CARPANEZZI AA. 1998. Exploração seletiva do sub-bosque: uma alternativa para aumentar a rentabili-dade dos bracatingais. Colombo: EMPRAPA-CNPF, 17 p. (EMBRAPA-CNPF. Circular Técnica 28).
BAGGIO AJ, CARPANEZZI AA, CARVALHO PE AND SOARES AO. 1995. Levantamento de espécies lenhosas em sub-bosque de bracatingais. Bol Pesq Florest 30: 69-74. CALLEGARO RM. 2012. Variações florísticas e estruturais de
um remanescente de floresta ombrófila mista Montana em Nova Prata – RS. Dissertação, Universidade Federal de Santa Maria. (Unpublished).
CARPANEZZI AA, CARPANEZZI OTB AND BAGGIO AJ. 1997. Manejo de bracatingais. In: Curso de manejo florestal sustentável. Embrapa Florestas, Colombo, p. 157-163 CARPANEZZI OTB. 1994. Produtividade florestal e agrícola
em sistemas de cultivo da bracatinga (Mimosa scabrella
Bentham) em Bocaiúva do Sul, região metropolitana de Curitiba – Paraná. Dissertação, Universidade de São Pau-lo. (Unpublished).
CARVALHO PER. 2002. Bracatinga. Colombo: EMBRAPA Florestas, 11 p. (EMBRAPA Florestas. Circular Ténica 59).
CORDEIRO J AND RODRIGUES WA. 2007. Caracterização fitossociológica de um remanescente de floresta ombrófila mista em Guarapuava, PR. Árvore 31(3): 545-554. GALVÃO F. 1989. Métodos de levantamento fitossociológico.
In: Milano MS et al. (Coord), Seminário sobre avaliação e relatório de impacto ambiental. FUPEF, Curitiba, p. 108-116.
HORN HS. 1974. The ecology of secondary succession. Annu Rev Ecol Evol Syst 5: 25-37.
MAACK R. 2002. Geografia física do estado do Paraná, 3ª ed., Imprensa Oficial do Paraná, Curitiba, 350 p.
MAGURRAN AE. 2004. Measuring biological diversity. Blackwell Pub, Oxford, 1st
ed., 364 p.
MATTOS PP, GARRASTAZU MC, LACERDA AB, ROSOT MAD AND OLIVEIRA YMM. 2008. Demonstração de diferentes protocolos para implantação de parcelas permanentes em floresta ombrófila mista. Embrapa Florestas, Colombo. MAZZA CAS, BAGGIO AJ AND CARPANEZZI AA. 2000a.
Distribuição espacial da bracatinga na região metropolitana de Curitiba com imagens de satélite Landsat. Embrapa Florestas, Colombo.
MAZZA MCM, RODIGHERI HR, NAKASHIMA T, ZILLER SR, MAZZA CAS, CONTO AJ, SOARES AO AND BAGGIO AJ. 2000b. Potencial de aproveitamento medicinal de espécies do sub-bosque dos bracatingais da região de Curitiba, PR. Embrapa Florestas, Colombo.
MELO AS. 2008. O que ganhamos ‘confundindo’ riqueza de espécies e equabilidade em um índice de diversidade? Bio-ta Neotrop 8(3): 21-27. http://www.bioBio-taneotropica.org. br/v8n3/pt/abstract?point-of-view+bn00108032008. Ac-cessed 16 June 2012.
MOGNON F, DALLAGNOL F, SANQUETTA CR, DALLA CORTE AP AND MAAS G. 2012. Uma década de dinâmica florística e fitossociológica em floresta ombrófila mista montana no sul do Paraná. Rev Estud Ambient 14(1): 43-59.
MOREIRA PA, STEENBOCK W, PERONI N AND REIS MS. 2011. Genetic diversity and mating system of bracatinga (Mimosa scabrella) in a re-emergent agroforestry system in southern Brazil. Agroforest Syst 83(2): 245-256. OKA-FIORI C AND SANTOS LJC (EDS). 2006. Atlas
geomorfológico do estado do Paraná. MINEROPAR, Curitiba. http://www.mineropar.pr.gov.br/arquivos/ File/2_Geral/Geomorfologia/Atlas_Geomorforlogico_ Parana_2006.pdf. Accessed May 10, 2013.
PURVIS A AND HECTOR A. 2000. Getting the measure of biodiversity. Nat 405: 212-219.
SCHEER MB AND BLUM CT. 2011. Arboreal Diversity of the Atlantic Forest of Southern Brazil: From the Beach Ridges to the Paraná River. In: Grillo O (Ed), The Dynamical Processes of Biodiversity Case Studies of Evolution and Spatial Distribution. InTech. <http://www.intechopen. com/books/the-dynamical-processes-of-biodiversity-case- studies-of-evolution-and-spatial-distribution/arboreal- diversity-of-the-atlantic-forest-of-southern-brazil-from-the-beach-ridges-to-the-parana-riv>. Accessed February 11, 2013.
SCHILLING AC AND BATISTA JLF. 2008. Curva de acumulação de espécies e suficiência amostral em florestas tropicais. Rev Bras Bot 31: 179-187.
SILVESTRE R, KOEHLER HS, MACHADO AS, BALBINOT R AND WATZLAWICK LF. 2012. Análise Estrutural e Distri-buição Espacial em Remanescente de Floresta Ombrófila Mista, Guarapuava (PR). Ambiência 8(2): 259-274. SOMARRIBA E AND KASS D. 2001. Estimates of above-ground
biomass and nutrient accumulation in Mimosa scabrella
fallows in southern Brazil. Agroforest Syst 51(2): 77-84. STEENBOCK W, SIMINSKI A, FANTINI AC AND REIS MS.
2011. Ocorrência da bracatinga (Mimosa scabrella benth.) em bracatingais manejados e em florestas secundárias na região do planalto catarinense. Árvore 35(4): 845-857. VALERIO AF, WATZLAWICK LF, SAUERESSIG VP AND
PIMENTEL A. 2008. Análise da composição florística e da estrutura horizontal de uma floresta ombrófila mista Montana, município de Irati, PR – Brasil. Rev Acad Ciênc Agrár Ambient 6(2): 137-147.
SUPPLEMENTARY MATERIAL