http://www.uem.br/acta ISSN printed: 1806-2636 ISSN on-line: 1807-8672
Doi: 10.4025/actascianimsci.v38i3.30009
Fermentation kinetics and
in vitro
degradation rates of grasses of
the genus
Cynodon
Sidnei Tavares dos Reis1*, Marcus Vinícius Gonçalves Lima2, Eleuza Clarete Junqueira de Sales2, Flávio Pinto Monção3, João Paulo Sampaio Rigueira2 and Leonardo David Tuffi Santos4
1
Departamento de Zootecnia, Universidade Federal de Sergipe, Avenida Marechal Rondon, s/n., Jardim Rosa Elze, 49100-000, São Cristóvão, Sergipe, Brazil. 2Departamento de Zootecnia, Universidade Estadual de Montes Claros, Janaúba, Minas Gerais, Brazil. 3Programa de Pós-Graduação em Zootecnia, Universidade Estadual Paulista “Júlio de Mesquita Filho”, Jaboticabal, São Paulo, Brazil. 4Instituto de Ciências Agrárias, Universidade Federal de Minas Gerais, Montes Claros, Minas Gerais, Brazil.*Author for correspondence. E-mail: [email protected]
ABSTRACT. The present study aimed to evaluate the fermentation kinetics and degradation rates of
Cynodon grasses estimated by semi-automated technique of in vitro gas production. The forages were:
Coastcross, Tifton 85 and Tifton 68. Pressure readings were taken at 0, 2, 4, 6, 8, 10, 12, 15, 19, 24, 30, 36, 48, 72 and 96 hours. Dry matter degradability (DMD) was obtained by the percentage of dry matter (DM) remaining after 0, 6, 12, 24, 48 and 96 hours of fermentation. Tifton 85 showed a higher total gas production (p <0.05). Higher fermentation rates were found at the beginning of fermentation followed by subsequent reduction (p <0.05) over time. Tifton 85 and Tifton 68 showed higher values (p < 0.05) for soluble fraction, potentially degradable insoluble fraction, insoluble fraction, potential and effective degradability of dry matter in relation to Coastcross grass. Higher gas production during in vitro incubation of dry matter was observed for Tifton 85 g.
Keywords: forage, gas production, semi-automated technique.
Cinética da fermentação e taxa de degradação
in vitro
de gramíneas do gênero
Cynodon
RESUMO.Objetivou-se avaliar a cinética da fermentação e taxas de degradação de gramíneas do gênero
Cynodon estimadas pela técnica semi automática de produção de gases in vitro. As forrageiras utilizadas foram: Coastcross, Tifton 85 e Tifton 68. As leituras de pressão foram realizadas nos tempos: 0, 2, 4, 6, 8, 10, 12, 15, 19, 24, 30, 36, 48, 72 e 96h. A degradabilidade da matéria seca (DMS) foi obtida pela porcentagem de matéria seca (MS) remanescente após 0, 6, 12, 24, 48 e 96h de fermentação. A gramínea Tifton 85 apresentou uma produção total de gases superior (p <0,05). Maiores taxas de fermentação ocorreram no tempo inicial de fermentação decrescendo (p <0,05) com o avançar do tempo. As gramíneas Tifton 85 e Tifton 68 apresentaram valores superiores (p <0,05) de fração solúvel, insolúvel potencialmente degradável, insolúvel, degradabilidade potencial e efetiva da matéria seca em relação à gramínea Coastcross. Maior produção de gases durante a incubação in vitro da matéria seca foi observada para o capim Tifton 85.
Palavras-chaves: forragem, produção de gás, técnica semi automática.
Introduction
Tropical forage in Brazil remains one of the most economical food resources for livestock production (Moreira, Prado, Cecato, Wada, & Mizubuti, 2004; Sá et al., 2011). Thus, the search for forages with potential for high biomass production (above 10.000 kg DM ha-1 year-1) associated with good
nutritional value (over 10 crude protein, 60% degradable fiber) is a prerequisite for most ranchers (Oliveira et al., 2014b).
Among the forage available, some Cynodon hybrids exhibit these characteristics, i.e., rapid accumulation of dry matter, with high leaf: stem ratio, which can result in good nutritional value (Ferreira, Santos, Cecato, & Cruz, 2005; Monção et al., 2014).
However, quality of the forage depends on the structural arrangement and proportion of its constituents, which vary within a species, according to the age and part of the plant, soil fertility, among others (Van Soest, 1994). As the determination of the nutritional value of forage plants has high importance and complexity, it is normally used in vivo and in situ methods for evaluation, which is not always possible because as it requires considerable use of cannulated animals, food stocked, hand labor, time and high costs, thus limiting their applicability (Zeoula et al., 2000; 2002).
technique proposed by Mauricio et al. (1999), Pell and Schofield (1993).
This technique allows to estimate the ruminal degradation parameters through in vitro digestibility assay, due to the cumulative production of CO2,
NO2, H2 and CH4, released during fermentation of
the sample incubated in buffered rumen fluid (Pell & Schofield, 1993; Theodorou, Williams, Dhanoa, McAllan, & France, 1994).
In this context, this study evaluated the fermentation kinetics and degradation rates of
Cynodon grasses estimated by semi-automated
technique of in vitro gas production
Material and methods
The experiment was conducted at the Experimental Farm of the State University of Montes Claros – Unimontes, in the municipality of Janaúba, northern state of Minas Gerais and at the Food Science Laboratory, Department of Agricultural Sciences, Unimontes, Campus Janaúba. Forages (Coastcross, Tifton 85 and Tifton 68) were sampled in an area pre-installed in the Forage and Pasture Sector of this institution. Three consecutive cuts were made at 42 days of age, each cut was considered as the experimental unit. Samples were subjected to pre-drying in a forced air oven at 55ºC for 72 hours, ground in a Wiley knife mill, with 1 mm diameter sieve.
Each vial received 90 mL culture medium according to Theodorou, Williams, Dhanoa, McAllan, and France(1994). The vials were sealed with rubber stoppers (14 mm) and to prevent any fermentation were kept at 4°C overnight in a common refrigerator. On the next day, five hours before inoculation, vials were taken to the oven at 39°C until the moment of inoculation. Two male cattle equipped with rumen cannula were used to provide rumen fluid (inoculum). The collection was carried out manually in the ventral sac of the rumen with the aid of a cloth and subsequently inocula from two animals were homogenized and then packed in thermos bottle, previously heated (39°C) and immediately taken to the laboratory. The material was filtered through a double layer of cheesecloth with continuous injection of CO2, kept
in a water bath, and immediately inoculated. The inoculation was performed by injecting 10 mL inoculum per vial using a graduated plastic syringe. Immediately after inoculation, vial pressure was stabilized by inserting needles (25 x 7 mm) in the lids of the vials. The needles were posteriorly removed, vials were manually shaken and placed in an oven at 39°C. At this time, fermentation times
were started. Pressure readings were taken more frequently during the initial fermentation period and reduced later (0, 4, 6, 8, 10, 12, 15, 19, 24, 30, 36, 48, 72 and 96 hours); after the readings of 12, 24, 48, 72 and 96 hours, two vials were taken from each treatment to determine the degradability.
Gas pressure was obtained using the Universal Data logger, Logger AG100 equipment, a bench equipment with analog input, to which was connected the manipulo with a needle (0.7 mm) fixed at its tip to pierce the synthetic rubber stoppers of the vials. This equipment has a trigger button at the top of the manipulo to record pressure (psi).
Volume was measured by a graduated syringe (20 mL) at predetermined times (0, 6, 12, 24, 48, 72 and 96 hours) also with a coupled needle (0.6 mm). Immediately after inoculation, the initial reading was performed with the aim to standardize the pressure and discard the volume of gas in all tubes. From insertion of the needle into the synthetic rubber stopper, the pressure produced inside the vials was verified in the digital reader. After pressure reading, the volume of gases was determined by pulling the plunger until the transducer pressure returned to zero.
For measurement of gas production from the buffer and rumen fluid, two vials were incubated containing only these components.
For each reading time, the gas volume of the vials with the sample was subtracted from the volume obtained in the vials without samples. By obtaining the values of pressure and volume at each time, these were added to values of previous readings, thus enabling the construction of the curve corresponding to the soluble fraction for each incubation time.
The disappearance of dry matter was obtained for the relationship between the percentage of the material initially incubated and the residue after 0, 12, 24, 48, 72 and 96 hours of fermentation. The residue of degradation was obtained by filtering the contents of each vial in porosity 1 crucibles and further drying in an oven at 105°C for 12 hours.
Cumulative gas production data from the fermentation of each treatment were used in the model of France et al. (1993), according to Equation 1:
Y = A 1 - exp [ (- b(t - L) – c) x (√ t - √ L)] (1)
where:
Y = cumulative gas production (mL);
A = asymptote or maximum potential gas production;
b (hour-1) and c (hour-0,5) = constant fractional rates.
Fractional rate (hour-1) combined with gas
production (μ) was calculated as Equation 2:
μ = b + c/2√t (2)
where:
μ = gas production rate (hour-1);
b and c = parameters similar to the equation; t = incubation time in hours.
To adjust the degradability data at 0, 6, 12, 24, 48, 72 and 96 hours, we used the mathematical models proposed by Mehrez, Ørskov, and McDonald(1977) and Ørskov and McDonald (1979), which allowed to estimate the potential (PD) and effective (ED) degradability, according to Equation 3 and 4:
PD = A -> t ≤ L (3)
PD = a + b (1-e-c x t) −> t > L (4)
where:
DP = degradability of food (%) at time t (hours); A = readily soluble fraction (%);
a and b = model parameters, the sum (a + b) numerically corresponds to the potential degradability of food; and
c = degradation rate (%hour-1).
It was also calculated the potentially fermentable soluble fraction of food (B), according to Equation 5:
B = (a + b) – A or 100 - (A+C), (5)
where:
C = non-degradable fraction (calculated as 100-PD).
Effective degradability (ED) of food was calculated as equation 6:
ED= (a+b)/[c/(c+kp)] (6)
where:
kp = food passage rate (%hour-1) through the
rumen, considered as 5%hour-1.
Estimates of the parameters described in the mathematical model were calculated using non-linear interactive methods. These results fitted by least squares estimates were obtained from the use of the Gauss - Newton method using a NLIN procedure, with the aid of Statistical Analysis System (SAS, 2004).
To obtain the statistical models that measure the ratio between the volume of gas produced during fermentation and pressure (psi), we used the correlation analysis by means of the Manova
command line of GLM procedure of SAS. Once detected satisfactory correlation (above 85%) and significant between the volume and pressure, we used the option Selection = Stepwise in the Model command line of GLM procedure of SAS for automated selection of the best model among the tested models (linear, quadratic and cubic).
Values of cumulative gas volume, degradation rate, colonization time, effective and potential degradability, readily soluble fraction, potentially fermentable soluble fraction and non-degradable fraction were subjected to analysis of variance using the Analysis of Variance System (Sisvar) for balanced data, described by Ferreira (2011) and whenever significant, the means of treatments (g) were compared by Scott-Knott test at 5% probability by Sisvar (Ferreira, 2011).
Results anddiscussion
Data of pressure varies from 0 to 7.8 psi (pound per square inch) and volume data ranged between 0 and 42 mL. The reading times allowed to obtain pressure values higher than 7 psi, which can cause instability in the correlation between the variables and changes in microbial growth (Theodorou et al., 1994). Although the values obtained were higher than 7 psi, it was found a high correlation (Figure 1).
Figure 1.Data of pressure and volume obtained during gas production test using grasses of the genus Cynodon (*pound per
square inch) as substrate.
The predicted regression equation in this experiment was V(mL) = 5.0998X + 0.1816,
(R2 = 0.98), where V = volume (mL), and
P = pressure (psi). The high correlation (R2 = 0.9850) reflected the accuracy in estimating
varieties of cassava, but with predicted volume of 4.96 mL for each psi. It differed from the equation obtained by Mauricio et al. (2001), in which V(ml) = – 0.004 + 4.43 P + 0.051 P2, (R2=0.99) in a
study conducted at the University of Reading, England. The equation relating volume and pressure found in this study shows that the implementation of semi-automated technique requires specific equations for each site and respective altitude.
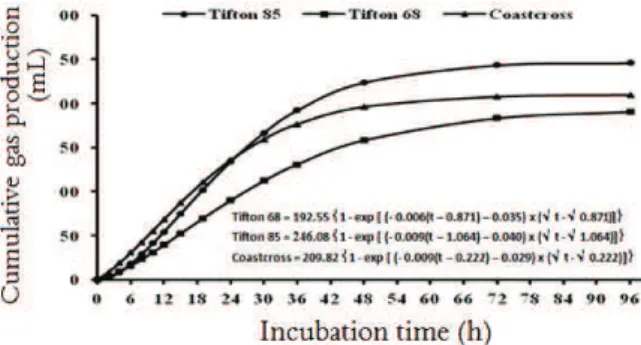
Gas production parameters estimated by France et al. (1993), total gas production (A) colonization time (L), and fermentation rate (µ) after 96 hours of incubation are listed in Table 1.
Table 1.Total gas production (A),in mLg-1DM, colonization time
(L) in hours and fermentation rate (µ) in mLg-1DMhour-1, in 96
incubation hours of three grasses of the genus Cynodon.
Parameters Grasses SEM p value Tifton 85 Tifton 68 Coastcross
A 246.08a 192.55c 209.82b 4.0531 0.000 L 1.064a 0.871b 0.222c 0.0516 0.001
µ 0.015a 0.011b 0.013a 0.0008 0.039
Different lowercase letters in the same column are significantly different (p <0.05) by Scott-Knott test. SEM- Standard Error of the Mean.
Tifton 85 grass showed the highest total gas production (p <0.05) compared to the other grasses, demonstrating greater degradation in the rumen. These values are close to those reported by Velásquez et al. (2009), who examined Tifton 85 g and Tanzania grass and registered 246.15 and 247.61 mL g-1, respectively, for total gas production.
Monção et al. (2014), Oliveira, Monção, Gabriel, Lempp, and Moura (2014a) analyzed the ruminal degradation of different grasses, including Tifton 85, Tifton 68 and Coastcross, and pointed out that the structural arrangement of the cell wall components (cellulose, hemicellulose and lignin) influence the extent of degradation and the degradation rate of the slowly soluble fraction, that is, a greater or lesser gas production will depend on the chemical composition of each grass. The formation ester bond between hemicellulose and lignin reduces ruminal degradation, which, in turn, leads to a lower gas production (Van Soest, 1994).
The gas production rates obtained herein were similar (p> 0.05) for the Tifton 85 and Coastcross
(0.015 and 0.013mLg-1 DMhour-1, respectively).
Moreira et al. (2010) investigated the cumulative gas production and ruminal parameters using the model of France et al. (1993), through semi-automated in
vitro technique, of carbohydrate sources for
ruminants. The authors found that the treatments containing sugarcane (high content of readily soluble sugar, sucrose) tended to have numerically higher values of gas accumulation.
Colonization time (lag time) is an important parameter that is related to the degradation of the fiber (Mertens & Loften, 1980). The shorter time for the colonization onset (p <0.05) was observed to
Coastcross, followed by Tifton 68 (0.222 and 0.871
hours, respectively). Tifton 85 presented longer Lag Time, that is, it took longer for the rumen microorganisms initiate the colonization and degradation of substrates compared to other grasses. Reduction in colonization time is favored by readily fermentable substrates and by physical and chemical characteristics of the sample cell wall. Nevertheless, Faria et al. (2008) stated that the correlation between the cumulative gas production and total carbohydrate degradation is high, but some differences in the magnitude of this correlation can be detected depending on the technique used.
Curves of cumulative gas production of DM of grasses studied are illustrated in Figure 2.
Figure 2.Cumulative gas production (PCG) (in mLg-1DM) x
fermentation time of three grasses of the genus Cynodon. In the early incubation times (up to 6 hours), the grasses showed similar cumulative gas production rates, however, from the 30 fermentation hours, Tifton 85 had a higher cumulative gas production compared to other grasses. Sá et al. (2011) studied the ruminal degradation kinetics parameters of
Brachiariabrizantha cv. Marandu, cut at 54 days, by
the in vitro gas production technique and reported
160.0 mLg-1 DM for the cumulative gas production
in the fermentation period of 96 hours. This value was lower than those found in this experiment for the different evaluated grasses.
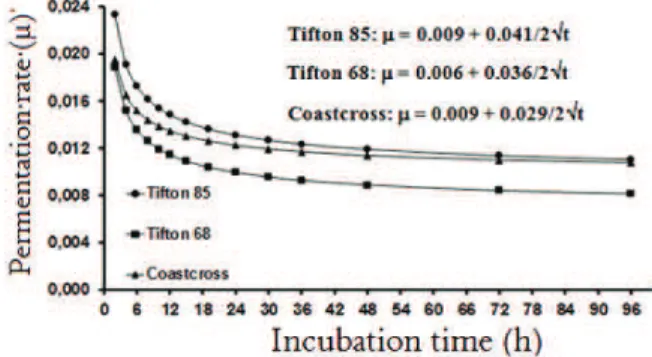
For the fermentation rate (µ) of grasses, after 6 incubation hours, mean values were 0.017; 0.015 and 0.013% per hour, respectively for Tifton 85, Tifton 68 and Coastcross (Figure 3).
fermentation rate (Van Soest, 1994; Monção et al., 2014). Velásquez et al. (2009) worked with fermentation rate, and after 6 hour incubation, observed higher values for Tifton 85 at 42 days and Tanzania grass at 28 days (0.052% and 0.050% hour-1).
Figure 3.Fermentation rate (µ) of dry matter according to incubation time of three grasses of the genus Cynodon.
There was effect (p<0.05) for the soluble fraction (a), potentially degradable insoluble fraction (b) insoluble fraction (FI), potential degradability (PD) and effective degradability of dry matter at passage rate of 5% hour-1(Table 2).
Table 2. Soluble fraction (A), potentially fermentable insoluble fraction (B), degradation rate (c), non-degradable fraction (FI), potential degradability (PD) and effective degradability (ED) of dry matter of three grasses of the genus Cynodon.
Grasses Parameters
A B c FI DP DE
Tifton 85 10.37a 61.69a 0.026a 27.98a 72.02a 31.25a Tifton 68 11.76a 63.90a 0.023a 24.34a 75.66a 30.71a Coastcross 8.03b 50.62b 0.031a 41.35b 58.65b 26.40b SEM 0.7214 2.2435 0.0024 2.6648 2.6648 0.4534 p value 0.004 0.000 0.100 0.000 0.000 0.000
Different lowercase letters in the same column are significantly different (p < 0.05) by Scott-Knott test. SEM-Standard Error of the Mean.
Tifton 85 and Tifton 68 showed higher values (p<0.05) for these variables in relation to Coastcross. No difference (p> 0.05) was detected for degradation rate ‘c’ of grasses, with a mean of 0.026% hour-1. Regarding degradation parameters,
the fraction ‘a’ is nutritionally represented by soluble carbohydrates of rapid ruminal degradation. The fraction ‘b’ is represented by cell wall components, of slow ruminal degradation, due to structural arrangements of these components with lignin. Monção et al., (2014) also studied the in situ
degradability of dry matter of five Cynodon grasses (Tifton 85, Jiggs, Tifton 68, Russel and Vaquero) and registered 21.3 and 21.9% for potentially degradable fraction in the rumen for Tifton 85 and Tifton 68, respectively. Moreover, for potentially degradable insoluble fraction (b), the authors found 46.21 and 48%, respectively, for Tifton 85 and Tifton 68. These values are not similar to those
observed in this study, which is normal because of soil and climate variations that, combined or individually, acts on the plant, causing morphophysiological changes.
Regarding potential (PD) and effective (ED) degradability of dry matter, Coastcross presented poorer results when compared to the other treatments and higher values for the non-degradable fraction (41.3%). It is noteworthy that genotypes Tifton 85 and Tifton 68 have high potential use in diets for ruminants in relation to Coastcross that presented PD values 18.6 and 22.48% lower than Tifton 85 and Tifton 68, respectively. This reduction was also verified in ED, 15.52 and 14%, respectively, which is not desirable, mainly dealing with animals with high nutritional requirements. High ED of substrate indicates higher availability of nutrients in the rumen for synthesis of short chain fatty acids and microbial protein (Van Soest, 1994). Lower PD and ED of Coastcross may be associated with the lower content of soluble carbohydrates, fraction (a) and components available for degradation of fiber, fraction (b), corroborated by the highest value of non-degradable fraction (FI), which was 58.06% higher than the mean value (26.16%) of Tifton 85 and Tifton 68.
Conclusion
Tifton 85 had higher values of fermentation kinetics and fermentation rates by the semi-automated technique of gas production.
Tifton 85 and Tifton 68 g showed better potential and effective degradability of dry matter.
Acknowledgements
To Unimontes and Fapemig for financial support and to CNPq and Capes for granting scholarships.
References
Faria, B. N., Reis, R. B., Maurício, R. M., Lana, A. M., Soares, S. R., Saturnino, H. M., & Coelho, S. G. (2008). Efeitos da adição de propilenoglicol ou monensina à silagem de milho sobre a cinética de degradação dos carboidratos e produção cumulativa de gases in vitro. Arquivo Brasileiro de Medicina Veterinaria e Zootecnia, 60(4), 896-903.
Ferreira, D. F. (2011). SISVAR: A Computer Statistical Analysis System. Ciência e Agrotecnologia, 35(6), 1039-1042.
em diferentes idades ao corte. Acta Scientiarum. Animal Sciences, 27(2), 189-197.
France, J., Dhanoa, M., Theodorou, M., Lister, S., Davies, D., & Isac, D. (1993). A Model to interpret gas accumulation profiles associated with in vitro
degradation of ruminant feeds. Journal of Theoretical Biology, 163(1), 99-111.
Marques, K. M. S., Rocha Júnior, V. R., Reis, S. T., Souza, V. M., Pires, D. A. A., Palma, M. N. N., ... Antunes, A. P. S. (2013). Cinética de fermentação in vitro de silagens da parte aérea de mandioca. Revista Brasileira de Saúde e Produção Animal, 14(1) 233-247.
Mauricio, R. M., Mould, F. L., Dhanoa, M. S., Owen, E., Channa, K. S., & Theodorou, M. K. (1999). A semi-automated in vitro gas production technique for ruminant feedstuff evaluation. Animal Feed Science and Technology, 79(4), 321-330.
Mauricio, R. M., Owen, E., Mould, F. L., Givens, I., Theodorou, M. K., France, J., Dhanoa, M. S. (2001). Comparison of bovine rumen liquor and bovine faeces as inoculum for an in vitro gas production technique for evaluating forages. Animal Feed Science and Technology, 89(1), 33-48.
Mehrez, A. Z., Ørskov, E. R., & McDonald, I. (1977). Rates of rumen fermentation in relation to ammonia concentration. British Journal of Nutrition, 38(3), 437-443.
Mertens, D. R., & Loften, J. R. (1980). The effect of starch on forage fiber digestion kinetics in vitro. Journal of Dairy Science, 63(9), 1437-1446.
Monção, F. P., Oliveira, E. R., Gabriel, A., Andréa, M., Souza, R., Moura, L. V., Santos, M. V. (2014). Degradabilidade ruminal de diferentes gramíneas do gênero Cynodon spp. em quatro idades de corte. Revista Brasileira de Ciências Agrárias, 9(2), 301-307.
Moreira, F. B., Prado, I. N., Cecato, U., Wada, F. Y., & Mizubuti, I. Y. (2004). Forage evaluation, chemical composition, and in vitro digestibility of continuously grazed star grass. Animal Feed Science and Technology, 113(4), 239-249.
Moreira, P. C., Reis, R. B., Rezende, P. L. D. P., Wascheck, R. D. C., Mendonça, A. C., & Dutra, A. R. (2010). Produção cumulativa de gases e parâmetros de France avaliados pela técnica semiautomática in vitro de fontes de carboidratos de ruminantes. Revista Brasileira de Saúde e Produção Animal, 11(2), 452-462.
Oliveira, E. R., Monção, F. P., Gabriel, A. M. A., Lempp, B., & Moura, L. V. (2014a). Ruminal degradability of neutral detergent fiber of Cynodon spp. grasses at four regrowth ages. Acta Scientiarum. Animal Sciences, 36(2), 201-208.
Oliveira, E. R., Monção, F. P., Gordin, C. L., Araújo, G. A. M., Lempp, B., Santos, M. V., ... Moura, L. V. (2014b). Degradabilidade ruminal da matéria seca de folhas e colmo de genótipos de Cynodon spp. em quatro idades de rebrota. Semina: Ciências Agrárias, 35(5), 2659-2672. Ørskov, E. R., & McDonald, I. (1979). The estimation of
protein degradability in the rumen from incubation measurements weighted according to rate of passage.
The Journal of Agricultural Science, 92(2), 499-503. Pell, A. N., & Schofield, P. (1993). Computerized
monitoring of gas production to measure forage digestion in vitro. Journal of Dairy Science, 76(4), 1063-1073.
Sá, J. F., Pedreira, M. S., Silva, F. F., Figueiredo, M. P., Rebouças, G. M. N., & Souza, D. R. (2011). Cinética da fermentação in vitro do capim-Marandu em diferentes idades de corte. Acta Scientiarum. Animal Sciences, 33(3), 225-231.
Statistical Analysis System. (2004). SAS/STAT User guide, Version 9.1.2. Cary, NC: SAS Institute Inc.
Theodorou, M. K., Williams, B. A., Dhanoa, M. S., McAllan, A. B., & France, J. (1994). A simple gas production method using a pressure transducer to determine the fermentation kinetics of ruminant feeds.
Animal Feed Science and Technology, 48(3), 185-197. Van Soest, P. J. (1994). Nutritional ecology of the ruminant.
Ithaca, NY: Cornell University Press.
Velásquez, P. A. T., Berchielli, T. T., Reis, R. A., Rivera, A. R., Dian, P. H. M., & Teixeira, I. A. M. D. A. (2009). Cinética da fermentação e taxas de degradação de forrageiras tropicais em diferentes idades de corte estimadas pela técnica de produção de gases in vitro.
Revista Brasileira de Zootecnia, 38(9), 1695-1705. Zeoula, L. M., Kassies, M. P., Fregadolli, F. L., Prado, I.
N., Caldas Neto, S. F., & Dalponte, A. O. (2000). Uso de indicadores na determinação da digestibilidade parcial e total em bovinos. Acta Scientiarum. Animal Sciences, 22(3), 771-777.
Zeoula, L. M., Prado, I. N., Dian, P. H. M., Geron, L. J. V., Caldas Neto, S. F., Maeda, E. M., ... Falcão, A. J. S. (2002). Recuperação fecal de indicadores internos avaliados em ruminantes. Revista Brasileira de Zootecnia, 31(4), 1865-1874.
Received on December 2, 2015. Accepted on February 23, 2016.