BJRS
BRAZILIAN JOURNAL
OF
RADIATION SCIENCES
08-03 (2020) 01-12 ISSN: 2319-0612 Accepted: 2020-09-02Thorium as a nuclear material: physics features and
a safety analysis due to insertion of ThO2 in a PWR
nuclear reactor fuel
Fonseca
1C.Jr., Oliveira
1C.L., Fonseca
1E.H.F., Medeiros
1M.P.C.,
Baptista
1C. O.E.
1Instituto Militar de Engenharia / Seção de Engenharia Nuclear (SE/7) [email protected]
ABSTRACT
On this paper it is presented the main physics features of the thorium as a nuclear material and a security analysis due to insertion of ThO2 in a PWR nuclear reactor fuel by the determination and assessment of the sensitivity coefficients through the Standardized Computer Analyses for Licensing Evaluation - SCALE 6.1 nuclear code system. This work was motivated by the world tendencies to research and development of nuclear fuels based on thorium, because the limitations of uranium resources and the importance of nuclear energy to the humanity.
The human development it is closely related to the level and type of power supply by us dominated. At the beginning of the last century it was discovered and controlled the nuclear fission energy the most productive source of energy available, anytime, anywhere.
The progress of nuclear energy research and development of the study about the exploitation of thorium as another nuclear material, besides the uranium, was initialized at the Oak Ridge National Laboratories - ORNL on EUA at mid 50’s years [1]. In Brazil, the first approach to the researchs about thorium as a nuclear material occurred during the commercial agreement between Brazil and France at the mid of the 60’s years and last, with the project codenamed Toruna, until the end of 60’s years and the 70’s beginning. The research continued under the cooperative agreement between Brazil and Germany [2]. The researches about thorium were interrupted until the 90’s years, when many countries resumed the research and development about the thorium utilization in nuclear power plants.
Currently there are 448 nuclear power reactors in operation and 59 under construction. Of the reactors in operation: 292 are of the Pressurized Water Reactor (PWR) type; 75 of the Boiling Water Reactor (BWR) type; 14 Gas Cooled Reactor (GCR); 49 Pressurized Heavy Water Reactor (PHWR); 15 Light Water Graphite Reactor (LWGR) and 3 of the Feast Breeder Reactor (FBR) type. Already under construction: 49 are PWR; 4 BWR; 4 PHWR; 1 FBR and 1 Hight Temperature Gas Cooled Reactor (HTGR), according to International atomic Energy Agency - IAEA [3]. In 2017, nuclear energy represented 11% of the world's energy matrix. In an extrapolated perspective, this percentage would be 12.4% in 2030, 13.4% in 2040 and 13.7% in 2050 [4].
Most power reactors, in operation or under construction, use uranium as fuel. With the implementation of new reactors and the increase in energy demand, especially clean energy generation, the demand for uranium is expected to continue to grow. With the 2017 reserve estimates and the level of demand for U in 2016, it is assumed that uranium resources will be sufficient to supply its global demand for another 130 years according to Organization for Economic Co-operation and Development - OECD [5].
The need for nuclear power coupled with the perspective of a horizon for uranium reserves leads to research and exploration of new resources. The most direct solution is thorium, which in addition to having facilitated exploration, due to the intrinsic characteristics of its ore, mainly thorium, is more abundant than uranium in the earth's crust and also presents complicating factors for proliferation. In Brazil, thorium natural reserves are among the largest in the world, IAEA – Nuclear Energy Agency - NEA [6].
1.1. Torium as nuclear material
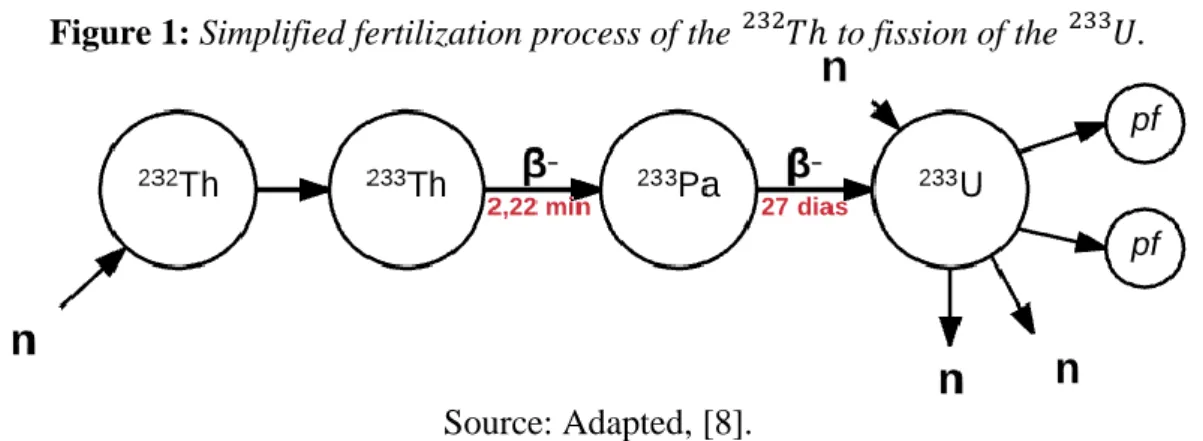
Thorium (Th) is the first nuclear material of natural occurrence, besides followed by uranium, and its natural abundance is on average 3.4 times greater than that of U. Its most recurrent isotope is 23290𝑇ℎ, a fertile isotope that when fertilized by a neutron, in a reaction of neutron-nuclear absorption, is transmuted into the fissile isotope o 23392𝑈 [7].
An illustration of the transmutation process of the 23290𝑇ℎ to the 23392𝑈 can be seen at the Figure 1.
Figure 1: Simplified fertilization process of the 232𝑇ℎ to fission of the 233𝑈.
Source: Adapted, [8].
Thorium dioxide is one of the most chemically stable solid substances, its melting point is one of the highest among the known, 2,023K - elementary and 3,643K - dioxide, specific mass 9,86g/cc, resistant to oxidation, thermal conductivity 43W⁄(m.K) - elementary or (6.2 W)⁄(m.K) at 773K - dioxide and 2.4W⁄(m.K) at 1773 K – dioxide [9] [10].
In order to perform a comparative analysis, Table 1 presents the neutronic properties of the main nuclear materials.
Table 1: Neutronic properties of the main fissile and fertile isotopes. Nuclears Data 𝟐𝟑𝟐𝑻𝒉 𝟐𝟑𝟑𝑼 𝟐𝟑𝟓𝑼 𝟐𝟑𝟖𝑼 𝟐𝟑𝟗𝑷𝒖 𝟐𝟒𝟏𝑷𝒖 Thermal Region Cross Sections [barns] Absortion 𝜎𝑎 4.62 364 405 1.73 1,045 1,121 Fission 𝜎𝑓 0 332 346 0 695.0 842 𝛼 = 𝜎𝑐⁄ 𝜎𝑓 - 0.096 0.171 0.504 0.331 𝜂𝑡ℎ - 2.26 2.08 1.81 2.23 Region of Resonance
Integral Epitermal (RI) [barns] (∝ 𝑑𝑖𝑙𝑢𝑡𝑖𝑜𝑛) 0 764 275 0 301 - 𝑅𝐼𝑎 85.6 882 405 278 474 740 𝑅𝐼𝑓 - 746 272 293 571 𝛼 = 𝑅𝐼𝑎⁄𝑅𝐼𝑓 - 0.182 0.489 0.618 0.296 𝜂𝑒𝑝𝑖 - 2.10 1.63 1.77 2.29 Neutronic Yield 𝜈 - 2.43 2.43 2.87 2.97 Delay Neutronic Yield 𝛽 - 0.0031 0.0069 0.0026 0.0050 Capture: 2.200 𝑚 𝑠⁄ 7.6 54 100 2.7 267 - Integral Resonance 85 140 144 275 200 - Average neutrons by fission 2.5 2.4 - - 2.9 Source: Adapted, [7]
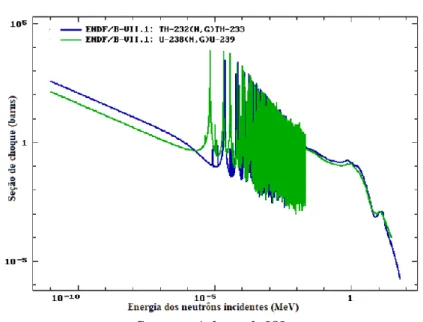
Analyzing Table 1 it can be verified that the absorption cross section of 232𝑇ℎ is two times greater than that of 238𝑈 indicating that in regenerative reactors the probability of conversion of 232𝑇ℎ to 233𝑈 is greater than 238𝑈 to 239𝑃𝑢. The behaviour of the 232𝑇ℎ and 238𝑈 neutron capture cross sections with respect to the energy of the incident neutron is shown in Figure 2.
Source: Adapted, [8].
For comparative purposes, the behavior of the fissile isotope neutron capture cross sections 𝑈
233
, 235𝑈 and 239𝑃𝑢 is presented in Figure 3.
Figure 3: Cross section spectrum for the isotopes 233𝑈,235𝑈 and239𝑃𝑢.
Source: Adapted, [8].
One approach to determine how to a perturbation or change in some specific parameter or feature of the nuclear reactor affects the stead state of its operation, for example the response of the neutron multiplication factor due to a change in the coolant/moderator temperature of a PWR nuclear reactor, is to evaluate the so called sensitivity coefficients. According to this, the well stablished linear perturbation theory can be used to determine the effects of a perturbation in the reactivity and, therefore in the safety of a nuclear reactor due to that perturbation, [11]. A simplified theoretical approach to the linear perturbation theory is presented by DUDERSTADT (1976) [12].
2. MATERIALS AND METHODS
To perform the sensitivity analysis of the neutron multiplication factor, in this work the infinite neutron multiplication factor - 𝑘𝑖𝑛𝑓, it was used the nuclears code system SCALE 6.1.
One of its control modules, the TSUNAMI – Tools for Sensitivity and UNcertainty Methodology Implementation, accomplishes the sensitivity analysis.
TSUNAMI modules, by allowing the analysis of a system intrinsically, performs an internal computational analysis with its own method. However, it is possible to repeat the simulations with changes in some of the data parameters of the input file allowing an analysis of the influence of this change in the sensitivity and uncertainty due to the variable object of the study [8]. The extrinsic factor chosen to be varied in this work is the temperature of the refrigerant, maintaining constant the temperatures of the other components of the fuel, and it was performed the analysis of the behavior of the 𝑘𝑖𝑛𝑓, the sensitivity and the uncertainty for
all the materials and regions and fuel due to the change.
For this work just the sensitivity will be considered in the analysis, disregarding the fuel burn-up. It was chosen the nuclear power plant data of Angra II, wich has three levels of fuel enrichment, in terms of the isotopic concentration of 235𝑈, 1.95%, 2.5% and 3.2% and for this work was take just the 2.5% and 3.2% of levels of enrichment, considering the first FSAR – “Final Safety Analyses Report” [13].
As the fuel to be analyzed is a mix of UO2 and ThO2 it was verified that it should be
necessary to calculate the relative quantities of each elements from the fuel mix, as presented on Tables 2 and 3 at the Chapter 3 of this paper results. To achieve this goal it was selected an approach by stoichiometric balance, which one was done by the following equations, where the parameter ‘𝑥’is the weight percent (%wt) of ThO2 at the fuel mix, ‘𝑒’ is the enrichment of
uranium and ‘M’ is the molar mass of the dioxides.
M𝑡𝑜𝑡= 𝑥. M𝑇ℎ𝑂2 + (1 − 𝑥). M𝑈𝑂2. (1)
x. M𝑇ℎ𝑂2 = x. M𝑇ℎ+ .2 𝑥. (0,997. M𝑂16+ 0,003. M𝑂17) (2)
(1 − x). M𝑈𝑂2 = (1 − 𝑥). 𝑒. M𝑈235 + (1 − x). (1 − 𝑒). M𝑈238
+ (1 − 𝑥). 2. (0,997. M𝑂16+ 0,003. M𝑂17) (3)
At the end of the Eq. (3) it was specified the percent of each isotopes of the fuel mix. To calculate the density of the different full mix was choose a weighted averaged by the %wt 𝑇ℎ𝑂2.
ρ [𝑔⁄𝑐𝑚3] = 𝑥. ρ𝑇ℎ𝑂2 + (1 − 𝑥). ρ𝑈𝑂2
(4)
Considering the input data of the fuel composition it was chosen the temperature range from 280K to 345K to perform the simulations, and the range of %wt of ThO2 from 0%wt to
40%wt. The SAMS, the SCALE functional modules to evaluate the sensitivity and uncertainty, as a subroutine of TSUNAMI, generate two different sensitivity coefficients: one explicit, due to the perturbations inserted, and the other came from the statistical analyses of the error propagation on the calculation of the 𝑘𝑖𝑛𝑓. The sum of the two coefficients results in the total sensitivity coefficients estimated for each region characterized material or mixture. These results are presented in the form of graphics and tables on Chapter 3.
3. RESULTS AND DISCUSSION
Tables 2 and 3 below presents the composition of the fuel mix to both levels of enrichment including different percent mass of ThO2.
Table 2: Fuel mix composition in [%wt] to 2.5% of enrichment. %ThO2 Comp. 0 5 10 15 20 25 30 35 40 Total Mass [g] 269.93 269.63 269.34 269.04 268.75 268.45 268.15 267.86 267.56 Mix Density [g/cc] 10.96 10.91 10.85 10.80 10.74 10.69 10.63 10.58 10.52 %U-235 2.18 2.07 1.96 1.86 1.75 1.64 1.53 1.43 1.32 %U-238 85.97 81.76 77.54 73.31 69.08 64.83 60.58 56.31 52.04 %O-16 11.82 11.83 11.85 11.86 11.87 11.88 11.90 11.91 11.92 %O-17 0.04 0.04 0.04 0.04 0.04 0.04 0.04 0.04 0.04 %Th-232 0.00 4.30 8.61 12.93 17.27 21.61 25.96 30.31 34.68 Source: Authors.
Table 3: Fuel mix composition in [%wt] to 3.2% of enrichment. %ThO2 Comp. 0 5 10 15 20 25 30 35 40 Total Mass [g] 269.93 269.63 269.34 269.04 268.75 268.45 268.15 267.86 267.56 Mix Density [g/cc] 10.90 10.91 10.85 10.80 10.74 10.69 10.63 10.58 10.52 %U-235 2.79 2.65 2.51 2.38 2.24 2.10 1.96 1.82 1.69 %U-238 85.35 81.17 76.98 72.79 68.58 64.37 60.14 55.91 51.66 %O-16 11.82 11.83 11.85 11.86 11.87 11.88 11.90 11.91 11.92 %O-17 0.04 0.04 0.04 0.04 0.04 0.04 0.04 0.04 0.04
Source: Authors.
Analyzing Tables 2 and 3 it is observed that the fuel mix compositions in terms of relative percent mass was satisfactorily estimated. Once that the sum of each one relative mass for each one elements and setup it is total in 100.
In order to optimize the results presentation, it was chosen only the fuel compositions that results in kinf values above, approximately, 1.2 once that in the Wichrowski (2017) works it
was observed that the criticality just is achieved according to this condition. An evolutive assessment of the kinf evolution according to the rise of the %wtThO2 at the fuel mix it is
presented in Table 4.
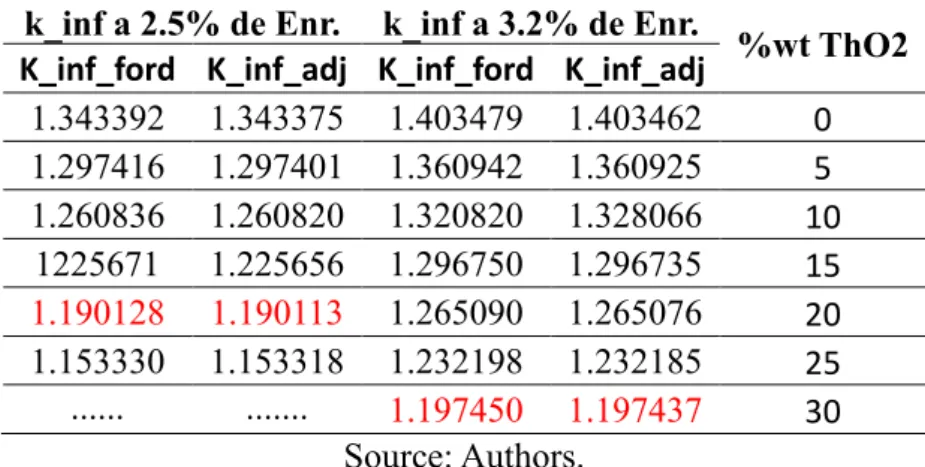
Table 4: Evolutive analyzes of kinf behavior due to the increase of %wtThO2 at the fuel mix.
k_inf a 2.5% de Enr. k_inf a 3.2% de Enr.
%wt ThO2 K_inf_ford K_inf_adj K_inf_ford K_inf_adj
1.343392 1.343375 1.403479 1.403462 0 1.297416 1.297401 1.360942 1.360925 5 1.260836 1.260820 1.320820 1.328066 10 1225671 1.225656 1.296750 1.296735 15 1.190128 1.190113 1.265090 1.265076 20 1.153330 1.153318 1.232198 1.232185 25 ... ... 1.197450 1.197437 30 Source: Authors.
In the Table 4, kinf-ford is the one calculated by one of the modules of TSUNAMI and kinf_adj
is the, also calculated by one module of TSUNAMI, one used by the General Perturbation Theory to determine the sensitivity of the system.
It should be observed in the Table 4 that are values of kinf highlighted in red, they represent
the maximum value, at the level of enrichment, that make possible to achieve the reactor criticality. Based on these values, Tables 5 and 6 present the results for the sensitivity of the fuel mix to the thorium dioxide insertion in the PWR fuel mix. The results in red are for the temperature used as the basis for the study.
Table 5: Sensitivity Coefficients to the Fuel Mix at 2.5% of Enrichment. Temp.
[K]
%wtThO2 at the Fuel Mix
0 5 10 15 20 25
280 -2.04E-02 -2.87E-02 -3.06E-02 -3.05E-02 -2.89E-02 -2.61E-02 290 -2.04E-02 -2.87E-02 -3.06E-02 -3.05E-02 -2.89E-02 -2.61E-02
300 -2.03E-02 -2.87E-02 -3.05E-02 -3.05E-02 -2.88E-02 -2.60E-02
310 -2.02E-02 -2.85E-02 -3.04E-02 -3.03E-02 -2.87E-02 -2.59E-02 320 -2.01E-02 -2.84E-02 -3.03E-02 -3.02E-02 -2.85E-02 -2.57E-02 330 -2.00E-02 -2.83E-02 -3.02E-02 -3,00E-02 -2.84E-02 -2.56E-02 340 -1.99E-02 -2.82E-02 -3.00E-02 -2.99E-02 -2.82E-02 -2.54E-02 345 -1.98E-02 -2.81E-02 -3.00E-02 -2.98E-02 -2.81E-02 -2.53E-02
Source: Authors.
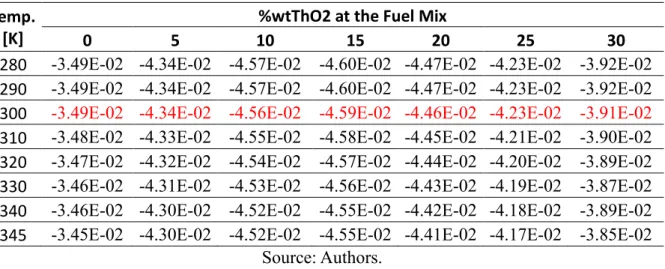
Table 6: Sensitivity Coefficients to the Fuel Mix at 3.2% of Enrichment. Temp.
[K]
%wtThO2 at the Fuel Mix
0 5 10 15 20 25 30
280 -3.49E-02 -4.34E-02 -4.57E-02 -4.60E-02 -4.47E-02 -4.23E-02 -3.92E-02 290 -3.49E-02 -4.34E-02 -4.57E-02 -4.60E-02 -4.47E-02 -4.23E-02 -3.92E-02
300 -3.49E-02 -4.34E-02 -4.56E-02 -4.59E-02 -4.46E-02 -4.23E-02 -3.91E-02
310 -3.48E-02 -4.33E-02 -4.55E-02 -4.58E-02 -4.45E-02 -4.21E-02 -3.90E-02 320 -3.47E-02 -4.32E-02 -4.54E-02 -4.57E-02 -4.44E-02 -4.20E-02 -3.89E-02 330 -3.46E-02 -4.31E-02 -4.53E-02 -4.56E-02 -4.43E-02 -4.19E-02 -3.87E-02 340 -3.46E-02 -4.30E-02 -4.52E-02 -4.55E-02 -4.42E-02 -4.18E-02 -3.89E-02 345 -3.45E-02 -4.30E-02 -4.52E-02 -4.55E-02 -4.41E-02 -4.17E-02 -3.85E-02
Source: Authors.
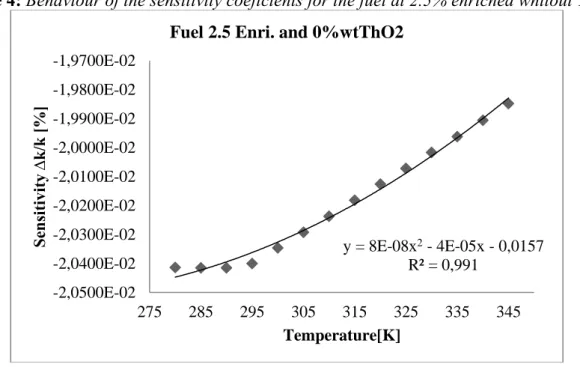
Graphically the behavior due to the fuel sensitivity coefficients can be plotted and studied. Figure 4 and 5 are examples.
Source: Authors.
Figure 5: Behaviour of the sensitivity coeficients for the fuel 3.2% enriched and 25%wtThO2.
Source: Authors.
It is should be noted that the sensitivity coefficients rise up whith the increase of the %wtThO2 in the fuel mix likewise for the increase on the moderator temperature. These facts combined demonstrate that the insertion of ThO2 on the PWR fuel mix increase the intrinsic safety of the nuclear reactor. From Graphs 3 and 4 it is possible to see that the sensitivity coefficients presented a polynomial quadratic behavior, according to the increase in the moderator temperature, confirmed by the correlation coefficient tending to one.
y = 8E-08x2- 4E-05x - 0,0157 R² = 0,991 -2,0500E-02 -2,0400E-02 -2,0300E-02 -2,0200E-02 -2,0100E-02 -2,0000E-02 -1,9900E-02 -1,9800E-02 -1,9700E-02 275 285 295 305 315 325 335 345 Sensi ti vi ty ∆ k/k [% ] Temperature[K] Fuel 2.5 Enri. and 0%wtThO2
y = 8E-08x2- 4E-05x - 0,0373 R² = 0,9907 -4,2500E-02 -4,2400E-02 -4,2300E-02 -4,2200E-02 -4,2100E-02 -4,2000E-02 -4,1900E-02 -4,1800E-02 -4,1700E-02 -4,1600E-02 275 285 295 305 315 325 335 345 Sensi ti vi ty ∆ k/k [% ] Temperature [K] Fuel 3.2% Enri. and 25%wtThO2
4. CONCLUSION
According to the results obtained by the simulations, it can be verified that the 𝑘𝑖𝑛𝑓 is very
sensitive to the variation in the ratio moderator/coolant of a PWR nuclear reactor, at least in the temperature range studied, as was also noticed by Neto (2015). Another point to be observed is that in the evolutive assessment of the behavior of the 𝑘𝑖𝑛𝑓, due to the increase of
ThO2 at the fuel mix (Table 4), it is possible to confirm that is necessary an increase at the
enrichment as the %wtThO2 on the fuel composition increases, due to the behavior of the
thorium, that, initially, acts like an absorber in the process of conversion in 233𝑈.
In terms of the safety assessment by the sensitivity analyses, it is shown that the increase of thorium dioxide at the fuel composition of a PWR has not a linear behavior with the sensitivity, once that the sensitivity initially increases with the increase of ThO2 and, after a certain amount of ThO2, it starts to decreases. Although all of the sensitivity coefficients whit the addiction os ThO2 are higher than those fuel mix without thorium insertion. Another point that needs attention is the 𝑘𝑖𝑛𝑓 behavior and values, presented on Table 4, it shows that it is
not possible to apply this configuration of fuel since that the 𝑘𝑖𝑛𝑓 is less than 1.2 even in the
absence of the absorbers or burnable poisons, like the settings used in the setup of the simulations.
This work shows that it is perfectly possible to use thorium and uranium oxides in a mix as fuel material in a Pressurized Water Reactor.
REFERENCES
[1] WICHROWSKI, C. Caio. Análise do tório como combustível para reatores nucleares. Instituto Militar de Engenharia (IME)- EB, Brasil, Dissertação de Mestrado, 2017.
[2] PINHEIRO, B. Ricardo. Brazilian Experience on Thoriun Cycle Investigations, Centro de Desenvolvimento da Tecnologia Nuclear, Belo Horizonte, Brazil, THORIUN FUEL UTILIZATION: OPTIONS AND TRENDS, Proceeeding of tree IAEA meeetings held in Vienna in 1997, 1998 and 1999. IAEA – TECDOC – 1319.
[3] AIEA. Nuclear Power Reactors in the World. International Atomic Energy Agency, Vienna. Disponível em: < https://www-pub.iaea.org/MTCD/Publications/PDF/RDS-2-38_web.pdf>, 2018.
[4] IAEA. International Satatus and Prospects for Nuclear Power 2017. Bord of Governors General Conference, 2017.
ganization for Economic Co-Operation and Development. OECD iLibrary, 2018. [6] NEA. Uranium 2016: Resources, Production and Demand. A Joint Report by the Nuclear
Energy Agency and the International Atomic Energy Agency. Avaible in: < https://www.oecd-nea.org/ndd/pubs/2016/7301-uranium-2016.pdf>, 2016.
[7] IAEA. Thorium fuel cycle — Potential Benefits and Challenges. Nuclear Fuel Cycle and Materials Section International Atomic Energy Agency. Viena, Áustria, 2005, TECDOC-1450. ISBN 92–0–103405–9. ISSN 1011–4289.
[8] GONÇALVES, C. Isadora.Tório e suas aplicações nucleares. Instituto Militar de Enge-nharia (IME)- EB, Brasil ,Dissertação de Mestrado, 2017.
[9] BELLE, J.; Berman, R. M.. Thorium dioxide: Properties and Nuclear Applications. Naval Reactors Office, Washington, D.C.:, United States Dept. of Energy, 1984.
[10] LIDE, David R.. CRC Handbook of Chemistry and Physics 71ST Edition. A Ready Refer-ence Book of Chemical and Physical Data, Boston EUA, .1990-1991. CRC Press, Boca Raton ann Arbor.
[11] LAMARSH R. John. Introduction to Nuclear Reactor Theory, Addison-Wesley Publish-ing Company, Inc. ReadPublish-ing, Massachusetts. New York University, 1966.
[12] DUDERSTADT J. James, HAMILTON J. Louis. Nuclear Reator Analysis. Departmnet of Nuclear Engineering, University of Michigan, Ann Arbor, Michigan. Jonh Wiley & Sons, Inc. New York, , 1976.
[13] NETO, G. Ilson. Análise das Simulações de Perturbações em Reatores Nucleares Usando o Código SCALE 6.1. Instituto Militar de Engenharia (IME)- EB, Brasil, Dissertação de Mestrado, 2018.
![Table 3: Fuel mix composition in [%wt] to 3.2% of enrichment.](https://thumb-eu.123doks.com/thumbv2/123dok_br/18274813.880915/7.892.111.790.952.1174/table-fuel-mix-composition-wt-enrichment.webp)