A comparative Investment Analysis: Is it better to
invest in venture capital or in the motion picture
industry?
Victor José Lasaygues
Project (or Dissertation) submitted as partial requirement for the
conferral of the Master in Global Management
Supervisor: Prof. Joao Rosario, Professor Auxiliar Convidado,
Departamento de Finanças Escola de Gestão
i
Spine
A
co
mp
ara
ti
v
e I
n
v
es
tmen
t A
n
al
y
si
s:
Is
it
b
et
ter t
o
i
n
v
es
t i
n
v
en
tu
re ca
p
it
al
o
r i
n
t
h
e
mo
ti
o
n
p
ic
tu
re i
n
d
u
st
ry
?
V
icto
r J
o
sé La
sa
y
g
u
es
ii
Abstract
Keywords: Motion Picture Industry, Venture Capital investment, Investment Decision, Yield JEL Classification: G110 Portfolio Choice: Investment Decision
i. English
This paper analyses and compares the profitability and risks of the movie industry against venture capital investment.
For the movie industry, by studying the data of 524 movies made by 13 studios from 2011 to 2014.
For venture capital investments by collecting insight on the profitability of venture capital investment from seven academicals articles.
The study suggests that both industry exhibit similar pattern in term of dispersion, but that movie industry is more profitable than venture capital investment. At the same time the higher profit of the movie industry result also in higher risks for the investors, making this industry only desirable for investors looking for an aggressive investment strategy.
ii. Portuguese
Este trabalho analisa e compara a rentabilidade e riscos da indústria do cinema contra os investimentos em Venture Capital.
Para a indústria do cinema, estudando os dados de 524 filmes feitos por 13 estúdios 2011-2014.
Para o Venture Capital através da recolha de datos sobre a rentabilidade dos investimentos Venture Capital a partir de sete articulos academicos.
O estudo sugere que as duas indústria apresentam padrão semelhante em termos de dispersão, mas que a indústria do filme é mais rentável do que o Venture Capital. Ao mesmo tempo, a indústria do cinema tem tambem mais riscos para os investidores que o Venture Capital. A Indústria do cinema esta só desejável para investidores que procurem uma estratégia de investimento agressivo.
iii
Acknowledgment
Thanks to Joao Rosario, my supervisor, for his support and enthusiasm for my project, he gave interesting insight which helps me to challenge and to improve my master thesis Thanks to Peter Cools, who motivate me, to finish my essay.
iv
Table of Contents
I. Introduction ... 1
II. Literature Review ... 4
1. Venture Capital ... 4
a) Context ... 4
b) The Venture Capital Structure ... 5
c) Upfront and Stage investment ... 6
d) Trade-off between Venture capital or other sources of investments ... 6
e) Profitability of Venture Capital ... 8
f) Risk of Venture Capital Investment ... 13
2. Movie Industry ... 15
g) Creation process ... 16
h) Motion Picture classification: ... 17
i) Risks for the motion picture industry ... 18
j) Joint-Venture ... 19
k) Factors of success and movie portfolio ... 19
l) Forecasting movie revenues ... 22
III. Research Methodology & Objectives ... 26
3. Methodology ... 26
m) Venture Capital ... 26
n) The movie industry ... 27
o) Precision regarding the selection of the data, and its analysis ... 27
p) Financial Analysis ... 28
q) Objectives ... 30
IV. Results ... 31
v
5. General Observations on the Movie Industry ... 32
r) Market Share ... 32
s) Financial Capability : Investment ... 33
t) Profitability ... 34 u) Breakeven ... 35 v) IRR ... 35 w) Volatility ... 36 x) Conclusion ... 41 V. Discussion ... 43
6. On the movie industry. ... 43
y) High budgets vs. low Budget ... 43
z) Breakeven of movies ... 43
aa) Blockbusters vs. Sleepers ... 44
bb) Movie genre ... 45
cc) Movie Industry vs. Venture Capital ... 46
VI. Conclusion ... 48
VII. References ... 52
1
I. Introduction
The movie industry is a lucrative industry, in 2015 $ 40BN where braced from the Box offices Revenues Worldwide, 708 movies were released, and over 1,321 million of persons went to the cinema in 2015 in the US.(MPAA 2015)
Due to the amount of money braced in motion picture, this industry is highly appealing for the investors. Nevertheless, the investment opportunity for outsider investors is limited, almost non-existent. Over the year single actions by one or two actors of the movie industry have enabled individuals to invest in a movie.
In 1994, Actor Paul Hogan decided to finance his movie through the selling of shares of his movie on the Australian stock market. The film; succeed to raise the amount needed to be produced but was a disaster at the box office. (Independent 1994)
Then in 2003, the studio's Civilian picture put on the market 900 000 Shares at 8.75 apiece to finance one of its movies. (CNN Money 2003)
However, those two examples do not show a defining trend in the industry and are only the initiative of one or two stakeholders in the movie industry.
However, in July 2016, China Film Co, The largest movie distributor of China, announced that it plans to raise $ 625M in an Initial public offering. This funds will be used to fund movie production (Bloomberg 2016). This IPO could be the largest IPO for the entertainment industry and can, therefore, start a new trend where movie capital will be opened to outsider’s investors.
Nevertheless is it worth it to invest in the movie industry? Is it really profitable and to which extend? The existing literature review focuses mainly on the revenue generated in this industry but does not focus on the profitability of it. One explanation given by Pokorny and Sedgewick (2001) is the fact that limited data on a movie cost is unavailable.
In this Dissertation, our aim is to analyse the profitability of the motion picture industry their profitability from a financial perspective, and then to compare it to the financial market in order to see if it is worth it to invest in the motion picture industry.
2 During one of our previous essay, we compared the profitability of the movies released by four studios during the year 2012 against the return of four stock market indexes (S&P 500, Nasdaq, Dow Jones, Russell 2000). We found that the movie industry was riskier but also more profitable than the stock market return. However, from our analysis, we encountered that motion picture industry was subject to an important dispersion of its distribution (“fat tail distribution”), whereas the different indexes of the stock market were more uniform. Therefore this comparison was not making any sense as the two subjects were having a highly different pattern. This is why we have decided to compare the motion picture industry against Venture Capital investment.
Venture Capital Investments are an important part of the economy, in 2010 Venture Capital investment accounted for $ 30BN. (Da Rin, M., Hellman, T., Puri. M., 2013)
However, this industry is also highly risky as Hall and Woodward (2010) demonstrate only one out of four Venture Capital investment is able to generate a profit. We can thus expect Venture Capital revenues to also have a fat tail distribution.
Our aim is to determine is it better for an investors better to invest in the movie industry or
in Venture Capital investments?
In order to do that we will collect secondary material on the motion picture industry from 13 studios over a 4 years period (2011-2014). We will also accumulate secondary material from the existing literature review on venture Capital investment. Subsequently, we will be able to analyse the trends in the two sectors and to determine which one is most profitable.
Firstly we will first identify the main findings in the literature review for Venture capital investments where we will look at the industry background, the industry’s trends, the financial profitability and the risk which we will illustrate with the dot.com bubble. Attached to that we will establish the main findings in the Movie industry in the same way we did for the Venture Capital by looking at the trends, the profit and at the risk of the industry, and we will also highlight the forecasting tools which exist for this industry.
In a Second part, we will explain how we realized our sample selection, the databases we used, the indicators we retained for the analysis and the objectives of this dissertation.
3 In a third part, we will describe the analysis’s results, by focusing on the profitability and on the volatility of the two industries.
In a fourth part we will discuss our findings and put them in link with the previous literature review, it will enable us to gain perspective on the issue and we will be able to state which industry is the most profitable in regards to the risk undertaken.
4
II. Literature Review
Our Dissertation is related to the motion picture industry and to Venture Capital. There is no academicals research at our knowledge that are studying those two fields together. Therefore in order to reveal the trends in the literature for those two fields of study, we will have to consider them separately. We will first start by studying the literature review for the field of Venture Capital Investment and then we will focus on the motion Picture industry.
1. Venture Capital
a) Context
In this part, we will highlight the main findings of the academic literature on Venture Capital Investment by focusing especially on Venture Capital profitably and risks.
According to Da Rin, Hellman and Puri (2013) "Venture Capital is: "the professional asset management activity that invests funds rose from institutional investors, or wealthy individuals, into promising new ventures with a high growth potential.” (p. 573°)
Da Rin excludes of its definitions Business Angels and also other forms of intermediate Investment such as Buyout or Mezzanine financing1 and also any form of Entrepreneurship Investment.
According to Benson and Ziedonis (2010), Venture Capital investment started in the late 1970, as some changes in the regulations lead to the development of important investment in companies by Venture Capitalist and also by other firms. According to Venture Economics from 1980 to 2003, $ 40BN was invested in Company, and over 450 Companies had a Venture Capital programs in 2000.
Venture Capital as a financial product has fluctuated according to the economic conjecture. Especially during the 1987 Crash and the 2000 dot.Com bubbles which has affected negatively Venture Capital investment.
1 Buyout: Acquisition of a company
Mezzanine Financing: Debt capital that gives the right to the lender to convert its debt to Equity or ownership interest if the company failed to pay the loan.
5 Da Rin Explained that in 1980 the amount of Venture Capital invested accounted for $ 610M in the US, in 1990 this amount had increased to $ 2.3 BN, it reached over $ 100 BN during the Dot.com bubble before quickly collapsing. In 2010, the amount invested is estimated at $ 30 BN.
The dot.com bubble affected Venture Capital investments because they focus on the technological sector.
Kortum and Lerner (2000) Shows that Venture capital investment tends to prefer sector with a high patent production such as information technology firms (I.T), life sciences, and Renewable energy.
Cockburn and MacGarvie (2009) also found that companies with a high number of patents are more likely to be backed by Venture Capital.
Amit, Brander, and Zott (1998) explained that Venture capital investment focus on the industry with High information asymmetry and therefore offer a high opportunity for growth due to the higher risk. As Krohmer, Lauterbach Calanog (2009) shows in their results, the IT and telecommunication sectors are the one with the highest mean in term of Internal rate for return but also with the highest Standard deviation and so the highest volatility.
b) The Venture Capital Structure
Da Rin explains the traditional structure of Venture Capital firms. To make their different investments Venture capital firm will need to raise money, and for this purpose they will mainly rely on the creation of a “funds” (Venture Capital Fund). Then the Venture Capital firm will raise money from institutional investors and also from individual.
However, we must also differentiate the different kind of Venture Capital such as Corporate Venture Capital, bank venture Capital and Government sponsored venture Capital.
Corporate Venture Capital, refer to firms making Venture Capital investment. Those firms are looking for a the financial gain, but also the gain of a competitive advantage advantages, such as the Acquisition of Knowledge or the acquisition of a complementary technology to their core activity the creation which would result in a Synergy with the entrepreneur. Hellmann and Puri (2002)
6 Hellmann and Puri (2002) also explained that Bank can also do Venture Capital in this case; we will speak about Bank-Owned Venture Capital.
Banks are looking for Investment opportunity and tend to operate in industry with higher debt and leverage levels, therefore in industry in need for a loan. (Hellmann, Lindsey and Puri 2008)
The last form of venture Capital is Government sponsored Venture Capital firms. Government can support VF firm in a different way with Tax reliefs, or with direct investment in an entrepreneur. The main objective for the government will be the investment in the local economy, the creation of jobs, and also to develop the technology at a local and national level. (Lerner, 2008)
c) Upfront and Stage investment
When the Venture Capitalist has agreed on the amount of money they which to invest in an entrepreneur, they need also to decide whether they provide all the investment money up front or if they want to deliver it at different financial rounds (Staged investment). Bergemann, Hege and Peng (2009)
Staged investment can either be delivered according to specific time lime or when the entrepreneur succeeded in fulfilling specifics milestones.
According to Bergemann, Hege and Peng (2009) staging will be preferred in a high-risk venture as it will act as a hedging tool against the information asymmetry. As explained by Krohmer, Lauterbach and Calanog (2009) the staging investment will empower the investors with time to learn about the management team, to study the company’s and the entrepreneur strengths and weaknesses and also to assess the future prospects.
According to Bergemann, Hege and Pen (2009), the staging investment will also reduce the risks as the investors will be able to invest more money in a company only when specific milestones have been reached and therefore when the risks have decreased.
7 For an entrepreneur, Venture Capital investments have advantages that other forms or investment are not able to offer.
For De Bettignies and Brander (2007) the main advantage of Venture Capital it that offers Equity type of investment whereas bank offers debt investment.
Also, Ueda (2004) explained that Venture Capital investment may require less collateral than bank financing, as the VC investors are more prone to accept a higher risk in exchange for higher return. Therefore entrepreneurs with high risks but low collaterals may seek Venture Investment to raise fund.
However, the entrepreneur must keep in mind that by letting a company entering in it equity, the entrepreneur may be the victim of a hold-up. Indeed by letting a company gaining equity this also mean that the Venture investors will have some control right over the company. This control can increase to the point where the entrepreneur will be left with no control over its own company and will become a puppet of the Venture Capital. The investors may also decide to choose a superior manager and replace the entrepreneur (Hellman, 1998). The probability of replacing the entrepreneur by a professional CEO increases by twice when the company was firstly backed by Venture Capital investments. (Hellmann and Puri, 2002) De Betonies and Brander (2007) explain that the main advantages of venture Capital for the entrepreneur is the value added to the company, such as knowledge, professional practices, and an increase in visibility on the market.
The gain in Knowledge: Venture Capital investors will be able to provide network and industry information to the entrepreneur which are critical for his development in the early phase of development. (Sorenson and Stuart, (2001).
Mentorship: Venture Capital investor will also being able to provide mentorship to the entrepreneur to enhance the venture performance and decreased the risks. (Hsu,
2006).
Professional Practice: Hellmann and Puri (2002) argue that a venture Backed Company will develop more professional practices such as the use of professional recruiter to develop their manpower.
8 Quicker IPO: VC endorsement will help the entrepreneurs to gain visibility on the
market. It will increase and quicken the chance of success of the entrepreneurs and the probability of a successful IPO.(Stuart, Hoang, and Hybels, 1999)
Overall Venture Capital will be able to decrease the risk for the entrepreneurs due to the gain in knowledge, best practice, and visibility on the market which will increase the probability of a successful IPO for the entrepreneurs.
On the contrary, business angels will not be able to offer those advantages, and also would not have the investment capabilities needed.
Chemmanur and Chen (2006) explained that business angels will offer fewer advantages than Venture Capital as they would not be able to add any value. Furthermore, according to Chemmanur and Chen (2006), some entrepreneurs begin with angel investment but at a later stage of development of their company they switch to Venture Capital investment due to its higher financial capabilities.
To conclude Goldfarb et al. (2009) explained that entrepreneurs who are patient and you want to keep the control over their company will choose Business angel investment whereas entrepreneurs who want to add more values to their company and a quick IPO will choose Venture Capital investment.
e) Profitability of Venture Capital
In this part, we will discuss the profitability of the Venture Capital investment from the financial point of view, but firstly we need to explain the outcome of Venture Capital Company with the explanation of Exit events.
i. Exit Events
One of the most important stage of Venture Capital investment will be the Exit events. Exit can be positive for investors such as in the case of an IPO or and Acquisition by another company but it can also be disastrous in the case the Venture-backed company failed and go bankrupt. Investors are looking for successful IPO or the sales of portfolio company to a third party as it will results in an important profit. (Phalippou and Gottschalg, 2009).
9 As we have seen, one determinant for positive exit event depends whether the company is backed by corporate venture capital or by private Venture Capitalist. Stuart, Hoang, and Hybels (1999) found that Venture Company backed by corporate investor launch IPO more quickly and with a higher valuation than Venture Company backed by Independent Venture investors.
Maulas and Murray (2002) agreed with the findings of Stuart, Hoang, and Hybels (1999) as they also found that companies backed by corporate investors have a higher market valuation than company backed by independent investors.
However (Gompers and Lerner, 2000) are more critics about this question as for them an independent venture company is at least as successful as a corporate venture company.2 Finally, Cockburn and MacGarvie (2009) found that companies with a higher number of patents are more likely to be successful in their exits events.
Exit events can also be dramatic for the companies in case of the failure of the venture-backed company, or if the investors withdraw their investments or also when venture-venture-backed company turned into “a living dead”.
Phalippou and Gottschalg (2009) explained the term living dead as a fund or a company that is self-sustaining, but that do not generate important profit or loss for an extensive period of time. Therefore they failed to achieve appealing return rate for investors or enough losses to become bankrupt. Those “living dead” can stagnate in this situation during an extensive period of time.
ii. Financial and Economic perspective
The two mains Commercial Database used by Researchers are Thomson One and Venture Source. Researchers have also hand-collect data through interview and Field study, as Da Rin high point out one of the most ambitious attempt in hand collection Data, was made by (Robb et al., 2010) who collected data for more than 5000 company.
2 Gompers and Lerner (2000) used as success factor a company going public or being acquired for twice its value.
10 In order to assess the financial profitability of Venture Capital investment different indicators are considered, the most commonly used are:
Gross Returns: The returns earned by a VC fund by investing in portfolio companies.
Net returns: The returns earned by Investors who invested in VC funds.
IRR: It is defined as the discount rate which makes the Net Present Value (NPV) of a stream of cash flows equal to zero
PME: The PME is defined as the ratio of the return value to the VC investments over the return value of the public market investment. A ratio higher than one means the venture investment has returned a higher amount than a corresponding investment in the public market.
Standard deviation: in order to assess the dispersion of the distribution, and the volatility.
However we do not have access to “Thomson one” or to “Venture Source” as they are commercial Database.
Therefore to be able to assess the financial profitability of Venture Capital investment we decided to rely on secondary information gathered by different academicals articles on this matter:
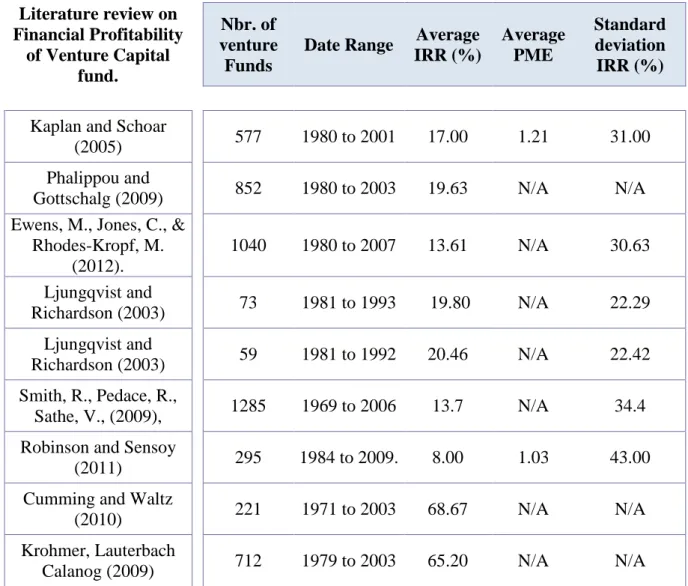
11 Literature review on Financial Profitability of Venture Capital fund. Nbr. of venture Funds
Date Range Average IRR (%) Average PME Standard deviation IRR (%)
Kaplan and Schoar
(2005) 577 1980 to 2001 17.00 1.21 31.00
Phalippou and
Gottschalg (2009) 852 1980 to 2003 19.63 N/A N/A
Ewens, M., Jones, C., & Rhodes-Kropf, M. (2012). 1040 1980 to 2007 13.61 N/A 30.63 Ljungqvist and Richardson (2003) 73 1981 to 1993 19.80 N/A 22.29 Ljungqvist and Richardson (2003) 59 1981 to 1992 20.46 N/A 22.42 Smith, R., Pedace, R., Sathe, V., (2009), 1285 1969 to 2006 13.7 N/A 34.4
Robinson and Sensoy
(2011) 295 1984 to 2009. 8.00 1.03 43.00
Cumming and Waltz
(2010) 221 1971 to 2003 68.67 N/A N/A
Krohmer, Lauterbach
Calanog (2009) 712 1979 to 2003 65.20 N/A N/A
Table 1: Literature review of Financial Profitability of Venture Capital fund., Sources: Adapted from Kaplan and Schoar (2005) Phalippou and Gottschalg (2009) Ewens, M., Jones, C., & Rhodes-Kropf, M. (2012. Ljungqvist and Richardson (2003) Smith, R., Pedace, R., Sathe, V., (2009), Robinson and Sensoy (2011), Cumming and Waltz (2010), Krohmer, Lauterbach Calanog (2009)
This sample on the Profitability of Venture Capital Funds, enable us to see that the Results vary mainly among the authors.
This variation can be explained due to the different criteria they chose for the sample selection. Like Cumming and Waltz which have a sample that spread across multiple countries, or Ljungqvist and Richardson (2003) whom only focus on one company which is handling several funds other a period.
12 One other explanation for the variation is the approach of the calculation. Khromer and Lauterbach have extremely high values for the IRR in comparison with other authors because they are calculating the absolute mean for the Rate of return, and not the (normal) mean. However their median IRR of 9, 5% is more in correlation with the previous data.
Cumming and Waltz (2010) also considered the absolute mean for the IRR resulting also in a higher value than the others authors, and also their median IRR is also more consistent with the previous results as we have a median IRR of 16,97%.
Kaplan and Schoar (2005), Ljungqvist and Richardson (2003), Robinson and Sensoy (2011), identify that Venture Capitals tend to outperform the traditional stock markets (S&P 500). However, Phalippou and Gottschalg (2009) do not agree with these assumptions, as they acknowledge that Venture Capital returns do not exceed the stock marker Return.3
In regard of the dispersion, Kaplan and Schoar (2005), Ewens, Jones and Rhodes-Kropf, M. (2012), and Robinson and Sensoy (2011) detect an important heterogeneity in term of performance with a wide dispersion between high and low achievers.
As Da Rin explained “the return distribution is highly dispersed. Indeed the net turns of the best VC funds are clearly very high, the median VC fund rarely beats the market, and the lower tail of the distribution can generate large negative returns”(p.52).
This is consistent with the conclusion of Hall and Woodward (2010) that three out of four venture-backed entrepreneurs do not generate any return but the successful entrepreneurs generate $ 5.8 M at the exit.
However we should not associate high return with a positive I.P.O., as Smith Pedace and Sathe (2009), explained that there are no correlation between a high IRR and home runs (High valued exit IPO), except in the upper tail funds, mergers and acquisition are as important as home runs in order to evaluate a venture investment success.
Finally, Venture Capital funds can be highly profitable or can be resulting in an important loss for the investors. However, Venture Capital investment can procure other advantages
3 (After correcting the Sample Bias and the overstated accounting Phalippou and Gottschalg do find that VC funds underperformed in comparison of the S&P 500.
13 such as a gain of knowledge over a sector. According to Hellman and Puri (2002), this knowledge can be useful can it can help the corporate venture investment to acquire a competitive advantage on one market. This knowledge can later be used by the company in case of an acquisition in the industry. As Benson and Ziedonis (2010) illustrate the knowledge acquire by Venture Capital Investment can help reducing the overpayment of the acquisition caused by the winner curse.
f) Risk of Venture Capital Investment
Venture Capital investment will be subjected to the different financial risks such as systematic and non-systematic risks, and also irrational behaviours. Our aim is to highlight these different risks for the Venture capital sector.
i. High Volatility.
As we have seen earlier Venture Capital investment is a highly risky venture, three out of four venture-backed entrepreneurs do not generate any return (Hall and Woodward (2010). Therefore Venture Capital has to rely on the one out of four ventures that will procure enough revenue to compensate the loss of the other 3 and to generate a profit for the investors.
This will result in highly dispersed distribution revenue (Kaplan and Schoar (2005), Ewens, Jones and Rhodes-Kropf, M. (2012), and Robinson and Sensoy, 2011). Meaning that the Venture capital fund needs to find a golden ticket in order to be profitable. The important dispersion in term of performance will increase the risk for the investors.
ii. Irrational behaviour
Irrational behaviour encloses different behaviour on the financial market which may results in the investors making illogical and irrational decisions.
Shiller and Akerlof developed this idea through the explanation of the Anima; spirits: “Animal spirits […] is now an economic term, referring to a restless and inconsistent element in the economy. It refers to our peculiar relationship with ambiguity or uncertainty. Sometimes we are paralyzed by it. Yet at other times it refreshes and energizes us, overcoming our fears and indecisions.” It the emotional mind-set, the instinct of a person, and so what will make him act irrationally. (p.4)
14 This will drive the different irrational behavior on the financial market such as the Winner's Curse or the Disposition effect, or even speculative bubbles.
iii. Winner’s Curse
One of the main risks of Venture Capital is due to the information asymmetry; Information asymmetry is the fact that one party will have more information than the other.
This is the case for Venture Capital between investors and entrepreneurs. Potential Venture Investors will not have complete and perfect information on a company but only incomplete one for assessing a company value, whereas the entrepreneurs will possess perfect information for assessing his company value.
Therefore investors are not able to be rational and to make a logic decision because they cannot see all the possibilities due to the lack of information, as it is the case with the winner’s curse.
The winner’s Curse will have two effects for the investor (Thaler 1988):
The investors will overpay its investment resulting in a loss on the anticipated profit and return.
The value of the acquiring company will be less than anticipated resulting in a loss for the investors or a loss of gain.
This will be the case at the start of the investment when the company will tend to overpay its investment due to the information asymmetry. This information asymmetry in venture Capital investment will often lead the Venture Investors to overpay its investment. Then the return of the new acquisition will not up live to its expectation, resulting in a loss for him.4
iv. The disposition effect
The "living dead" company are a possible result of the disposition effect, this behaviour have been put into evidence by Shefrin Hersh and Statman Hert (1985).
The disposition effect is the tendency of the investors of keeping the losing stocks for too
4 As Thaler (1988) explain : “If many such projects are considered, and only a few are selected, then actual net
revenues will tend to be less than projected, even if the projections are unbiased for the complete set of projects considered.” P.201
15 long and selling the winning stock too early. The investors will keep the losing stock for a long time, as there are still believing that a recovery of their loss can occur, even if they are having a serious loss. The disposition effect will result in “Living Dead Fund, as the investors will withdraw its investment in the companies hoping for a miraculous recovery.
v. Technological bubble: illustration with the dot-com bubble The dot-com bubble was speculative bubble which occurs between 1998 and February 2000, during this period the internet sector earned over 1000 present on its public equity (Ofek and Richardson, 2003)
According to Ofek and Richardson, the main causes of the dot-com bubble was the important number of optimistic investors that were driving the price of the stock up and overvalued the internet and technology company. As a result, the IPO prices skyrocketed. (Ljungqvist and Wilheim, 2003)
Venture capital investment was particularly affected by this bubble, as it is highly present in the technological sector and so in the internet sector.
Therefore a new technological bubble can be dramatic for Venture Capital Investors, as it will mean an overvaluation of the prices. Then, the burst of the bubbles would resul in a dramatic plunge of the stock price of in the technology sector and at last a crash in Venture Capital return.
A new Technological bubble can be plausible in years to come especially in regard of the aftermath of the Facebook IPO. Facebook launch its IPO on the 18th May 2012 the IPO was priced at $ 42,05 per share, within two weeks the stock lost 25% of its values, and by the 4th of September, the share price was at its lowest at 17,73. Facebook had to wait until the 05th of September 2013 to return to its IPO price. (Yahoo Finance UK. 2014)
2.
Movie Industry
In this part, we will highlight the main findings in the motion picture industry. We will first explain the creation process in the movie industry and how a film makes it from the preproduction to the screen. Then we will explain the risks in the motion picture industry, and we will finish by the studying two forecasting models developed by researchers: the Movie
16 Mod developed by (Eliashberg et al. 2000) and on DAN2 developed by Ghiassi Lio and Moon (2015).
g) Creation process
The creation process of a movie is made of 3 main phases: Production, Distribution, and Exhibition. In this part, we will explain the three different phases.
vi. the production :
The production usually consists of 4 stages, the development, pre-production, production, and post-production.
During the development phase, a script needs to be selected and the money need to be secured. According to Eliashberg, Hui and Zhang (2007), this phase is one of the riskiest as a team need to accept or refuse one potential project (green light process). During this phase, the quality uncertainty on the final product is really high.
If the team select a poor project, it will result in an important loss for the studios, and by not selecting a project the team can miss a profitable opportunity.
Regarding the question of securing the fund; the director can choose to do partnership with a studio, in this case it will be easy to have access to the funding and the director will be able to benefit from the network of the studio (which will render the distribution phase easier). However by doing this the directors will give up a lot of their rights, (sequels, spin-off, merchandising, derivate product, etc.). If the directors choose to do the movie independently it will be harder to secure the fund for the money however the director will not give up his rights. (Eliashberg, Eleberse and Leenders 2006)
During the pre-production phase, the crew is hired (actor, director, technical staffed, etc.) and the shooting locations are decided.
The next phase is the production itself, it is during this phase that the movie will be filme. During this process, a movie can easily go over budget, due to an unpredictable event such as an accident, bad weather etc.
17 editing, dubbing, creating special effects, and adding music take place (Acheson and Maule – 1994)
vii. The Distribution
Once the production phase is completed a movie can go through the Distribution phase. According to Eliashberg Eleberse and Lenders (2006), the distribution process has two main roles, firstly to deliver the movie to the different theatres and secondly to manage the different advertisements for the different countries.
Some studios are vertically integrated this means that they do they take care of the production and distribution. Studios that are not vertically integrated will have to pass through those studios in order to distribute their movies to the markets. (Ainslie 2005)
viii. The Exhibition
The last and final phase of a movie life cycle is the exhibition phase when the movie will be available in theatres for the publics. In this phase, the most important time is the first two weeks of the release of a movie as Pokorny and Sedgwick (2010) explained that 25% of the total revenue of a motion picture comes from the first two weeks. For Einav (2007) the importance of the first week of released is even more important as according to him 40% of box offices revenues are generated during the first week.
Therefore the awareness generated around a movie will be extremely important to develop the box office revenue. The awareness can be generated through advertisement, word of mouth, media attention, etc. (Eliashberg, Eleberse and Leenders 2006)
h) Motion Picture classification:
Sawhney and Eliashberg (1996) divide movies into two categories, Sleepers and blockbuster, this classification is made according to the diffusion pattern.
Blockbuster movie has an exponential decaying sales pattern, with the opening weeks grossing the largest amount of money, whereas for sleepers their sales build up gradually generally reaching their peak after 3 to 6 weeks after launch.
18 Eliashberg et al. 2000 explained that Blockbuster will rely on important advertisement to create their demand (Blitz Strategy) on the contrary of Sleepers will rely on the word of mouth to create their demand (Platform strategy).
This dual strategy will lead to product segmentation in the industry between motion picture for the mainstream release, and the other to a more marginal audience.
This distinction will lead the studios to developed different branches for the more marginal audience; Focus Feature is the artistic branches for Universals or Fox Searchlight which is the artistic branch of 20th-century FOX. (Ainslie, 2005)
i) Risks for the motion picture industry
The motion picture industry is a highly risky business only thirty to forty percent of movies break even and only one out of ten is profitable. (Vogel 2001)
The motion picture industry is characterized by a high volatility, even among movies of the same studios. The studios will rely on a few movies to earn an important profit which will compensate the loss of the others movies. (Eliashberg, Elberse, & Leenders, 2006).
Desai and al. (2002) found 3 three main risks in the motion picture industry:
Completion risk, due to the high importance of the investment needed and the uncertainty of what can happen during the shooting of a motion picture. Performance risk : The difficulty to predict which movie will attract viewers. Financial risk : The uncertainty on the future gross and profit of one movie, due to
the difficulty of predict the future attendance
Acheson and Maule (1994) also identify 3 risks for the industry:
The lack of knowledge on whether or not a film will succeed to attract viewers. Difficulties in containing the cost of production, as some unexpected event can
happen during the shooting. Containing piracy of theft.
19 Acheson and Maule (1994), Desai and Al (2002) agreed that the main preoccupation for a movie is the impossibility to know if a movie will succeed to attract viewers. e
This risk is due is due to the nature of a movie as a unique product. Karpik (2010), defines those unique products (a painting, a bottle of wine, a music, etc.) as singularities which have for main characteristic a quality uncertainty. Thus no one will be able to assert without any doubt the revenues that a movie would generate at the box office due to this quality uncertainty.
The completion risk and the difficulty in containing the cost of production can de dramatic for a movie as it will increase its cost and will reduce its probability of being profitable. Piracy is an important risk for the motion picture industry. As Danaher and Smith (2014) explained, piracy can have an important negative impact on the revenue of the motion picture industry, Danaher and Smith (2014) analyse the impact of the shutdown of Megaupload 5 on the motion picture industry. He founds that the shutdown of the mega upload sites resulted in an increased of digital motion picture sales of 6, 5% in the 18 weeks following the shutdown.
j) Joint-Venture
Studios can reduce the risk on this quality uncertainty, by co-financing motion picture with others studios. As Palia (2005) explained co-financing a movie can be an interesting choice for studio due to the high risk of the industry.. Studios might be interested in sharing the investment in order to share the risks and the revenue. This alliance can take several aspects as for example one studio will take the revenue from the domestic sales where the other studios will have the right for the foreign sales
Overall motion picture is a risky venture due to the high quality uncertainty and the possible events that might happened during the creation process. However, the risks can be avoided or at least diminish, as several factors of successes have been found in order to decrease the probability of a loss for the studios.
k) Factors of success and movie portfolio
5 Megaupload.com and Megavideo.com was one of the largest sharing platform in 2012, which had 25 petabytes of content majority was motion picture content through download or streaming.
20 Pokorny and Sedgwick, (2010) found that the profitability distribution at the box offices is highly heterogeneous, due to the important gap between low and high achievers. Some movies will do very well in term of Revenues (e.g. such as “Marvel’s The Avengers” for 2012, who grossed more than $ 1.5 BN, the revenue gross of the year), whereas other movies turn into being a major loss.
According to Litman (1983) a producer of one movie must look at several key factors to be sure that his movies will be successful.
ix. High Budget and Star Power
The first factor is the creative content of a movie, the material used for the production of a movie must be “genuine, believable, and timely.” (P.3)
Pokorny and Sedgwick, (2010), developed the thesis that movies with the highest budget tend to be the one also having the highest gross. However, Litman (1983) is more critics about this issue. Litman explained that greater production budget will lead to a greater production value and therefore will attract more viewers as with a higher budget, producers will be able to spend more on costumes, or on the set, also to hire staff with a better experienced and more skilled, etc., all of that resulting in a movie of superior value. However, a High budget can also be due to the excessive salaries of stars, the inefficiency of management, the delay of production etc.
Also a higher budget will enable the studio to hire some well-known actor and director, thus to add some "star power" to one movie. Basuroy et al. (2003) found that a high star power is highly correlated with a high budget for the movie.
Even if the conventional wisdom tend to think that to hire a well-known director or actor will attract more viewers, Pokorny and Sedgwick (2001) shown that there is no correlation between the two. Even more, Pokorny and Sedgwick explained that the high investment for hiring a well-known star is not worth the potential increases in the box offices because the incremental risk to do so will be too important. An increase in the budget also increases the risk for a movie, as movie will need to gross more money in order to be profitable. This was the case with movie “47 Ronin” with a revenue of $ 151 M, and a budget of $ 219 M, the movie didn’t succeed to attract sufficient viewers in order to break even.
21 x. MPAA Rating
The producers must also look at the rating that the MPAA (Motion Picture Association of America) will give to their movie (G, PG, R, X). As an R, or X, movies will restrain their public to individuals only above 18, or under 18 and accompanied by an adult for the R rating; whereas the G and PG rating will accept all public. (MPAA 2015)
According to De Vany and Walls (2002), R-rated movie is the one grossing the most of the money and seeing as the most prestigious by the movie industry. As a G or PG movie will tend to be labelled as a movie for children.
xi. Seasonality
Producers must know, that attendance for the motion picture is not the same along all the year, and holidays period tend to be the busiest.
Einav (2007) identify six periods important for the US Motion picture industry, President's Day (3rd Monday of February), Memorial Day (Last Monday of May), the Fourth of July, Labour Day (First Monday of September), Thanksgiving (04th Thursday of November), and Christmas Eve.
Einav explained that the studios tend to release their high budget movie during this period; as the demand is higher. For example “The Lone Ranger” by Buena Vista was released on the 03/07/2013, “300 Rise of an Empire” by Warner’s Bros was released on the 03/07/2014.
xii. Competition
Also, the producer must remember that their movies are not alone on the market, but that their movies are competing against other movies to attract potential viewers. Therefore to delay the release of one movie and to not go head to head against other competitors can be considered a smart choice.
As we have seen, that for a blitz strategy, advertising will be of prime importance in order to create their demands, however for a platform strategy advertising will be less important as the studios will tend to rely on the word of mouth. However, Eliashberg et al. (2000) with the Movie MOD model explained that the advertisement can also be ineffective and will not
22 succeed to attract viewers, and also that the word of mouth can be negative and will, therefore, create a bad advertisement for the movie resulting in fewer viewers.
xiii. Sequel
Thurreau (2006) also found another factor of success for one movie, the cultural familiarity.The fact that the product is already known by the public such as a sequel, or the second movie of a trilogy, or a movie derivate from a well-known story. Eliashberg, Elberse, & Leenders, (2006) explained that a well-known product will be easier to sell, they also explained that as the distributor do already know the product they will be more willing to diffuse this movie than an unknown product that has not make its proof on the market yet.
However, Basuroy (2006) explained that the success of a sequel is far from guaranteed and even more that the sequel tends to do worse than the parent film at the box office. And that sequel tends to have a higher cost than the parent movie, due to the fact that the actors will ask for a higher salary and at the end sequels have higher risks than the parent movie.
Overall due to the uncertainty on a movie performance, studios must be sure to have and to adapt their portfolio with different movie types. The optimal movie portfolio will have various movie types – with a different genre, storyline, age, etc., in order to protect a studio against the change of the audience tastes. (De Vany and Walls 2002)
Some efficient forecasting model has been developed for the movie industry. Those models can help the investors and stakeholder to gauge the profitability of a movie before investing in the project, and also can help the studios in developing a successful movie portfolio.
l) Forecasting movie revenues
Several forecasting models already exist with high accuracy, however, those models rely on post-production data or when the movies have already been released. Forecast at this production stage will not help the studios to overcome the possible loss of a movie as the money as already been invested. (Ghiassi, Lio and Moon, 2015)
Forecasting a movie gross with accuracy would bring financial and reputation benefits to the studios and to the stakeholder, especially if the forecast is able to be made during the green lighting process (Eliashberg, Elberse, & Leenders, 2006).
23 Some models and tools have been developed to forecast the expected profit of a movie, with only the pre-production phase information. Two of those models are the MOVIE MOD developed by Eliashberg et al. (2000) and DAN2 by Ghiassi, Lio and Moon, (2015).
i. MOVIE MOD
According to Eliashberg, Elberse, & Leenders, (2006) two approaches are being considered in the case of forecasting the movie gross:
The psychological approach focuses on the individual decision to choose to go to a movie. This approach mainly relies on the opinions, needs, values, personality trait to determine which movies one consumer will be mainly to go.
The Economical approach explores the variable of one movie that will explain it's the financial performance such as the genre of the movies, the rating, the budget,
advertising, etc.
For example, the MOVIE MOD model (Eliashberg et al. 2000) develops a forecast of the box office sales with only pre-release information before the movies passed the green light process. With this model, Eliashberg has achieved a 90% rate of success.(Ghiassi, Lio, Moon, 2015)
The MOVIE MOD model relies on the effectiveness of the advertisement, the distinction between a negative and positive word of mouth, the duration, and intensity of word of mouth. However, the authors recognize that their models only have for aim to assist the producers in their green lighting process and not to give them a true accuracy of the future movie gross.
ii. DAN2
Ghiassi, Lio and Moon (2015) also developed a forecasting model which relies on the information of the pre-production phase. Their model is based upon on a Dynamic Artificial neural network (DAN2). This models forecast the US box offices revenues.
DAN2 models show an incredible accuracy with an accuracy of 94, 1%. In order to achieve this level of accuracy the authors selected several variables of importance's to be considered for their models: the MPAA rating, if a movie is a sequel or not, the number of theatres where
24 the movie would appear, the production budget, the advertising expenditure, the runtime and the seasonality.
They did not include several variables such as Star power as it is linked to the production budget. ((Basuroy et al., 2003) Ghiassi and al. also excluded the special effect variable due to its difficulty to quantify it.
DAN2 models will not predict the forecast of the movie but will predict its classification and therefore the revenues that can be expected from it. DAN2 classification range from Flop (less than a million of box offices revenues) to Blockbuster A (between 100 to 200 million of revenues).
However the authors recognize that one of the biggest limitation of their model is that in order to be effective DAN2 need to have an important number of reliable data, and this will only be able to achieve by working directly with the studios and to have access to confidential data such as production budgets, advertisement budget, the runtime etc.
iii. HSX
One other forecasting tool which deserves to be mentioned is HSX as instead of relying on statistical model HSX rely on the wisdom of the crowd.
Hollywood stock exchange (HSX) is a virtual stock exchange which enables the users to trade shares of movies, actors or Options (Academy award nomination, etc.). Each new player receives a virtual amount of $ 200 000 to start. The share price of a movie is defined by the offer and the demands. The share price of a movie represents the expected box office revenues (US) that a movie will generate. For example, if MovieX is priced at $ 100.00 on the 31/06/2016. This means that at this specific moment HSX users forecast that MovieX will generate $ 100 000 000 at the box offices. If the users think that the movies will earn more money the share price increased if they think it will generate less the share price will decrease.
Therefore the forecasting made by HSX relies mainly on the wisdom of Crown. According to Surowiecki (2005), “under the right circumstances group are remarkably intelligent and are
25 often smarter than the smartest people in them” (p.12).This will result in the crowd judgment to outperform the decision made by a single expert.
HSX have shown highly accurate results in post-production and post-released phase (Elberse & Eliashberg 2003). However, McKenzie (2013) has reported that HSX tends to overvalue small earning film and to undervalue large earning movie.
Overall even if there are some promising researches in the field of forecasting movie gross. Forecasting a movie gross is a task almost impossible as too many variables , and too many confidential information are to take into account for the process. Also, the model would have to be able to predict the volatility in audience taste.
26
III. Research Methodology & Objectives
3. Methodology
For this essay, our research will be mainly analytical as we will analyze information already available to make a critical evaluation.
Then the gathering of the data concerns two different fields: m) Venture Capital
For the Venture Capital, we will rely on secondary research materials. We will base our result on a survey of the Literature review of funds profitability as we have seen in the Literature review. We will not consider the results from Cumming and Waltz (2010) and of Krohmer, Lauterbach and Calanog (2009 as their method of calculation for the IRR will misrepresent the profitability. Therefore we will only retain 7 Academicals article.
In those Articles, as we have seen earlier the different authors considered several variables. For our Essay, we will focus on only two to be able to draw a comparison between the Venture Capital Investment and the movie industry.
The IRR, calculated as followed:
𝑁𝑃𝑉 = ∑ 𝐶𝑡 (1 + 𝑟)𝑡 𝑡 𝑡=1 − 𝐶0 Where:
𝐶𝑡 = Net Cash inflow during the period𝑡, 𝐶0 = Total investment cost, 𝑟 = Discount
Rate, 𝑡 =number of periods. (1)- Equation 1 - IRR
We will also analyze the standard Deviation of the IRR.
The IRR will be important for us in order to analyse and compare the profitability. However, according to Phalippou (2009), the IRR can mislead the result due to the fact that it is an aggregation of the different values. The standard Deviation of the IRR (in %) will enable us to assess the dispersion of the distribution, and therefore the volatility of the profitability.
27 n) The movie industry
The collection of data for the movie industry will also rely on secondary research materials. For the motion picture, we need to find two data set: the revenue of a movie, and its cost or budget.
Concerning the revenue earned by the movie, we will only consider the worldwide revenue, We will also not take into account the auxiliary revenue source such as DVD sales, the sales right to television… etc.
Ghiassi (2015), only considered the domestic revenue (made in the US) and not the international revenue. However we will also consider the International revenue in our analysis.
As for 56% of our sample, the international revenue is superior to the US revenue. Therefore not considered it will highly bias our study in term of Profit and will mislead our analysis. Furthermore due to the increase cost of movies in the recent years, (Eliashberg et al., 2006), We do strongly believe that some movies are not made to break even on the US markets but will only break even if having a worldwide release.
The worldwide gross of a movie or box offices sales is an accessible data to find, we will only rely on the website Box Office Mojo (Box office mojo. 1999) to find the different data. Regarding the cost of a movie the data is harder to find, and most of the time is only an approximation of the real cost. However we are confident in the consistency of our data, as Pokorny and Sedgwick (2001) explained that production cost available are only estimate" although industry sources are confident that these are measured to within 10 percent accuracy “(P.158)
Nevertheless in order to have a better estimation we decided to do the average of the data present in 4 different public sites: Box Office Mojo, The numbers, International Movie Data base and Box office.org.
o) Precision regarding the selection of the data, and its analysis i. Release date
28 Concerning the release date, we only have retained the movies that were released between 2011 and 2014.
However for the movie release at the end of 2014 (“The Hobbit: The Battle of the Five Armies”, “Exodus: Gods and Kings”, “Unbroken”, “American Sniper”) made an important part of their gross in 2015. Therefore for those movies, we had also to consider the revenue realized in 2015.
ii. Worldwide release
The worldwide release has some incremental costs that have not been taken into account in the budget figure; This is due to the fact that the different studios are vertically integrated therefore the distribution costs ( P&A costs) tend to be mixed with the production costs. However, when a studio wants to release its movie at the international it has to use foreign distributors. Therefore for movies that have been released worldwide, we had to consider international commissions of 27% on the worldwide gross. (Follow, 2015 ).
The US gross stay untouched.
iii. Invalid data.
We will exclude from our sample re-released movies, IMAX movies and Movies for which there was a lack of available data for the investment cost. Our sample will be composed of 524 movies (83,17% of our initial sample).
p) Financial Analysis
In order for us to compare the Data between the Movie industry and Venture Capital investment, we will have to calculate the variables that we have collected from the different academicals articles on Venture Capital investment, the IRR and the Standard deviation.
iv. The IRR
We will consider that a movie has only two cash flows in its life. The initial investment in C0
that will be a cash Outflow, and the total revenue generated by the movie, the Cash outflow C1. Therefore if we modified the previous formulas of the IRR we have the following:
𝑁𝑃𝑉 = 𝐶1
29 Where:
𝑪𝟏 = Revenue generated at the box office per the movie.𝒕, 𝑪𝟎 = Initial investment, 𝒓 = Discount Rate, 𝒕 = Production time.
(2)-Equation 2 – Adapted IRR for the Movie Industry
Then we will have to calculate the IRR for the movie industry as followed:
𝑟 = √𝐶1
𝐶0 𝑡
−1 Where:
𝑪𝟏 = Revenue generated at the box office per the movie 𝒕, 𝑪𝟎 = Initial investment, 𝒓 = Discount Rate, 𝒕 = Production time.
(3)- Equation 2 – Adapted IRR for the Movie Industry with two cashflows
We already have C1 andC0 which we have collected. However, we will need to estimate: the
Production time.
We will consider the entire interval between the pre-production and the released in the cinema of the movie.6 We have not been able to find one formal sources on this duration and the informal different (from blogs, forums, and newspapers) data we found was diverging thus For t, we will consider three scenarios:
1. One pessimistic where t is equal to two years. 2. One optimistic where t is equal to one year 3. One likely where t is equal to 2 years.
However the revenues, of a movie did not occur in a single cash flow but occurred during a period of time. As we have seen earlier the first week is highly important as according to Einav (2007) 40% of the revenue is made during the first week. We considered that 25% of the revenues is made during the first weekend, 40% is made during the first week, 85% is made during the first months and 100% of the revenues is reached after a three months period. By calculating the weighted average we end up with t= 0,0789 years, or 4,12 weeks. By adding this result to t we will take into account the time period of the revenue in our calculation.
6 When a movie will be available in theaters, it will start to generate a revenue. The revenue will grow daily as
long as the movie will be showed in theaters, this duration can vary. However as we have seen earlier with Pokorny and Sedgwick (2010) and Einav 2007. The first two weeks are highly important for the movie revenues.
30 At the end, we have the following t to use in the calculation of the IRR in the different
scenarios: for the pessimistic scenarios t= 4,08, for the optimistic scenarios t=1,08 and for the likely scenarios t=2,08.
We will apply the Standard deviation to the IRR and to the profit and loss of the movies in order to be able to analyse the dispersion of the distribution and to compare it to the Venture Capital investment
v. The Coefficient of Variation
Inside the sample, we will use the Coefficient of Variation in order to allowed comparison between the different studios.
𝐶𝑉 =𝑆
𝑥̃× 100 Where:
𝑪𝑽 = Coefficient of variation 𝒕, 𝑺 = Standard Deviation 𝒙̃ = mean (4)Equation 4 – Coefficient of Variation
q) Objectives
In this essay, our aim is to achieve the following objectives:
1. To put into evidence, why motion picture is considered a highly risky venture. 2. To determine the average profitably and the volatility over the period of the movie
industry.
3. Compare the profitability of the movie industry with the profitability of Venture Capital funds in terms of profitability and risk.
31
IV. Results
In this part, we will present the different results we have been able to draw from the Secondary material we collected for the Venture Capital and the movie Industry.
4. General Observations on Venture Capital
As we have explained earlier we will rely on the findings of different academicals articles in order to build up our data for Venture Capital. As explained we will not retain the result of Cumming and Waltz (2010), and of Krohmer, Lauterbach, and Calanog (2009). Therefore we end up with the following selected results:
Sample Selection on Financial Profitability of Venture Capital.
Nbr. of venture Funds
Date Range Average IRR (%)
Standard deviation IRR
(%)
Kaplan and Schoar (2005) 577 1980 to 2001 17,00 31
Phalippou and Gottschalg
(2009) 852 1980 to 2003 19,63 N/A
Ewens, M., Jones, C., &
Rhodes-Kropf, M. (2012). 1040 1980 to 2007 13,61 30,63 Ljungqvist and Richardson
(2003) 73 1981 to 1993 19,80 22,29
Ljungqvist and Richardson
(2003) 59 1981 to 1992 20,46 22,42
Smith, R., Pedace, R., Sathe, V.,
(2009), 1285 1969 to 2006 13,70 34,4
Robinson and Sensoy (2011) 295 1984 to 2009. 8,00 43
Average N/A N/A 16,03 30,62
Table 2: Sample Selection on Financial Profitability of Venture Capital, Sources: Adapted from Kaplan and Schoar (2005) Phalippou and Gottschalg (2009) Ewens, M., Jones, C., & Rhodes-Kropf, M. (2012). Ljungqvist and Richardson (2003) Ljungqvist and Richardson (2003) Smith, R., Pedace, R., Sathe, V., (2009), Robinson and Sensoy (2011)
32 Based on the 7 retained observations we have calculated an average IRR of 16, 03 % and a average Standard deviation of the IRR of 30, 62%.
5. General Observations on the Movie Industry
In this part we will make some general observations on our results, we will analyse the market share, the profitability, the IRR and the volatility with the Standard deviation.
r) Market Share
Our sample counts 524 Movies and 13 studios that account for more than 95% of the market share of the industry over the period.
This is not surprising as Ghiassi also point out that “the big seven” own more than 83% of the market shares in 2013. Therefore by extending our sample to 13 studios is normal that we have a higher number.7
For the five years selected we have 524 movies, with 143 movies in 2011, 128 in 2012, 127 in 2013 and 126 in 2014.
However, among those 13 studios, there are some differences in term of market Share. Some studios dominate the market, for example, Warner’s Bros has released in total 78 movies (15% of the sample), Sony Colombia released 73 movies (14% ), 20th Century Fox 59 movies
( 11%).
Some studios released only a limited number of movies, Film district released only 14 movies over the period ( 3% of the sample), Open Road film released 17 movies ( 3%), and Focus features released 22 movies ( 4%) of the sample.
7 « the Big seven » include Warner Bros, Buena Vista, Universal, Sony Colombia, 20th Century Fox, Lionsgate,
33 Graph 1 : Market share: Movie Released, Source : Own Source
This difference of market share will also be representative of the financial capability of each studio or the amount of money each studio is capable of investing in a movie.
s) Financial Capability : Investment
Graph 2 : Average investment per Movies, Source : Own Work 11% 8% 3% 4% 10% 3% 9% 5% 14% 1% 11% 15% 6%
Market Share : Movies Released
20th Century Fox Buena Vista Fim District Focus Feature Lionsgate
Open Road Films Paramount Relativity Sony Colombia 50.0 100.0 150.0 200.0 250.0
Average investment per Movies
34 Between the studios there is some important variations. For example, the average budget of a movie made by Buena Vista is of $ 191,5M, and the average budget for the Weinstein Company is of $ 35M.
t) Profitability
However, this doesn't mean that the Studios with a higher Financial capabilities will be more profitable, as with a higher the cost, the harder it will be for a movie to be profitable.
Blockbusters movie due to their pattern of distribution and of production tends to be more expensive than sleepers movies as for example Blockbuster movie will have a high Star Power and will rely upon an important amount of advertisement. This important increase in costs could result in a loss for the studio event if the movies generate large revenues.
As it is the case with Universal and the movie “R.I.P.D.” With Jeff Bridges (Academy Award winner, starred in 87 movies) and Ryan Reynolds (starred in 67 movies). (IMDB, 2016). R.I.P.D was released in 2013 and $ 153M was invested in the movie, it earned a revenue of $ 78,3M, resulting in a loss for Universal of $ 75M..
On the other hand, “a haunted house” by Open Road earn $ 60M at the box office with only an investment of $ 11M. “A haunted house” had a low star power and succeeded to generate a profit of $ 48M for the studio.
Graph 3 : Average Revenue, investment, and Profit per Movies, Source : Own Source
100.0 200.0 300.0 400.0
Average Revenue, investment and Profit per
Movies
Average Profit/Loss (M€) Average Investment (M€) Average Revenue (M€)
35 However, studios relying on sleeper’s movies have a lower revenue and a lower profit, than studios focusing on blockbuster such as Buena Vista, 20th Century Fox, Paramount, Warner, and Weinstein company.
Buena Vista possess four of the top 10 movies in term of Revenues, “Marvels the avengers” highest revenue with $ 1,5 BN, “Frozen” with $ 1,2 BN, “Iron man 3” with $ 1,2 BN, “Pirate of The Caribbean on stranger tides” with $ 1, 0 BN. Buena Vista is the Studios with the most revenues over the period.
u) Breakeven
Studios which rely a Block Buster movie tend to do better in term of reaching the break-even point for a movie.
20th Century Fox, Paramount, Universal and Sony Columbia are among the studios with the
lowest proportion of movies which do not break even.
On the other hand, Focus Features, Film district, Summit, are among the studios with the highest proportion of movies that do not break even.
Graph 4 : Break Even proportions per Studios, Source : Own Source v) IRR 0% 10% 20% 30% 40% 50% 60% 70% 80% 90% 100%
Break Even Proportion per Studios
Profit Loss