OPTIMIZATION OF ANNATTO (Bixa
orellana L.) DRYING IN FIXED BED
L.J.G.Faria1* and S.C.S.Rocha2 1
Laboratório de Engenharia de Produtos Naturais, Departamento de Engenharia Química,
Universidade Federal do Pará, Zip Code 66075-900, Phone: +55912111694, Belém-PA, E-mail: leniof@yahoo.com.br
2Departamento de Termofluidodinâmica, Faculdade de Engenharia Química,
Universidade Estadual de Campinas, Phone: +55 19 7887781, Campinas-SP E-mail: rocha@feq.unicamp.br
(Received: November 23, 1999 ; Accepted: April 6, 2000)
Abstract - The drying of annatto seeds (Bixa orellana L.), red piave cultivate, was studied in a fixed bed dryer. The best conditions were estimated to minimize the loss of coloring and to obtain final moisture of the seeds in appropriate levels to its conservation and maintenance of quality. The quantification of the influence of entrance variables in the final contents of bixin and moisture seeds and the identification of the optimal point was performed through the techniques of factorial design, response surfaces methodology, canonical analysis and desirability function. It was verified that the final moisture of the seeds may be estimated by a second-order polynomial model and that the final content of bixin is only significantly influenced by the time of drying being described properly by a linear model, for the seeds used in this study.
Keywords: drying, response surfaces methodology, annatto.
INTRODUCTION
The tendency nowadays demonstrated by the international market to restrict the use of artificial coloring in food, allied to the demand of consumers for natural products also in the pharmacy cosmetics industry (Nothenberg, 1997), has risen the interest of researchers and of the industry for natural raw material (vegetal particularly), which are used as coloring. On this aspect, seeds of annatto (Bixa orellana L.) are brought out as an important raw material found in the country for the obtention of coloring due, principally, to its characteristics of natural product, non-toxic, high coloring strenght and wide range of colors.
The trading way of seed, according to quality, mainly the coloring content and moisture proper for conservation, stimulates the producer to obtain seeds of better quality, making the country more competitive in the international market. Brazil is nowadays considered the third most important world exporter of annatto seeds just after Peru and Kenya. However, the qualitaty reputation of the Brazilian product in the international market is considered poor (Ohashi et al., 1992)
The improvements in basic researches in the area of genetics and citogenetics, which is important for productivity of the annatto tree, do not reflect directly in a more competitive product in the international market. The agronomic field efforts won’t be enough if the treatments that the product receive in the post-harvest or pre-processing operations are not proper and contribute to the reduction of the quality of the seeds.
Bixin is the carotenoid found at the highest concentration in the annatto seeds. This pigment presents instability, being able to degrade when exposed to certain conditions of temperature, light and time of exposition during the process of drying.
According to Simpson (1985), the carotenoids are altered or partially destroyed in acids fragmented by the action of some enzymes and sensible to light exposure, generally stable to operations of thermal treatment, but degrade quickly in usual processes of drying due to oxidation and to reactions of isomerization.
In the separation and analysis of bixin and of other pigments found in annatto seeds as well as the content of bixin and other total pigments found in annatto coloring, the information of literature has shown that bixin is very sensible to light. When the proper care is not taken, rapid photochemical decomposition and oxidation will occur (McKeown, 1961; McKeown and Mark, 1962; Reith and Gielen, 1971; Rouseff, 1988).
Hence, the drying process has a decisive influence in the quality of the obtained seeds, not being deeply studied and nowadays performed in rudimentary and not proper way by the great majority of producers.
The pigment (bixin) is located in the outer layer which covers the seeds and corresponds to approximately 6% of the total seed weight. Bixin can be extracted by attrition of the seeds.
Therefore, it is not advisable that the drying be conducted in moving beds, since friction among the seed can induce loss of coloring material. Therefore, the controlled drying in a fixed bed dryer can be viewed as a feasible alternative to reduce the moisture of the seeds to a value proper to its conservation and trading, maintaining intact the concentration and the quantity of bixin furnished originally by the plant. Hence, the general aim of this paper is to analyze the drying of annatto in fixed bed, and based on response surfaces methodology, to propose the statistic optimization for the seeds final content of bixin and moisture.
MATERIALS AND METHODS
Materials
Annatto seeds, cultivate type Red Piave, were furnished by Agroindustrial Biotropical of the Danish group Chr Hansen, owner of a farm of rational cultivation of annatto trees, located in the Pará State, Brazil. The seeds used in this work were harvested in the crops, in the second semesters of 1996 and 1997. The initial and final concentrations of bixin found in the seeds were analyzed by the KOH methodology (Takahashi, 1987).
Drying
The drying experiments were performed in a prototype of a fixed bed dryer developed by Faria (1998), having at the base an adapted unit able to move and heat the air. This basic equipment consists of a duct of 25.4 cm of square section, with a centrifugal blower with rotor speed control, able to transport the air to the bed of solids with controlled flow rate. Also, this system contains two pairs of electrical resistances, distributed along the unit, which enable the heating of the air used as the drying agent.
The fixed bed dryer is connected to the air unit through a gradual reduction, which changes the square section to a circular one, with 7.5 cm of inner diameter and 1.35 m of length. The tubes are made of stainless steel and thermally insulated with fiber glass.
stainless steel, in which the annatto seeds are deposited. In this system, the seeds are exposed to the drying air at the base and through the lateral area of the basket.
This basket, which constitutes the bed itself, has an inner diameter of 12.5 cm and height of 25.5 cm, making a total volume capacity of 3.15L. During the experimental runs, the basket is suspended inside the cylindrical body of glass and connected to an electronic balance (sensitivity of 0.1g), which indicates the mass decrease during drying.
The experimental arrangement is completed with an exhaustor, placed next to the balance with the objective of cooling the drying air in its exit.
The instrumentation of the prototype consists in a Pitot tube connected to a micromanometer used for indication of the inlet air mass flow rate and two thermocouples, type K, to indicate the temperatures of entrance and exit of the drying air.
The use of special designed psychrometers for the determination of psychrometric properties of the air in drying processes was recommended by Rocha and Faria (1992). Hence, two psychrometers built according to the recommendations of ASHRAE (1996) and Rocha and Faria (1992) were connected to the entrance and exit of the bed. The psychrometer at the exit of the bed used a vacuum pump, with negative pressure of 700 mm Hg, sucking the air at the outlet to maintain a proper speed (>5m/s) when it passes through the wet cloth, so that the thermometer indicates its wet bulb temperature with a minimum error (Wexler and Brombacher, 1951).
The experiments were performed in batch, samples of the seeds were collected at the end of the specified drying time, in order to determine the variation of bixin concentration. The seeds moisture content was determined using the oven method until constant weight. The material was left in the oven for 24 hours at 105o C. The initial and final solids temperature were measured in a calorimeter by a thermocouple.
Experimental Design
In the convective drying in fixed bed performed in this work, the air humidity was a non-controllable parameter, measured by the psychrometers installed in the equipment or through a thermal hygrometer located in the space next to the equipment.
The controllable variables, which originally may have a relevance in the behavior of the drying of the material are the ones which are related to the air (temperature and mass flow rate), to the solid (initial moisture content , load or height of the bed) and to the process (drying time).
Response Surfaces Methodology
The technique of response surfaces is employed in the optimization of processes which present a considerable number of entrance variables able to influence the responses. This technique permits the identification, among these factors, of the ones which will affect the process under analysis.
The strategy of the methodology consists on selecting models through which the responses may be expressed by the independent variables involved in the process. A good estimation of the experimental errors and of the surface curvature is obtained performing replications of experimental runs in the central point, which correspond to average values, between the lower and upper levels of the inlet variables considered. The statistical analysis of the data performed in this work was based on the fit of a second-order polynomial model, as described by Khuri and Cornell (1987).
According to these authors, the total number of runs, Nt, may be given by Equation 1:
Nt= nf + n + nc (1)
where nc represents the number of repeated observations in the central design point and the number of experiments referring to the factorial
portions of design, nf and axial, n , are obtained as:
nf=2k (2)
n =2k (3)
with k being the number of independent variables or factors, taken as 3 in this work.
For the experimental design to present uniform precision, the number of repetitions in the central point can be estimated by Equation 4:
(4)
The central composite design may have the property of rotation and it is simple to calculate the value of the axial space, , through the following equation:
=nf1/4
(5)
According to equations (2) to (5), the central composite design with three factors (k=3) used in this paper for pursuing the properties of uniform precision and rotation resulted in nf = 8; n = 6; nc = 6 and = 1,68; and a total of 20 experimental runs (Nt= 20).
To obtain statistical models able to properly predict the final contents of moisture and bixin in the annatto seeds, it was developed a statistic design based on the Response Surfaces Methodology, using as inlet variables the temperature and mass flow rate of the air and the drying time.
conditions of temperature and relative humidity for a convenient time, which allowed an homogeneity in their initial moisture contents.
In Table 2 are represented the variables and the respective levels used in the optimization of the fixed bed drying of annatto seeds.
The statistical analysis of the experiments, aiming to find a representative model for the final contents of bixin and moisture, was performed using existent computer programs (Statistica®).
Analysis of Second-Order Models
The characterizations of the stationary point and of the response surfaces, described by quadratic polynomial models are performed in the following way: when the stationary point is in the vicinity of the optimal point of the experiment, a model of second order
for a response is proper.to a precise estimation of the initial conditions of process operation.
The levels of the points to optimize the predicted response may be obtained from its partial derivative in relation to the independent variables x1, x2, ... xk, as shown in the following equation:
(6)
The solution of the resultant K equations furnishes a point of coordinates x1s, x2s, ... xks named stationary point, which may represent a point of minimum or maximum response, and also a minimax or a saddle point (Montgomery, 1991). The methodology for the general solution and the location of the stationary point and of the correspondent value of response in this point, from a second-order polynomial model, is described by Khuri and Cornell (1987) and by Box and Draper (1987).
they become coincident with the main axis of the response surface proposed, based on experimental data, resulting on an expression of the kind:
= s + 1W12 + 2W22 + ... + kWk2 (7)
in which Wi (i = 1,2,...k) corresponds to transformed independent variables and i (i = 1,2, ...k) are constants, known as eigenvalues or characteristic roots of the symmetric matrix (k x k) of the main quadratic coefficients and other elements by half of the values of other coefficients of the proposed model, according to Montgomery (1991).
Equation 7 corresponds to a canonical form of the model and represents the same function of the second-order polynomial model. The nature of the response surface may be determined from the stationary point and from the signal and magnitude of the eigenvalues i. If all of them are negative, the surface corresponds to a maximum; on the other hand, if the eigenvalues in the stationary point are all positive, the surface is a minimum. If not every i presents the same signal, the stationary point characterizes a point of saddle in the surface of response fitted to the model.
The necessary calculation to locate the stationary point, the prediction of the response in the stationary point and the determination of eigenvalues, i, and its correspondent eigenvectors, may be done analytically or numerically, with the help of computer programs, such as Mathematica®.
The nature of the response surface described according to the methodology above is valid when the stationary point is located inside the experimental region, otherwise, it is risky to try to conclude about the nature of the response surface. The distance from the stationary point to the center of the experiment (centre point) can be estimated by Equation 8:
(8)
If the coordinates of the stationary point are near the centre point, which results in values of Ds close to one, a canonical form of the type indicated by Equation 7 is proper for the comprehension of the response surface.
The determination of an optimal point, taking into account restrictions on the entrance variables, may be gotten through the concept of overall desirability Dj, according to what was described by Akhnazarova and Kafarov (1982).
The concept of overall desirability is useful and it is desired to optimize processes where more than one response variable is involved. The responses obtained are transformed and interpreted in terms of acceptability, in a non-dimensional scale which varies from 0 (undesirable) to 1 (completely acceptable), according to Akhnazarova and Kafarov (1982). In this criteria dj consists of the individual desirability for each analyzed response and Dj is calculated as the geometric mean of many values of dj. The numerical optimization may be obtained through available computer programs.
RESULTS AND DISCUSSION
For the determination of the statistical significance of the effects of the entrance variables in the final moisture content of the annatto seeds, Xf, a variance analysis was performed and the results are presented in Table 4. The effects of the variables may be evaluated based on the F-test and on the value of probability (Pr).
By the examination of Table 4, it can be verified that the inlet variables x1 (Tg), x3 (G) and the combination x1 x2 (Tgt) and x3x3 (G2) are statistically significant, with a significance level inferior to 0.05; x2 (t) and x1x3 (TgG) at a significance level inferior to 0.01 and the combination x2x2 (t2) may affect the response at a significance level inferior to 0.10. The other combinations are not statistically significant to the response Xf.
model proposed, there is no evidence of lack of fit, since the value of F calculated (F5,5 = 2.37) is lower than the value of F tabled (F5,5 = 5.05) at the significance level of 0.05.
The value of the coefficient of determination R2 indicates that 98.43% of the variance is explained by the regression, in a maximum of 99.53% of explainable variation ( Barros Neto, Scarminio and Bruns, 1995). Due to the high proportion of explained variability for the response Xf, the second-order model proposed is proper for the process description. The model may predict, with safety, the variations in the final moisture contents of the annatto seeds, undergoing a convective drying in fixed bed, as functions of the statistically significant variables.
The results of the analysis of multiple regression with the indication of the respective coefficients, for each entrance variable and their combinations are indicated in Table 5.
Based on the values obtained, a statistical second-order model is proposed as:
= 11.3002 - 2.9777x1 - 0.4651x2 - 1.349x3 -
- 0.995x1x2 + 0.5675x1x3 - 0.2338x22 + 0.6041x32
(9)
Equation 13 describes a model to estimate the final moisture content of annatto seeds, Red Piave cultivate, as a function of original variables Tg (oC), t (min) and G (kg/h), through the relationships given by the Equations 10, 11 and 12.
(10)
(11)
(12)
Taking into account these relations in Equation (9),we obtain:
Xf = 13.372 + 0.028Tg + 0.081t - 0.2G -
-0.00083Tgt + 0.00093TgG - 0.000065t2 +
+ 0.00065G2
The model shows that the air temperature, air flow rate and drying time exert a considerable influence on the reduction of the moisture content of the annatto seeds. The results and the statistical analysis indicate that a raise in the values of Tg, t and G, causes a sensible decrease in the value of Xf, improving drying.
For the quadratic equation of the model given by Equation 9, we can write:
(14)
(15)
(16)
Solving this system of equations, one can find that the coordinates of the stationary
point x1s, x2s and x3s and the correspondent value of s through the substitution of these point in Equation 9. The coordinates found are:
x1s = 0.7317; x2s = -2.5518; x3s = 0.7728; and
= 10. 2829.
Now, it is possible to determine the nature of the response surface in the immediate vicinity of this point through the canonical analysis previously described. Hence, the distance from the stationary point (x1s, x2s, x3s) to the centre point is: Ds = 2.765.
The value obtained for Ds permits to transform the proposed model to a canonical form of the type presented in Equation 7, which gives a better comprehension of the nature of the surfaces under analysis.
Calculating the eigenvalues and eigenvectors correspondent to this system of equations we can write the canonical equation as:
(17)
with the linear relationships of initial coordinates represented by the following Equations:
W1 = 0.4708x1 - 0.2354x2 + 0.8502x3 - 0.7356 (18)
W2 = 0.6382x1 + 0.7563x2 - 0.1440x3 + 0.0463 (19)
W3 = 0.6091x1-0.6104x2 -0.5063x3 - 0.7297 (20)
where W1, W2 and W3 represent the independent variables in the canonical form.
The magnitudes (modes) of the eigenvalues 1, 2 and 3, which are the respective coefficients of W1, W2 and W3 in the canonical equation, indicate that the height of the response surfaces predicted changes more rapidly along the axis W1 than along the axis W2, and that the response changes less in the direction of axis W3, as it gets away from the stationary point. It demonstrates that the order of sensitivity related to the output variable due to modifications in the entrance variables associated to directions W1, W2, W3 is x1 > x2 > x3, or in original variables: Tg >t > G.
The same statistical analysis was performed for the final value of bixin content, Bf. The analysis of variance, presented in Table 6, shows that only the drying time presented a statistical significance for Bf, at the significance level of 0.10.
It can also be verified in Table 6, that there is no evidence of lack of fit, as the value calculated for F is equal to 0.46, much smaller than the value tabled at the significance of 0.10, F5,5 = 3.45. For the response Bf, the coefficient of determination R2 indicates that the model is able to explain 55.28% of the variability in a maximum explainable of 69.37%.
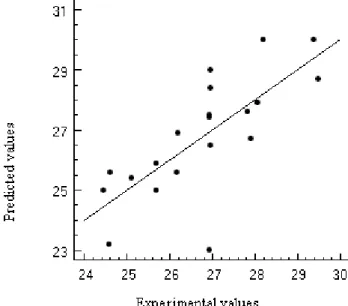
Using only the constant and the coefficient for the only significant variable, x2 (t), given in Table 7, it is proposed a linear model to express the response Bf, given by Equation 22, in function of the coded variable:
= 2.69518 - 0.12924x2 (22)
The same model is represented in Equation 23, as a function of the original variable:
Bf = 3.35 - 0.0022t (23)
The comparison among the experimental and calculated values through the linear model for Bf is illustrated on Figure 4. The comparison shows the existence of a reasonable fit of the predicted values.
Figure 5 represents a randomized distribution of the residuals, showing the absence of a tendencial behavior, indicating that the mathematical model represents properly the variations of final concentration of bixin in function of the drying time, by a linear relationship.
Optimization of the Drying Process
Hence, the identification of the optimal region for both Xf and Bf, the responses considered in this work, was performed through the analysis and the visualization of contour curves. These curves allow the identification of the range of the operational conditions of Tg, t and G which may correspond to the optimal for both responses.
The calculation of the function Dj was performed based on the described methodology by Akhnazarova and Kafarov (1982), with the following restrictions on the output variables Xf and Bf: 5%db < Xf < 10%db and Bf 2.84% db.
The limiting value of 5% db for the final moisture content corresponds to the mean value of moisture content in the monolayer, in the range of 35 to 80oC (Faria, Rocha and Costa, 1998).The maximum value of 10%db was chosen aiming the material good quality and conservation. The minimum limit of 2.86%db for the final content of bixin was chosen, in order to maintain the stability of the coloring related to the initial content, at a maximum of 10% of degradation.
The optimization was performed numerically and the value 0.8732 was obtained for the function Dj. This value is considered acceptable and excellent according to the classification by Akhnazarova and Kafarov (1982). The optimal point obtained for the coded variables was x1 = 1.68; x2 = -1.68 and x3 = -0.8918, which correspond to Tg = 94oC, t = 199 min and G = 50 kg/h, reaching the imposed restrictions shown in Table 8. With these values the optimal point for the input variables was established, obtaining Xf = 10%db and Bf = 2.98%db, which corresponds to a degradation of only 5.7% related to the initial content of bixin.
CONCLUSIONS
Through the analysis of the contour curves of the responses Xf and Bf keeping the air mass flow rate constant at 77.4kg/h, it was possible to identify the optimal region of work for the fixed bed drying process of annatto seeds, considering the inlet variables: Tg (74 to 94oC) and t (199 to 336 min). The final moisture content was obtained in the interval of 5 to 10%db and final concentration of bixin was higher than 2.86%bs, values recommended in order to maintain the quality of the material.
The calculated value for the over-all desirability function was considered satisfactory and excellent, enabling the correct estimation of the optimal operation point for the input variables: Tg=94oC, t =199 min and G = 50 kg/h. The responses obtained at this point were Xf = 10%db and Bf=2.98%db.
The information provided by this work may be used to evaluate the efficiency of similar drying processes under the same range of operational conditions and, if necessary, to promote the changes in the process conditions towards the direction of optimization, aiming to predict the moisture content and the final concentration of bixin in the annatto seeds.
NOMECLATURE
B bixin content, %db
Dj overall desirability function, dimensionless Dj desirability function, dimensionless
Ds distance of the estationary point from the design center F Fisher statistic (F-test), dimensionless
G air mass flow rate, kg/s
k number of independent variables or factors n number of axial points
nC number of center points replications nf number of factorial point of the project Nt total number of design points
Pr probability, dimensionless
R coefficient of correlation, dimensionless R2 coefficient of determination, dimensionless
t time , min
Tg gas temperature, oC
W1, W2, transformed independent variables in W3...Wk canonical forms
X moisture content, %db
x1, x2, x3 coded variables
x1S, x2S, x3S coordinate of the stationary point
fitted value of response variable
S
predicted variable at stationary point
axial space value
eigenvalues
Subscripts
db dry basis
f final
i initial
s dry bulb
u wet bulb
wb wet basis
1 inlet
2 exit
REFERENCES
Akhnazarova, S. and Kafarov, V. Experiment optimization in chemistry and chemical engineering. Moscow: Mir, (1982). [ Links ]
ASHRAE. Psychrometrics: theory and practice. Atlanta: American Society of Heating Refrigerating and Air-Conditioning Engineers, Inc., (1996). [ Links ]
Barros Neto, B.; Scarminio, I. S. and Bruns, R. E. Planejamento e otimização de experimentos, Campinas: Editora da UNICAMP, (1995). [ Links ]
Box, G. E. P. and Draper, N. R. Empirical model-building and response surfaces. New York: Wiley, (1987). [ Links ]
Faria, L. J. G. Análise experimental do processo de secagem de urucum (Bixa orellana
L.) em leito fixo. (D. Eng. Thesis). Campinas: DTF/FEQ/ UNICAMP, (1998). [ Links ]
Khuri, A. I. and Cornell, J. A. Response surfaces: designs and analyses. New York: Marcel Dekker, (1987). [ Links ]
McKeown, G. G. Paper chromatography of bixin and related compounds. Journal of the AOAC. v. 44, n. 2, p.347-351, (1961). [ Links ]
McKeown, G. G. and Mark, E. The composition of oil-soluble annatto food colors. Journal of the AOAC. v. 45, n. 3, p. 761-766 (1962). [ Links ]
Montgomery, D. C. Design and analysis of experiments. 3 rd., New York: Wiley, (1991). [ Links ]
Nothenberg, M. Tendência ecológica pede insumo natural, Química e Derivados, n. 350, p. 25-29 (1997). [ Links ]
Ohashi et al. O urucu, uma opção para o estado do Pará. Belém: Sagri, (1992). [ Links ]
Reith, J. F. and Gielen, W. Properties of bixin and norbixin and the composition of annatto extracts. Journal of Food Science. v. 36, p. 861-864 (1971). [ Links ]
Rocha, S. C. S. and Faria, L. J. G. A Psychrometer for measurement of air humidity at high temperatures. In: MUJUMDAR, A. S. (Ed.) Drying’92, New York, Elsevier Science Publishers, v. B, p. 1768-1779 (1992). [ Links ]
Rouseff, R. L. High performance liquid chromatographic separation and spectral characterization of the pigments in turmeric and annatto. Journal of Food Science. v. 53, n. 6, p. 1823-1826 (1988). [ Links ]
Simpson, K. L. Chemical changes in natural foods pigments. In: RICHARDSON, T.; FINLEY, J. W. (Eds.) Chemical changes in food during processing, New York, AVI, 1985. [ Links ]
Takahashi, M. Y. Extratos de urucum. In: (Coord.) Monografia de corantes naturais para fins alimentícios: padrões de identidade e qualidade. 2. ed., São Paulo, p. 22-29 (1987). [ Links ]
Wexler, A. and Brombacher, W. G. Methods of measuring humidity and testing hygrometers. United States Department of Commerce, (1951). (NBS Circular, 512) [ Links ]
*To whom correspondence should be addressed
Todo o conteúdo deste periódico, exceto onde está identificado, está licenciado sob uma Licença Creative Commons
Associação Brasileira de Engenharia Química
Rua Líbero Badaró, 152 , 11. and. 01008-903 São Paulo SP Brazil
Tel.: +55 11 3107-8747 Fax.: +55 11 3104-4649 Fax: +55 11 3104-4649