Acta Scientiarum
http://www.uem.br/acta ISSN printed: 1679-9275 ISSN on-line: 1807-8621
Doi: 10.4025/actasciagron.v39i4.32828
Forage yield and quality of marandugrass fertigated with treated
sewage wastewater and mineral fertilizer
Gilmar Oliveira Santos1*, Rogério Teixeira de Faria2, Gilberto Aparecido Rodriguês3, Geffson de Figueredo Dantas2, Alexandre Barcellos Dalri2 and Luiz Fabiano Palaretti2
1
Universidade de Rio Verde, Fazenda Fontes do Saber, Cx. Postal 104, 75901-970, Rio Verde, Goiás, Brazil. 2Universidade de São Paulo, Jaboticabal, São Paulo, Brazil. 3Taquaritinga Technology College, Taquaritinga, São Paulo, Brazil. *Author for correspondence. E-mail: gilmar@unirv.edu.br
ABSTRACT: The high consumption of water in irrigated agriculture and lack of alternative water sources make reusing sewage water a highly promising option for irrigation. This paper is aimed at evaluating
Brachiaria brizantha cv. Marandu forage quality and yield when fertigated with treated sewage wastewater
(TSW) and mineral fertilizer, in the 2013 and 2014 crop years in Jaboticabal, São Paulo State, Brazil. A homogeneous water depth was applied using a triple-line sprinkling irrigation system under a gradual TSW application, using the following TSW and water ratios: E5 = 1.0; E4 = 0.87; E3 = 0.6; E2 = 0.31, E1 = 0.11, and E0 = 0.0. Annual biomass yield increased with the TSW application, ranging from 31.3 to 47.4 Mg ha-1 in 2013 and from 25.7 to 56.9Mg ha-1 in 2014, for E1 and E5, respectively. Forage yield had
marked seasonality, with the highest values in summer (35.9 to 44.7%) and spring (35.7 to 38.4%) and the lowest ones during the fall-winter seasons (19.6 to 25.7%). Despite the high nitrogen rates (1,132 kg ha-1),
maximum forage yield was not achieved, hence further nitrogen increments would still enhance yield. Forage improved quality has counterbalanced the low fall-winter yields in terms of crude protein (CP) and neutral detergent fibre (NDF).
Keywords: wastewater, irrigation, pasture, forage quality.
Rendimento e qualidade de forragem de capim-marandu fertirrigado com água residuária
de esgoto tratado e adubo mineral
RESUMO. O alto consumo de água na agricultura irrigada e falta de fontes alternativas de água tornar a reutilização da água de esgoto uma opção altamente promissora nesta atividade. Este trabalho teve como objetivo avaliar o rendimento e a qualidade da forrageira Brachiaria brizantha cv. Marandu fertirrigada com águas residuais de efluente de esgoto tratado (EET) e fertilizante mineral, nos anos de 2013 e 2014, em Jaboticabal, Estado de São Paulo, Brasil. A lâmina homogênea da água foi aplicada por um sistema de irrigação por aspersão em linha tripla, mas sob aplicação gradual EET, usando os seguintes EET e água proporções: E5 = 1,0; E4 = 0,87; E3 = 0,6; E2 = 0,31, E1 = 0,11 e E0 = 0,0. O rendimento anual de biomassa aumentou com aplicação EET, variando 31,3-47,4 Mg ha-1 em 2013 e 25,7-56,9 Mg ha-1 em 2014,
para E1 e E5, respectivamente. Houve sazonalidade na produção de forrageira, com os valores mais elevados no verão (35,9 a 44,7%) e primavera (35,7 a 38,4%) e as mais baixas durante a temporada de outono-inverno (19,6 a 25,7%). Apesar das altas doses de nitrogênio (1.132 kg ha-1), o rendimento máximo
de forragem não foi alcançado, de modo que novos aumentos de nitrogênio ainda possam melhorar o rendimento. As baixas produtividades no outono-inverno foram compensadas pela melhor qualidade da forrageira em proteína bruta (PB) e fibra em detergente neutro (FDN).
Palavras-chave: águas residuais, irrigação, pasto, qualidade da forragem.
Introduction
Applying treated sewage effluent to crops is a common practice that dates back to before the BC period, starting from Germany and England within the sixteenth and seventeenth centuries (Veloso, Duarte, & Silva, 2004). These countries have had a primary goal of preventing pollution in waterways instead of raising agricultural yield.
The major limitation of TSW usage in farming systems is trace elements, often present in irregular effluent. TSW pathogens such as streptococcus,
Salmonella sp., Shigella sp., larvae, protozoa (cysts)
and viruses (enteroviruses and rotaviruses) cannot withstand soil environment conditions for more than a few hours, except for helminth eggs.
Forage plants have been sorted for cultivation under TSW application because of their long growth cycle associated with high annual water consumption, nutrient absorption and the ability to prevent soil erosion (Fonseca, Herpin, Paula, Victoria, & Melfi, 2007a; Oliveira Filho et al., 2011). Moreover, grasses belonging to the Brachiaria genus meet the tolerance requirements of high soil moisture, salinity, organic matter content and possible toxic effects of TSW.
Grass growth in the tropics is often restrained by soil nitrogen deficiency (Vitor et al., 2009; Serafim & Galbiatti, 2012). Low forage yields are caused by a lack of scientific expertise as reflected in herd characteristics, animal weight fluctuations (i.e., within animal breeding, raising or finishing, low milk or meat yields), and consequently a lower market value. Furthermore, nitrogen is the most limiting factor in biomass production after water (Nogueira et al., 2013).
TSW is rich in macro and micronutrients essential for the growth of most crops, making its use convenient in farming (Bertoncini, 2008; Oliveira Filho et al., 2011; Silva, Matos, Borges, & Previero, 2012; Nogueira et al., 2013; Pinto, Cruz, Frigo, Frigo, & Hermes, 2013). Additionally, it also provides an increase in irrigated areas, even in those under jeopardized water use conditions (river basins under critical conditions).
The management of pastures with wastewater has been providing higher forage nutritional quality (Alencar et al., 2009, Teixeira et al., 2011; Serafim & Galbiatti, 2012; Matos, Silva, Lo Monaco, & Pereira, 2013; Nogueira et al., 2013). In addition to enhanced yield (Drumond, Zanin, Aguiar, Rodriguês, & Fernandes, 2006; Fonseca et al., 2007b; Silva et al., 2012), it is also good for supplying water and nutrient demands in a sustainable way and avoiding direct TSW discharge into water bodies (Bertoncini, 2008).
Leaf protein synthesis is assigned to water availability and soil fertility, mostly nitrogen, which reflects in higher digestible protein (CP) and reduces levels of less digestible fibre (NDF) for forages (Freitas et al., 2007; Geron et al., 2014), producing a forage of better quality for animal consumption.
Studying urban development, water resource management and the use of wastewater for irrigation
in India, Van Rooijen, Biggs, Smout, and Drechsel (2010) concluded that wastewater use in agricultural lands is a contribution to food security and public health, in addition to improving the quality of water downstream of cities as well as reducing the demand for underground water in agriculture.
Reduced production costs associated with decreasing the use of mineral fertilizer may justify the economic feasibility of wastewater use in agriculture (Alencar et al., 2010; Nogueira et al., 2013). Additionally, fertigated areas should be connected to sewage treatment plants, thereby minimizing transportation costs.
Increased yields and forage quality are expected when using nitrogen fertigation with TSW in Brachiaria
brizantha cultivation, coupled with reducing input costs
and underground water use in agricultural lands. Investigations under these conditions would provide guidelines for wastewater use in Brazilian agriculture. Based on this research, we aimed to evaluate the response (forage yield and quality) of Brachiaria
brizantha cv. Marandu to fertigation with various
treated sewage wastewater rates and mineral fertilizer during the years of 2013 and 2014 in Jaboticabal, São Paulo State, Brazil.
Material and methods
The experiment was carried out in 2013 and 2014 at the College of Agricultural and Veterinarian Sciences at the São Paulo State University (FCAV-UNESP), in Jaboticabal, São Paulo State, Brazil (21°14’41,9” S and 48°16’25.2” W).
The soil is classified as Eutrophic Red Latosol – Lve (Red Oxisol), with a clayey texture (> 50%), high iron content, gentle landforms and high fertility (Table 1).
Table 1. Soil chemical characteristics of samples collected from the experimental area within a depth of 0 to 1.0 m, in November of 2012, Jaboticabal, São Paulo State, Brazil.
pH OM K Ca Mg H+Al BS CEC Al P B Cu Fe Mn Zn S V g dm-3 ---- mmol dm-3 --- --- mg dm-3 --- %
5.5 20 4 25 12 27 40 68 0 53 0.3 3.4 12 18 2 24 57
In this study, we used treated sewage wastewater from a sewage treatment plant (STP) near the experimental area. Treatments performed in this STP consist of a mixed system (aerobic and anaerobic) composed of an up-flow anaerobic digester and facultative lagoons. This plant collects sewage from Jaboticabal, with an average flow of 202 L hab-1. The city has approximately 71,662
inhabitants, in an area of 707 km2 and a population
Forage fertigated with treated sewage wastewater and mineral fertilizer 517
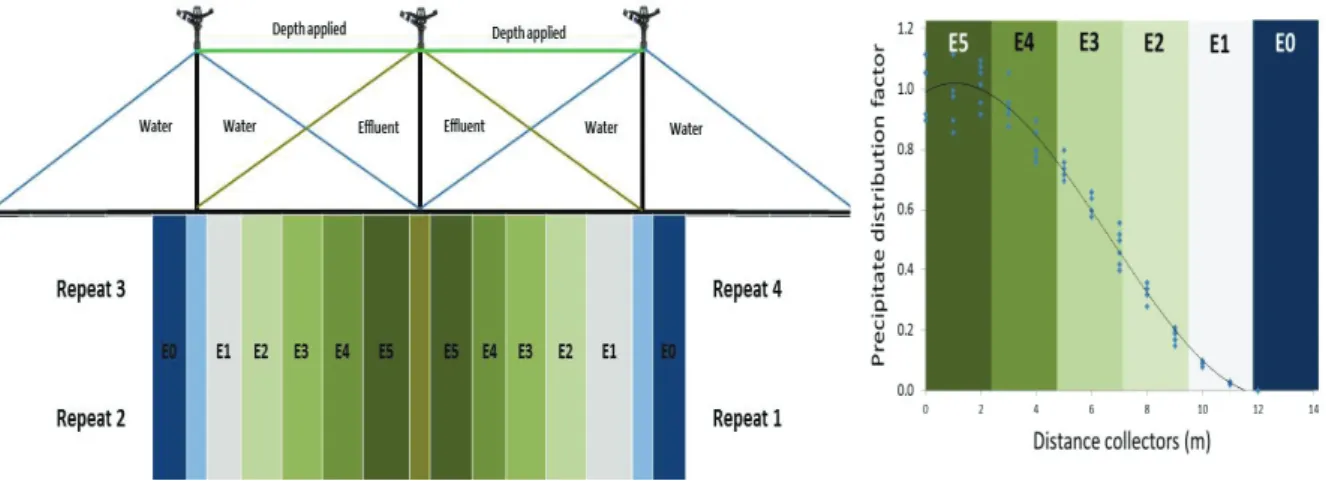
The experiment was performed over a floor area of 345.6 m2, consisting of 24 plots (2.4 m wide and 6.0 m
long) of 14.4 m2. Homogeneous distribution of water
depth and gradual application of TSW were carried out by a triple-line sprinkling system (Lauer, 1983) at 30 m.c.a working pressure (0.042 ksi). Uniformity coefficients of Christiansen (CUC) and distribution (DU) were 88.8% and 83.5%, respectively; thus, it was possible to define six treatments with four replications by applying the following TSW water ratios: E5 = 1.0; E4 = 0.87; E3 = 0.6; E2 = 0.31; E1 = 0.11, and E0 = 0.0 and distribution model of TSW (Y = 0.0015 X3 -
0.029 X2 + 0.057 X + 0.99; R2 = 0.98; Figure 1).
TSW monthly samples were collected to analyse nitrogen concentration, and at the end of each season, complete analyses of nutrients were made using TSW samples.
Prior to the experiment, Brachiaria brizantha cv. Marandu seeds were sown into 0.2 m rows and at a rate of 10 kg ha-1. During this operation, fifty
kilograms of superphosphate were applied per hectare.
Fertigation control was in accordance with plant nutritional demand, according Dantas et al. (2016), and consisted of 15 kg ha-1 nitrogen (N),
3.5 kg ha-1 phosphorus (P) and 18 kg ha-1 potassium
(K) per dry biomass megagram (Mg). However, water demand followed the FAO 56 method in the reference treatment (E3), which was considered the criterion of greatest value within a 28-day interval. In the E0 treatment, a mineral fertilizer (NPK) equivalent to nutrient demand in the reference treatment (E3) was applied. Higher rates in E3 in the same season were utilized to supply crop water requirements. The application of TSW in the
experimental area considered the criteria established by the Technical Standard P4.230 (CETESB, 1999). Dry biomass yield was assessed by harvesting grass. Grass was cut at 0.15 m height, except for the three first harvests when it was at 0.2 m, every 28 days (from Feb. 5, 2013 to Jan. 6, 2014). Eight summer harvests, 10 fall-winter harvests and 8 spring harvests were performed. The adopted management enabled 13 cut cycles and 2 harvests per year, which were done in a single month, one at the beginning and the other at the end.
Cuttings were aided by 0.25 m2 templates randomly
thrown three times (replications) over each plot and four times per treatment. Replications were homogenized and one sample was withdrawn for weighing. Then, the selected sample was dried in a forced circulation air oven at 65°C up to constant weight for dry biomass determination (Lacerda, Freitas, & Silva, 2009). Before being collected, plant height was measured using acetate sheets thrown randomly onto the lawn in six replications per plot.
Nitrogen yield was calculated by the ratio between dry biomass production and the amount of nitrogen applied.
A forage qualitative study analysing crude protein (CP) and neutral detergent fibre (NDF) was conducted in a quarterly basis per respective season using a methodology proposed by Silva and Queiroz (2006).
Forage yield data were analysed per season according to Johnson, Chaudhuri, and Kanemasu (1983), using the GLM procedure of SAS software, and the averages were compared by Tukey’s test at 1% and 5% probability. Response functions were adjusted between dry biomass yield and qualitative characteristics according to the amount of nitrogen applied via TSW.
Results and discussion
TSW analyses confirmed high annual average concentrations of essential nutrients for Brachiaria
growth, such as total nitrogen (52.9 ± 7.0 mg L-1).
Concentrations of potassium (20.3 ± 7.2 mg L-1)
and phosphorus (1.1 ± 0.4 mg L-1) were,
respectively, ideal and low for forage fertigation purposes (Table 2). Although TSW salinity was low (< 0.46 dS m-1) by electrical conductivity evaluation,
low sodium concentrations were observed (58.8 ± 8.7 mg L-1) but in a low adsorption ratio (SAR = 3.3
± 0.6), which is above the critical level. In addition, there was also a high total coliform count and the presence of Escherichia coli in the effluent.
Other nutrients were applied in the following amounts in E5: P = 27, K = 314, Ca = 258, Mg = 92, Na = 894, SO = 369, Fe = 6, Mn = 1, and Zn = 11, in 2013, and P = 21, K = 463, Ca = 358, Mg = 108, Na = 1,428, SO = 421, Fe = 17, Mn = 2, and Zn = 3, in 2014, in kg ha-1. The remaining
treatments were given quantities proportional to application ratios as defined for each treatment.
Mineral fertilizers (E0) were applied in summer, fall-winter and spring at the rates of 189, 85, and 182 kg ha-1
N in 2013, and 200, 157, and 292 kg ha-1 N in 2014.
Superior nitrogen levels in E3 were applied in the same seasons to fulfil the crop water requirements.
Irrigation water depths for summer, fall-winter and spring were, respectively, 678, 500, and 675 mm in 2013, and 750, 661, and 842 mm in 2014. The total depth of irrigation and precipitation is shown in Table 3.
Mineral P and K fertilizers at the respective rates of 96 and 554 kg ha-1 (2013) and 136 and 696 kg ha-1 (2014)
supplemented all treatments. Fertilizations were scheduled as needed for each cutting cycle of the crop (28 days).
Thus, an amount of 931 and 1,132 kg ha-1
nitrogen was applied to the E5 treatment (Table 4). Moreover, a greater nitrogen increment in the second year stemmed from the higher dry biomass yield.
Rising temperatures, reduced rainfall, and consequently, greater water demand in 2014 led to higher forage yields. During 2013 and 2014, the average temperatures were 22.2, and 23.3°C, respectively, with maximum values of 34.1, and 36.5°C and minimum values reaching 8.2, and 11.9°C; however, annual average rainfall was 1,393 mm, and 721 mm with an evapotranspiration of 1,398 mm, and 1,616 mm.
Table 2. Chemical, physical and microbiological characteristics of treated sewage wastewater (TSW) from a sewage treatment plant (STP) in Jaboticabal, São Paulo State, Brazil, in the summer, fall-winter and spring seasons of 2013 and 2014.
Factors Unit of measure Summer
Fall-Winter Spring Average
Acceptable level
pH - 6.7 7.2 7.1 7.0±0.3 5-9a
EC dS m-1 0.44 0.49 0.42 0.46±0.01 <3b
TOC mg L-1 56.1 48.0 45.0 49.4±19.1 -
NO3 mg L-1 2.1 5.8 4.5 4.5±2.4 <10c
NO2 mg L-1 1.0 0.04 0.04 0.25±0.8 <0.02c
NH3 mg L-1 31.4 35.7 31.6 33.3±15.8 1-40c
Total N mg L-1 44.3 57.8 51.7 52.9±7.0 -
Total Fe mg L-1
0.28 0.62 0.60 0.53±0.3 <5b
K mg L-1 25.3 19.1 17.2 20.3±7.2 10-40c
P mg L-1 1.3 1.0 1.0 1.1±0.4 <2b
Ca mg L-1 9.3 15.9 21.2 15.5±6.4 20-120c
Mg mg L-1 7.5 4.9 7.0 6.2±2.6 10-50c
Zn mg L-1 0.1 0.5 0.2 0.27±0.32 <5a
Na mg L-1 60.3 54.1 64.3 58.8±8.7 50-250c
SAR - 3.7 2.9 3.2 3.3±0.6 4.5-7.5c
TCC MPN100-1 ml 9,450 102,666 16,350 51,371±62,795 <10,000c
EC MPN100-1 ml 495 6,370 11,650 6,200±8,267 <1,000c
Obs.: pH: Hydrogen ionic potential; EC: Electrical conductivity; TOC: Total organic carbon; NO3: Nitrate; NO2: Nitrite; NH3: Ammonium; Total N: Total nitrogen; Total
Fe: Total iron; K: Potassium; P: Phosphorus; Ca: Calcium; Mg: Magnesium; Mn: Manganese; Zn: Zinc; Na: Sodium; SAR: Sodium absorption rate; TCC: Total coliform count; EC: Escherichia coli. MPN: Most probable number. Source: a
Brasil (2011); bAyers and Westcot (1976); cFeigin, Ravina, and Shalhevet (1991).
Table 3. Total water depth (water and effluent) and precipitation applied in the experiment in the summer, fall-winter and spring seasons of 2013 and 2014.
Year Season Precipitation Irrigation Irrigation depth (mm)
2013 Summer 748 678 1,426
Fall-winter 221 500 721
Spring 424 675 1,089
Total 1,393 1,853 3,246
2014 Summer 348 750 1,098
Fall-winter 102 661 763
Spring 271 842 1,113 Total 720 2,252 2,974
Table 4. Nitrogen fertilization through TSW (kg ha-1) in the
summer, fall-winter and spring seasons of 2013 and 2014.
Year Season E5 E4 E3 E2 E1
Summer 307 270 186 95 34
2013 Fall-winter 258 227 156 80 28
Spring 365 321 221 112 40
Total 931 817 564 287 102
Summer 346 304 210 107 38
2014 Fall-winter 366 321 222 113 40
Spring 420 369 255 130 46
Total 1,132 994 687 350 124
Forage fertigated with treated sewage wastewater and mineral fertilizer 519
Table 5. Average chemical characteristics of the soil in the experimental area at 0-1.0 m depths in September of 2014, Jaboticabal, São Paulo State, Brazil.
Treatment pH OM P resin K Ca Mg H+Al BS CEC V
g dm-3 mg dm-3 mmol dm-3 %
E5 5.7 21.0 41.5 3.7 31.7 13.7 24.0 49.1 73.1 65.5 E4 5.7 18.5 31.5 3.2 30.0 13.7 22.3 46.9 69.2 65.7 E3 5.6 21.0 43.8 3.8 32.2 14.2 23.7 50.1 73.8 66.0 E2 5.6 18.5 29.8 3.3 26.5 12.3 23.5 42.1 65.6 61.5 E1 5.5 17.3 26.5 3.5 22.8 10.7 24.3 37.0 61.3 57.7 E0 5.5 20.7 34.2 3.4 27.7 12.3 26.0 43.4 69.4 60.0
Treatment B Cu Fe Mn Zn S-SO4 Al
mg dm-3 mmol dm-3
E5 0.3 3.7 13.2 17.7 1.7 42.0 0.0
E4 0.3 3.3 11.8 12.7 1.4 42.0 0.0
E3 0.3 3.5 14.7 9.9 1.7 39.8 0.0
E2 0.3 3.1 14.2 9.5 1.4 32.7 0.0
E1 0.2 2.8 13.2 8.5 1.0 31.5 0.0
E0 0.2 3.3 15.2 15.2 1.5 25.3 0.0
Seasonal effects marked forage production, with high values present from October to April and low ones between May and September (Tables 6). High yields were reported in summer (44.7%) and spring (35.7%) of 2013, due to climatic factors that increased plant metabolic activities and, thus, promoted forage growth. In contrast, the low yield in autumn-winter (19.6%) was due to sub-optimal conditions for crop growth.
Table 6. Dry biomass yield during cutting cycles in 2013.
Month Date Cycle (Mg ha
-1)
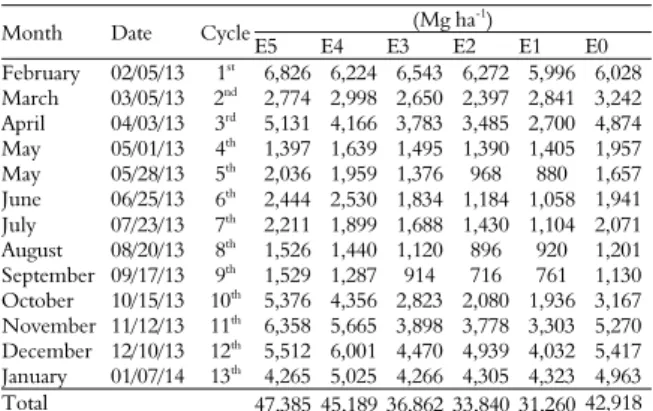
E5 E4 E3 E2 E1 E0 February 02/05/13 1st 6,826 6,224 6,543 6,272 5,996 6,028
March 03/05/13 2nd
2,774 2,998 2,650 2,397 2,841 3,242 April 04/03/13 3rd 5,131 4,166 3,783 3,485 2,700 4,874
May 05/01/13 4th 1,397 1,639 1,495 1,390 1,405 1,957
May 05/28/13 5th 2,036 1,959 1,376 968 880 1,657
June 06/25/13 6th 2,444 2,530 1,834 1,184 1,058 1,941
July 07/23/13 7th 2,211 1,899 1,688 1,430 1,104 2,071
August 08/20/13 8th
1,526 1,440 1,120 896 920 1,201 September 09/17/13 9th 1,529 1,287 914 716 761 1,130
October 10/15/13 10th
5,376 4,356 2,823 2,080 1,936 3,167 November 11/12/13 11th 6,358 5,665 3,898 3,778 3,303 5,270
December 12/10/13 12th 5,512 6,001 4,470 4,939 4,032 5,417
January 01/07/14 13th
4,265 5,025 4,266 4,305 4,323 4,963 Total 47,385 45,189 36,862 33,840 31,260 42,918
In 2014, high values of average yields were obtained in spring (38.4%), followed by summer (35.9%) and fall-winter (25.7%) (Table 6). Cumulative results per season showed that in 2013, the highest average of forage performance occurred in summer (17.7 Mg ha-1), followed by
spring (14.1 Mg ha-1) and fall-winter (7.8 Mg ha-1)
(Table 7).
Rainfall reduction (672 mm) and an increase in temperature (1.1°C) and solar radiation (312.5 MJ m-2 year-1), mainly from March to November
of 2014, resulted in improved dry biomass yield,
with a sharper production gradient in 2013. Furthermore, in 2014, there was an increase in biomass production from 25.7 Mg ha-1 (E1) to 56.9
Mg ha-1 (E5), corresponding to an increase of 121%.
These results agree with Fonseca et al. (2007b) and Matos et al. (2013).
Table 7. Dry biomass yield per treatment over the cutting cycles in 2014.
Month Date Cycle (Mg ha
-1)
E5 E4 E3 E2 E1 E0 February 02/04/14 14th
4,332 3,285 3,169 3,369 3,026 4,610 March 03/04/14 15th 5,074 4,761 2,973 3,707 3,125 3,837
April 04/01/14 16th 3,611 4,077 3,247 2,732 2,850 4,293
April 04/29/14 17th 4,985 4,541 4,232 4,054 3,842 3,908
May 05/27/14 18th 2,816 2,768 2,037 1,717 1,686 2,590
June 06/24/14 19th 1,958 1,803 1,649 1,241 852,0 1,896
July 07/22/14 20th 2,397 1,955 1,251 797,0 626,0 1,915
August 08/19/14 21st
2,278 1,512 1,287 993 682 1,536 September 09/16/14 22nd 3,183 2,806 1,431 1,004 717 2,203
October 10/14/14 23rd 6,834 5,687 3,563 2,363 1,455 3,833
November 11/11/14 24th 7,127 6,462 4,789 3,055 2,106 7,030
December 12/09/14 25th 6,813 7,152 5,132 3,657 2,793 6,910
January 01/06/15 26th 5,497 4,444 3,902 3,503 1,974 6,237
Total 56,907 51,253 38,662 32,191 25,736 50,797
A variance analysis of summer forage yield revealed that the factors cultivation year, TSW rate and TSW x year interaction were significant (Table 8). The coefficient of variation was 9.6%, which shows high experimental accuracy.
Table 8. Variance analysis summary (ANOVA) and comparison of biomass yield averages of Brachiaria brizantha fertigated with treated sewage wastewater (TSW) in the summer of 2013 and 2014.
Variation source DF Mean square Pr (>F)
Block (B) 3 2,132,262.5ns 0.4801
Year (Y) 1 69,547,860.1*
<0.0001
Interaction BxY 3 5,984,640.0ns 0.0901
TSW 5 41,835,894.5** <0.0001
Interaction TSWxY
5 7,312,756.4*
0.0299
V.C. (%) 9.6
Year Average yield of dry biomass (Mg ha-1)
2013 17.7 a
2014 15.3 b
Treatment 2013 (Mg ha-1) 2014 (Mg ha-1) Average (Mg ha-1)
E5 19.0 a 18.5 a 18.9
E4 18.4 a 16.6 ab 17.5
E3 17.2 a 13.3 bc 15.3
E2 16.5 a 13.3 bc 14.9
E1 15.8 a 10.9 c 13.4
E0 19.1 a 19.0 a 19.0
Average 17.7 15.3 -
DF – degree of freedom; Significant at 0.05 (*) and at 0.01 (**) of probability; (ns)
non-significant; V.C. – variation coefficient; Averages followed by the same letter in the upper right do not differ by Tukey’s test (p < 0.05).
The average comparisons showed a higher forage yield in 2014 compared to 2013. Statistical breakdown of the TSW x year interaction showed similar yield averages in the summer of 2013.
the summer of 2014, the highest average yields were observed for E5, E4, and E0; however, E3, E2, and E1 had the lowest averages, but the E4 and E3 averages did not differ significantly.
During the fall-winter season, we observed significant results for the year and TSW rates; however, there was no interaction between them (Table 9). The coefficient of variation was 13.5%. Moreover, biomass yield in 2014 surpassed the findings for 2013.
Table 9. Variance analysis summary (ANOVA) and comparison of biomass yield averages of Brachiaria brizantha fertigated with treated sewage wastewater (TSW) during the fall-winter of 2013 and 2014.
Variation source DF Mean square Pr (>F)
Block (B) 3 6,222,510.2ns
0.018
Year (Y) 1 122,212,110.0** <0.0001
Interaction B x Y 3 1,631,663.1ns 0.3949
TSW 5 36,929,215.3** <0.0001
Interaction TSW x Y 5 1,432,577,0ns 0.4932
V.C. (%) 13.5
Year Average yield of dry biomass (Mg ha-1
)
2013 7.8 b
2014 11.0 a
Treatment 2013 (Mg ha-1) 2014 (Mg ha-1) Average (Mg ha-1)
E5 9.6 14.5 12.0 a
E4 9.5 12.6 11.0 a
E3 7.5 10.5 9.0 bc
E2 5.9 8.8 7.4 cd
E1 5.4 7.7 6.6 d
E0 8.8 11.8 10.3 ab
Average 7.8 11.0 -
DF – degree of freedom; Significant at 0.05 (*) and at 0.01 (**) of probability; (ns)
non-significant; V.C. – variation coefficient; Averages followed by the same letter in the upper right do not differ by Tukey’s test (p < 0.05).
When comparing TSW rates, we noticed higher yields for E5, E4, and E0, with no significant differences between E3 and E0. In addition, relatively low rates of nitrogen (E1) reduced biomass yield by up to 84.2% compared with the maximum rates (E5). During this season, biomass yield did not reach the minimal level for cattle grazing, which is 1,200 kg ha-1 (Silva et al., 2012), within the 28-day
intervals. This yield drop is associated with low temperatures, humidity and light, which are limiting factors for grass development, unlike what is observed in summer and spring. The growth of C4 grasses is highly demanding of temperature and luminosity (Matos et al., 2013). Maranhão et al. (2010) proved this fact in a study of nitrogen levels
on Brachiaria, observing a 78.9% reduction in dry
biomass from summer to winter. Similar results were obtained by Alencar et al. (2009) and Oliveira Filho et al. (2011).
As for spring data, we observed significant effects of year, TSW rates and their interaction, with a variation coefficient of 10.3% (Table 10). In 2014, biomass yield was higher than in 2013 (41%). Furthermore, in 2014, peaks of higher and lower
biomass yield for E5 (24 Mg ha-1) and E1 (7 Mg ha -1) were recorded, respectively. It is worth
mentioning that in warmer periods with high solar radiation, as in 2014, increased yields occurred.
Table 10. Variance analysis summary (ANOVA) and comparison of biomass yield averages of Brachiaria brizantha fertigated with treated sewage wastewater (TSW) in the spring of 2013 and 2014.
Variation source DF Mean square Pr (>F)
Block (B) 3 11,248,379** 0.0091
Year (Y) 1 59,748,413**
<0.0001
Interaction BxY 3 10,628,428* 0.0116
TSW 5 207,980,458** <0.0001
Interaction TSWxY 5 25,456,396**
<0.0001
V.C. (%) 10.3
Year Average yield of dry biomass (Mg ha-1)
2013 16.3 a
2014 14.1 a
Treatment 2013 (Mg ha-1
) 2014 (Mg ha-1
) Average (Mg ha-1
)
E5 18.8 Abc 24.0 a 21.4
E4 17.3 Bc 22.1 ab 19.7
E3 12.1 De 14.9 de 13.5
E2 11.5 De 10.0 fg 10.8
E1 10.0 Ef 7.0 g 8.5
E0 15.0 Cd 20.0 bc 17.5
Average 14.1 16.3 -
DF – degree of freedom; Significant at 0.05 (*) and at 0.01 (**) of probability; (ns)
non-significant; V.C. – variation coefficient; Averages followed by the same letter in the upper right do not differ by Tukey’s test (p < 0.05).
The average rates of dry biomass growth in 2013 were 158, 56, and 126 kg ha-1 day-1 in the summer,
fall-winter and spring, respectively. The highest rates were observed in E0 (171 kg ha-1 day-1) and E5
(170 kg ha-1 day-1) during the summer, and the
lowest rate was observed for E1 (38 kg ha-1 day-1) in
the winter. Similar results were obtained by Dupas et al. (2010), Matos et al. (2013) and Dantas et al. (2016).
In 2014, the lowest average rates of biomass growth occurred in treatments with lower inputs of TSW (E1 and E2), corresponding to 136, 78, and 146 kg ha-1 day-1 in the summer, fall-winter and
spring, respectively. On the other hand, the largest rates were observed for E5 and E4 with 214 and 197 kg ha-1 day-1, respectively, during the spring; and the
lowest rate was observed in E1 (55 kg ha-1 day-1) in
the winter. These results agree with those of Andrade et al. (2012).
The dry biomass yield increased according to the nitrogen applied to the soil via TSW in all assessed seasons for the years of 2013 and 2014. Despite the high levels of nitrogen applied via TSW, in 2013 (931 kg ha-1; Y = 0.016 X2 + 2.53 X + 31,071; R2 =
0.99) and 2014 (1,132 kg ha-1; Y = 0.014 X2 + 12.53
+ 24,628; R2 = 0.99), forage yield peaks were not
Forage fertigated with treated sewage wastewater and mineral fertilizer 521
Nitrogen yield for treatments receiving TSW were 173.8, 77.9 and 102.5 kg of biomass per kg of N in the summer (Y = 0.0098 X2 - 4.64 X + 585.5; R2 = 0.95),
fall-winter (Y = 0.0053 X2 - 2.09 X + 231.49; R2 =
0.93) and spring (Y = 0.0038 X2 - 2.05 X + 312.81; R2
= 0,95) and 117 (Y = 0.0046 X2 - 2.46 X + 361.7; R2 =
0.96), 79 (Y = 0.0014 X2 - 0.87 X + 182.65; R2 = 0.93)
and 81.3 kg of biomass per kg of N (Y = 0.0027 X2 -
1.51 X + 236.7; R2 = 0.95), in 2014, respectively.
Regardless of the higher yield in 2014, the lowest nitrogen efficiency is related to the increase in TSW rates. Serafim and Galbiatti (2010) argued that lower rates had better nitrogen performance, thus confirming the results of our research. For Fonseca et al. (2007b), low water tension in soil derived from regular irrigation favours nitrogen performance and, as a consequence, enhances forage yield.
An improved leaf quality, in terms of CP (> 12%) and NDF (< 60%), was provided when forage had low yield. Therefore, in the fall-winter, low yields associated with a smaller leaf area and larger leaf-stem ratio resulted in higher CP content and lower NDF in both years (Tables 11 and 12). Furthermore, we observed a gradual increase in herbage quality in 2014, which occurred due to the increased TSW rates applied. Similar results were obtained by Dantas et al. (2016).
Table 11. Crude protein (%) of dry biomass of Brachiaria
brizantha due to the application rates of TSW and mineral
fertilizing in 2013 and 2014.
Year Season Treatments Average
E5 E4 E3 E2 E1 E0
2013
Summer 10.6 11.1 10.3 10.5 10.5 11.1 10.7 Fall-winter 16.4 15.0 14.0 13.4 12.6 13.9 14.2 Spring 12.3 11.0 11.8 10.7 13.2 13.6 12.1 Average 13.1 12.4 12.0 11.5 12.1 12.9 -
2014
Summer 15.0 14.9 13.0 10.9 12.2 12.8 13.1 Fall-winter 17.7 17.8 15.7 14.4 12.7 17.5 16.0 Spring 15.5 12.0 10.6 10.2 8.1 11.8 11.4 Average 16.1 14.9 13.1 11.8 11.0 14.0 -
Table 12. Neutral detergent fibre (%) of dry biomass of
Brachiaria brizantha due to the application rates of TSW and
mineral fertilizing in 2013 and 2014.
Year Season Treatments Average
E5 E4 E3 E2 E1 E0
2013
Summer 65.8 61.0 66.7 65.2 58.1 66.4 63.9 Fall-winter 57.1 56.8 60.4 61.5 61.2 55.5 58.8 Spring 62.6 60.5 62.9 57.8 64.9 62.4 61.9 Average 61.8 59.4 63.3 61.5 61.4 61.4 -
2014
Summer 55.1 55.8 57.0 60.6 61.1 55.1 57.5 Fall-winter 52.8 52.7 56.0 57.6 59.5 56.4 55.8 Spring 58.4 62.0 62.4 67.3 61.4 63.5 62.5 Average 55.4 56.8 58.4 61.8 60.7 58.3 -
Foliar analysis showed that the reference treatment (E3) had an ideal CP content, albeit below
average, for every season except fall-winter. This high content, shown in 2013, could be attributed to higher leaf production against stems since leaves carry the most nutrients, as shown in some previous reports. These results agree with those of Matos et al. (2013), Silva and Queiroz (2006), Castro et al. (2007), Serafim and Galbiatti (2012), Geron et al. (2014) and Dupas et al. (2010).
Forage fertigation with TSW has the potential to supply nitrogen and potassium to crops; however, this also causes phosphorus limitation and an average potential for soil salinization because of large concentrations of sodium and coliforms within this effluent. However, it has promoted high levels of good quality forage production, favourable for cattle feeding, weight gain per animal, reducing the use of underground water and mineral fertilizers, in addition to social and environmental benefits.
Using wastewater in agriculture enables irrigated areas to be extended and reduces the amount of sewage disposed of in receiving water bodies. It denotes an alternative to control pollution of water sources, lowering underground water and fertilizer demands, in addition to a sustainable agricultural management tool.
Conclusion
Brachiaria brizantha had positive responses to
TSW application, increasing annual dry biomass production from 31.3 to 47.4 Mg ha-1 in 2013 and
from 25.7 to 56.9Mg ha-1 in 2014, between E1 and
E5, respectively.
There was a marked seasonality in forage performance; the highest yields occurred in the summer (35.9 to 44.7%) and spring (35.7 to 38.4%), and the lowest yields (19.6 to 25.7%) with improved forage quality were observed in the fall-winter.
The constant use of TSW combined with growing levels resulted in forage production with an enhanced nutritional quality concerning crude protein and neutral detergent fibre.
Acknowledgements
This work was supported by the Foundation of the São Paulo State (FAPESP) [grant numbers 2012/12.923-3 e 2013/00362-0].
References
Alencar, C. A. B.; Cóser, A. C., Martins, C. E., Oliveira, R. A., Cunha, F. F., & Figueiredo, J. L. A. (2009). Produção de seus gramíneas manejadas por corte sob efeito de diferentes lâminas de irrigação e estações anuais. Ciência e Agrotecnologia, 33(5), 1307-1313. Alencar, C. A. B.; Cóser, A. C., Martins, C. E., Oliveira,
R. A., Cunha, F. F., & Figueiredo, J. L. A. (2010). Altura de capins e cobertura do solo sob adubação nitrogenada, irrigação e pastejo nas estações do ano.
Acta Scientiarum. Agronomy,32(1), 21-27.
Andrade, A. S., Drumond, L. C. D., Maicon, F. A., Moreira, D. D., Araújo, F. C., & God, P. I. V. G. (2012). Crescimento e composição bromatológica de Tifton 85 e Vaquero em pastagem fertirrigada. Global
Science and Technology, 5(2), 56-68.
Ayers, R. S., & Westcot, D. W. (1976). Calidad del agua para
la agricultura (Estudios FAO: Riegos y Drenajes, 29).
Roma, IT: FAO.
Bertoncini, E. I. (2008). Tratamento de efluentes e reuso da água no meio agrícola. Revista Tecnologia & Inovação
Agropecuária, 1(1), 152-169.
Brasil. Ministério do Meio Ambiente.Conselho Nacional do Meio Ambiente. (2011, 13 de Maio). Resolução n. 430, de 13 de maio de 2011. Diário oficial da União, Brasilia, DF, Seção 1, n. 92, p. 89.
Castro, G. H. F., Graça, D. S., Gonçalves, L. C., Maurício, R. M., Rodriguez, N. M., Borges, I., & Tomich, T. R. (2007). Cinética de degradação e fermentação ruminal
da Brachiaria brizantha cv. Marandu colhida em
diferentes idades ao corte. Arquivo Brasileiro de Medicina
Veterinária e Zootecnia, 59(6), 1538-1544.
Companhia de Tecnologia Ambiental do Estado de São Paulo [CETESB]. (1999). Norma Técnica, P4.230. São Paulo, SP: Cetesb.
Dantas, G. de F., Faria, R. T., Santos, G. O., Dalri, A. B., & Palaretti, L. F. (2016) Produtividade e qualidade da Brachiaria irrigada no outono-inverno. Engenharia
Agrícola, 36(3), 469-481.
Drumond, L. C. D., Zanini, J. R., Aguiar, A. de P. A., Rodriguês, G. P., & Fernandes, A. L. T. (2006). Produção de matéria seca em pastagem de Tifton 85 irrigada, com diferentes doses de dejeto líquido de suíno. Engenharia Agrícola, 26(2), 426-433.
Dupas, E., Buzetti, S., Sarto, A. L., Hernandez, F. B. T., & Bergamaschine, A. F. (2010). Dry matter yield and nutritional value of Marandu grass under fertilizantion and irrigation in cerrado in São Paulo. Revista Brasileira
de Zootecnia, 39(12), 2598-2603.
Feigin, A., Ravina, I., & Shalhevet, J. (1991). Irrigation with
treated sewage effluent: management for environmental
protection. Berlin, GE: Springer-Verlag.
Fonseca, A. F., Herpin, U., Paula, A. M., Victoria, R. L., & Melfi, A. J. (2007a). Agricultural use of treated sewage effluents: agronomic and environmental implications and perspectives for Brazil. Scientia Agricola, 64(2), 194-209.
Fonseca, A. F., Melfi, A. J., Monteiro, F. A., Mones, C. R., Almeida, V. V., & Herpin, U. (2007b). Treated sewage effluent as a source of water and nitrogen for Tifton 85 bermudagrass. Agricultural Water Management, 87(1), 328-336.
Freitas, K. R., Rosa, B., Ruggiero, J. A., Nascimento, J. L. do, Heinemam, A. B., Macedo, R. F., ... Oliveira, I. P. de. (2007). Avaliação da composição químico-bromatológica do capim Mombaça (Panicum maximum
Jacq.) submetido a diferentes doses de nitrogênio.
Bioscience Journal, 23(3), 1-10.
Geron, L. J. V., Cabral, L. S., Machado, R. J. T., Zeoula, M. Z., Oliveira, E. B., Garcia, J., ... Aguiar, R. P. S. (2014). Avaliação do teor de fibra em detergente neutro e ácido por meio de diferentes procedimentos aplicados às plantas forrageiras. Semina: Ciências
Agrárias, 35(3), 1533-1542.
Johnson, D. E., Chaudhuri, U. N., & Kanemasu, E. T. (1983). Statistical analysis of line-source sprinkler experiments and other nonrandomized experiments using multivariate methods. Soil Science Society of
American Journal, 47(2), 309-312.
Lacerda, M. J. R., Freitas, K. R., & Silva, J. W. (2009). Determinação da matéria seca de forrageiras pelos métodos de micro-ondas e convencional. Bioscience
Journal, 25(3), 185-190.
Lauer, D. A. (1983). Line source sprinkler systems for experimentation with sprinkler applied nitrogen fertilizers. Soil Science Society of America Journal, 47(1), 124-128.
Maranhão, C. M. A., Bonomo, P., Pires, A. J. V., Costa, A. C. P. R., Martins, G. C. F., & Cardoso, E. O. (2010). Características produtivas do capim-braquiária submetido a intervalos de cortes e adubação nitrogenada durante três estações. Acta Scientiarum.Animal Sciences, 32(4), 375-384. Matos, A. T., Silva, D. F., Lo Monaco, P. A. V., & Pereira, O.
G. (2013). Produtividade e composição química do capim-tifton 85 submetido a diferentes taxas de aplicação do percolato de resíduos sólidos urbano. Engenharia
Agrícola, 33(1), 188-200.
Nogueira, S. F., Pereira, B. F. F., Gomes, T. M., Paula, A. M., Santos, J. A., & Montes, C. R. (2013). Treated sewage effluent: agronomical and economical aspects on bermudagrass production. Agricultural Water Management,
116, 151-159. doi: 10.1016/j.agwat. 2012.07.005.
Oliveira Filho, J. C., Oliveira, E. M., Oliveira, R. A., Cecon, P. R., Oliveira, R. M., & Cóser, A. C. (2011). Irrigação e diferentes doses de nitrogênio e potássio na produção do capim Xaraés. Revista Ambiente & Água, 6(3), 255-262. Pinto, M. C. K., Cruz, R. L., Frigo, E. P., Frigo, M. S., &
Hermes, E. (2013). Contaminação das águas subterrâneas por nitrogênio devido à irrigação com efluente do tratamento de esgoto. Irriga, 18(2), 270-281.
Forage fertigated with treated sewage wastewater and mineral fertilizer 523
Silva, D. J., & Queiroz, A. C. (2006). Análise de alimentos:
métodos químicos e biológicos (3a ed.). Viçosa, MG: UFV.
Silva, J. G. D., Matos, A. T., Borges, A. C., & Previero, C. A. (2012). Composição químico-bromatológica e produtividade do capim-mombaça cultivado em diferentes lâminas de efluente do tratamento primário de esgoto sanitário. Revista Ceres, 59(5), 606-613. Teixeira, F. A., Bonono, P., Pires, A. J. V., Silva, F. F.,
Fries, D. D., & Hora, D. S. (2011) Produção anual e qualidade de pastagem de Brachiaria decumbes diferida e estratégias de adubação nitrogenada. Acta Scientiarum.
Animal Sciences, 33(3), 241-248.
Van Rooijen, D. J., Biggs, T. W., Smout, I., & Drechsel, P. (2010). Urban growth, wastewater production and use in irrigated agriculture: a comparative study of Accra, Addis Ababa and Hyderabad. Irrigation and Drainage
Systems, 24(1-2), 53-64.
Veloso, M. E. C., Duarte, S. N., & Silva, I. J. O. (2004). Potencial de uso de águas residuárias na agricultura como suprimento hídrico e nutricional. Engenharia
Rural, 15, 79-86.
Vitor, C. M .T., Fonseca, D. M., Cóser, A. C., Martins C. E., Nascimento Júnior, D., & Ribeiro Júnior, J. I. (2009). Produção de matéria seca e valor nutritivo de pastagem de capim-elefante sob irrigação e adubação nitrogenada. Revista Brasileira de Zootecnia, 38(3), 435-442.
Received on July 21, 2016. Accepted on December 2, 2016.
License information: This is an open-access article distributed under the terms of the Creative Commons Attribution License, which permits unrestricted use, distribution, and reproduction in any medium, provided the original work is properly cited.