UNIVERSIDADE DO ALGARVE
FACULDADE DE CIÊNCIAS E TECNOLOGIA
Environmental conditions and biotic communities
in Foz de Almargem and Salgados coastal lagoons,
Algarve (South Portugal)
Susana Isabel Eusébio Coelho
Tese para obtenção do grau de Doutor em Ciências Biológicas
(Especialidade em Ecologia das Comunidades)
Trabalho efectuado sob a orientação de:
Professora Doutora Sofia Gamito, Universidade do Algarve Professor Doutor Angel Pérez-Ruzafa, Universidade de Múrcia
Environmental conditions and biotic communities
in Foz de Almargem and Salgados coastal lagoons, Algarve
(South Portugal)
Declaração de autoria de trabalho
Declaro ser a autora deste trabalho, que é original e inédito. Autores e trabalhos consultados estão devidamente citados no texto e constam da listagem de referências
incluída.
____________________________________________________________ (Susana Isabel Eusébio Coelho)
Copyright de Susana Isabel Eusébio Coelho
A Universidade do Algarve tem o direito, perpétuo e sem limites geográficos, de arquivar e publicitar este trabalho através de exemplares impressos reproduzidos em papel ou de forma digital, ou por qualquer outro meio conhecido ou que venha a ser inventado, de o divulgar através de repositórios científicos e de admitir a sua cópia e distribuição com objectivos educacionais ou de investigação, não comerciais, desde que seja dado crédito ao autor e editor.
Ao Pai Xico e Mãe Malyn,
Dedico esta tese, por todo o seu apoio incondicional, paciência, carinho e força, tendo ELES contribuído de forma fundamental para a sua conclusão.
Ao Avô Eusébio e Avó Joaquina,
Com quem, infelizmente, já não posso partilhar o fim de uma longa etapa e o início esperançoso de uma nova.
ACKNOWLEDGEMENTS
I would like to acknowledge my supervisors, Professor Sofia Gamito, from the University of Algarve and Professor Angel Pérez-Ruzafa, from the University of Murcia, for encouraging me to finish the writing of this manuscript.
This thesis was financed by Fundação para a Ciência e Tecnologia (PRAXIS XXI/BD/21521/99).
This thesis also had the logistic support of the former Direcção Regional do Ambiente e Ordenamento do Território do Algarve (CCDR-ALGARVE), namely in the field trips for water samples collection and in some of the laboratory analyses performed on physical and chemical water parameters. A particular thank to Dr. Ana Paula Gaspar, who participated in the field trips and provided information and literature about the studied lagoons.
I would like to thank to:
Professor Delminda Moura (CIMA), for giving permission to use the geology laboratory, for the advices on the methodology and for helping on the analyses of sediment grain-size data;
Professor Rui Santos (CCMAR), for letting me use the laboratory equipment to perform phytopigments analyses;
Paulo Pedro from ITUCA, for conducting nutrients analyses of water samples;
Dr. Silvia Condinho, for helping on phytoplankton identification;
Dr. Alexandra Marques, for helping on zooplankton identification;
Dr. Carlos Afonso, for helping on benthic macroinvertebrate identification;
Paulo Santana, who facilitated logistics on the geology laboratory;
Miguel Madureira, who was always available to solve problems with laboratory equipment and materials.
I am grateful to all my friends and colleagues, who shared their time with me during the field work (Dinamene Sousa, Sónia Ólim, Monica Pescaru, Raluca, José António); the laboratory work (Camané, Cecile Godinho, Raquel Machás, Aschwin Engelen, François Hubert) and solving my computer and software problems (António Encarnação).
A special thanks to all those friends that, although “faraway”, gave me strength and support me, even if it was just in a long phone call (Verita – Lisboa; Racas – Ireland & Portugal; Jorge Safara, Marco Mirinha, Carla Janeiro, Sandra Bernardo – Évora; Sonucha –Bias do Sul, Ana Quaresma & Miguel Correia – Olhão; Rui Graça – Faro; Pedro Andrade & Ana Sara – Sevilha & Cerro do Guelhim).
ABSTRACT
The present study intended to compare environmental conditions and biotic communities of two choked coastal lagoons located in the Algarve region, Foz de Almargem and Salgados, with the purpose of evaluating the effects of organic pollution from wastewater discharges in water quality and biotic communities from different levels of the food chain, namely phytoplankton and benthic macroinvertebrates.
Both lagoons were seasonally connected to the sea, but most of the year they were isolated receiving the freshwater input from small rivers and wastewater (in Salgados). Data were collected from June 2001 to July 2002 in three sampling stations, according to a gradient of proximity with the sea.
Characterization of environmental conditions was performed based on the study of hydrological parameters, physical and chemical water parameters, and sediment parameters.
Phytoplankton communities were analyzed in terms of phytopigments concentrations;
taxa composition, richness, abundance, diversity and salinity tolerance. Relations
between phytoplankton and water parameters were analyzed through bivariate and multivariate statistical techniques. Results indicated that the two lagoons presented different phytoplankton communities, which were associated to water parameters and particularly with organic pollution in the case of Salgados lagoon.
Taxonomic composition, richness, abundance and diversity of benthic macroinvertebrate communities were also characterized, just as ecological features concerning the salinity tolerance of taxa, trophic groups and sensitivity to an increasing stress gradient. Relations between benthic macroinvertebrate parameters, water and sediment parameters were analyzed with the same techniques used with phytoplankton. Results also revealed distinct benthic macroinvertebrate communities in Foz de Almargem and Salgados lagoon, which were related with the environmental parameters that indicated a greater organic pollution in Salgados lagoon.
Water quality and trophic state were evaluated using different indices and approaches that classified Salgados lagoon as a hypereutrophic system with bad water quality. Most indices pointed out to mesotrophic conditions in Foz de Almargem, although they were not always concordant.
Keywords: coastal lagoons, water quality, trophic state, phytoplankton communities, benthic macroinvertebrate communities
RESUMO
O presente estudo teve como principal objectivo a comparação das condições ambientais e das comunidades bióticas em duas lagoas costeiras, Foz de Almargem e Salgados, localizadas na região do Algarve. Pretenderam-se avaliar os efeitos da poluição orgânica, derivada da descarga de efluentes de estações de tratamento de águas residuais (ETAR), na qualidade da água e nas comunidades de organismos pertencentes a diferentes níveis da cadeia trófica, nomeadamente no fitoplâncton e nos macroinvertebrados bentónicos.
A selecção destas lagoas como áreas de estudo teve que ver com o facto de serem as únicas lagoas da região com a mesma tipologia hidrológica e de uma das lagoas receber os efluentes de uma ETAR (lagoa dos Salgados), enquanto que na lagoa da Foz de Almargem, aparentemente não existiam fontes directas de poluição orgânica. Este tipo de lagoas permanece isolado durante a maior parte do ano, ficando temporariamente abertas ao mar aquando do rompimento natural ou artificial do cordão dunar, que acontece durante os períodos de maior pluviosidade e consequente aumento do nível de água nas lagoas, conjugado com as condições marítimas. Geralmente, os períodos de ligação das lagoas ao mar são de curta duração, devido à rápida recuperação do cordão dunar.
O estudo decorreu entre Junho de 2001 e Julho de 2002, tendo-se efectuado recolha de amostras e medições in situ dos diversos parâmetros em três locais seleccionados ao longo de um gradiente de proximidade com o mar. As amostragens foram realizadas com uma frequência aproximada de mês e meio.
Em termos hidrológicos, analisou-se a variação do nível de água nas lagoas em função da precipitação e da ligação das lagoas ao mar através das aberturas naturais ou artificiais da barra arenosa.
A caracterização da qualidade da água foi feita com base em parâmetros físico-químicos, tendo-se considerado igualmente as concentrações de clorofila a, por ser um dos indicadores utilizados na definição do estado trófico e da qualidade dos ecossistemas lagunares.
O sedimento foi caracterizado em termos de granulometria, conteúdo de matéria orgânica e concentração de fitopigmentos.
As comunidades fitoplanctónicas e as comunidades de organismos macroinvertebrados bentónicos foram estudadas em termos de composição taxonómica, abundância, riqueza, diversidade e tolerância à salinidade. No caso dos organismos bentónicos abordaram-se ainda alguns aspectos da ecologia das espécies, nomeadamente o regime trófico e a sua sensibilidade no que diz respeito a um gradiente de stress ambiental.
As relações entre os parâmetros ambientais e as comunidades bióticas foram avaliadas através de técnicas de análise bivariada e multivariada.
Na lagoa dos Salgados observaram-se maiores concentrações de fosfatos, fósforo total, nitritos, amónia, azoto inorgânico total, sólidos suspensos totais, clorofila a e feopigmentos. A salinidade, a concentração de nitratos e a diversidade pigmentar foram superiores na lagoa da Foz de Almargem.
As comunidades fitoplanctónicas diferiram consideravelmente nas duas lagoas. Na lagoa dos Salgados observaram-se maiores concentrações de fitopigmentos, uma maior abundância fitoplanctónica e a dominância de Cyanophyceae, em alternância com Bacillariophyceae e algas pico-nano flageladas. Na lagoa da Foz de Almargem dominaram as Dinophyceae, Bacillariophyceae e algas pico-nano flageladas. Em termos de tolerância à salinidade, a comunidade da lagoa dos Salgados apresentou maioritariamente taxa de ambientes dulciaquícolas e salobros, enquanto a lagoa da Foz de Almargem registou maiores abundâncias de taxa que ocorrem em ambientes salobros e marinhos.
As principais diferenças nas comunidades fitoplanctónicas das lagoas estão relacionadas com os parâmetros físico-químicos das lagoas. As abundâncias de Dinophyceae e Bacillariophyceae apresentaram uma relação positiva com a razão N:P e a concentração de nitratos, estando negativamente associadas à concentração de ortofosfatos. As Cyanophyceae e as Chlorophyceae apresentaram relações inversas com estes parâmetros. As maiores abundâncias de pico-nano flagelados estiveram associadas a menores valores de temperatura e maiores concentrações de nitritos.
Em ambas as lagoas foram identificados taxa potencialmente tóxicos, cuja abundância se correlacionou significativamente com as concentrações de compostos azotados e compostos fosfatados. A ocorrência destes taxa e o desenvolvimento de florescências é particularmente preocupante na lagoa dos Salgados, quer em termos de saúde pública quer em termos de impacte na fauna piscícola e avifauna locais.
Relativamente às comunidades de organismos macroinvertebrados bentónicos foram igualmente encontradas diferenças nas duas lagoas, ao nível da composição taxonómica, densidades e tolerância à salinidade. Na lagoa dos Salgados, os grupos mais representativos em termos de densidades foram os Insecta e os Crustacea, sendo a comunidade constituída principalmente por organismos de ambientes salobros e de influência continental. Na lagoa da Foz de Almargem foram determinadas maiores densidades de Gastropoda, Bivalvia e Polychaeta, tendo grande parte dos organismos afinidades eurialinas marinhas. Em termos tróficos, ambas as lagoas apresentaram comunidades maioritariamente compostas por organismos detritívoros, apesar da diversidade de grupos tróficos na lagoa da Foz de Almargem ter sido superior. Relativamente à sensibilidade dos taxa bentónicos, nas duas lagoas predominaram organismos tolerantes à poluição orgânica; porém na lagoa dos Salgados, durante os meses de Primavera e de Verão de 2002, observou-se um incremento notável na densidade de organismos oportunistas, indicadores de desequilíbrios ambientais e excesso de matéria orgânica.
As principais diferenças observadas nas comunidades bentónicas das lagoas estão relacionadas quer com parâmetros da água quer com parâmetros do sedimento. As densidades de Gastropoda, Bivalvia e Polychaeta apresentaram uma associação negativa com as concentrações de fósforo total e clorofila a na água, assim como com o conteúdo de argilas e a concentração de clorofila a no sedimento. Os Insecta, Oligochaeta e Amphipoda apresentaram associações positivas com estes mesmos parâmetros e com a concentração total de azoto dissolvido na água. Em ambas as lagoas foram observadas variações sazonais que estiveram associadas à temperatura da água.
Com base nos parâmetros estudados e na determinação de índices de qualidade da água e estado trófico, a lagoa da Foz de Almargem foi considerada mesotrófica, tendo como principal fonte de nutrientes de origem antropogénica a escorrência agrícola e eventualmente a contaminação difusa proveniente do lençol freático. A lagoa dos Salgados foi classificada como hipereutrófica, tendo o enriquecimento de nutrientes estado associado às descargas de efluentes da ETAR, às escorrências agrícola e de um campo de golfe.
Palavras-chave: lagoas costeiras, qualidade da água, estado trófico, comunidades fitoplanctónicas, comunidades de macroinvertebrados bentónicos
LIST OF CONTENTS
Acknowledgements/ Agradecimentos v
Abstract vii
Resumo ix
List of Figures xvi
List of Tables xx
List of Appendices xxii
1. INTRODUCTION, GENERAL AIMS AND STUDY AREAS 1
1.1. Introduction 1
1.2. General Aims 5
1.3. Study Areas 6
2. ENVIRONMENTAL CONDITIONS:
HYDROLOGY, WATER, SEDIMENT AND TROPHIC STATE
11
2.1. Specific Aims 11
2.2. Material and Methods 11
2.2.1. Hydrological aspects 11
2.2.2. Water parameters 12
2.2.2.1. Field procedures and laboratory analyses 12
2.2.2.2. Data analysis 13
2.2.3. Sediment parameters 13
2.2.3.1. Field procedures and laboratory analyses 13
2.2.3.2. Data analysis 15
2.2.4. Trophic state and water quality 15
2.3. Results and discussion 17
2.3.1. Foz de Almargem coastal lagoon 17
2.3.1.1. Hydrological aspects 17
2.3.1.2. Water parameters 18
2.3.1.3. Sediment parameters 26
2.3.1.4. Relations between environmental parameters 32 2.3.1.5. Comparison of environmental parameters during isolation
and connection of the lagoon with the sea
35
2.3.1.6. Trophic state and water quality 38
2.3.2. Salgados coastal lagoon 43
2.3.2.1. Hydrological aspects 43
2.3.2.2. Water parameters 44
2.3.2.3. Sediment parameters 52
2.3.2.4. Relations between environmental parameters 57 2.3.2.5. Comparison of environmental parameters during isolation
and connection of the lagoon with the sea
2.3.2.6. Trophic state and water quality 63
2.3.3. Comparison of the two coastal lagoons 68
2.3.3.1. Hydrological aspects 68
2.3.3.2. Water parameters 69
2.3.3.3. Sediment parameters 76
2.3.3.4. Relations between environmental parameters 80 2.3.3.5. Comparison of environmental parameters during isolation
and connection of the lagoon with the sea
83
2.3.3.6. Trophic state and water quality 84
3. PHYTOPLANKTON COMMUNITIES 89
3.1. Specific Aims 89
3.2. Material and methods 89
3.2.1. Field procedures and laboratory analyses 89
3.2.2. Data analysis 90
3.3. Results and discussion 91
3.3.1. Foz de Almargem coastal lagoon 91
3.3.1.1. Phytoplankton communities 91
3.3.1.2. Environmental parameters and phytoplankton communities 100 3.3.1.3. Phytoplankton communities during isolation and connection
of the lagoon with the sea
102
3.3.2. Salgados coastal lagoon 104
3.3.2.1. Phytoplankton communities 104
3.3.2.2. Environmental parameters and phytoplankton communities 117 3.3.2.3. Phytoplankton communities during isolation and connection
of the lagoon with the sea
120
3.3.3. Comparison of the two coastal lagoons 121
3.3.3.1. Phytoplankton communities 121
3.3.3.2. Environmental parameters and phytoplankton communities 127 3.3.3.3. Comparison of phytoplankton communities during isolation
and connection of the lagoons with the sea
132 3.3.3.4. Phytoplankton communities according to salinity preferences 134
3.3.3.5. Potentially harmful phytoplankton 139
3.3.3.6. Phytoplankton communities and water quality 144
4. BENTHIC MACROINVERTEBRATE COMMUNITIES 146
4.1. Specific Aims 146
4.2. Material and Methods 146
4.2.1. Field sampling and laboratory procedures 146
4.2.2. Data analysis 147
4.3. Results and discussion 150
4.3.1.1. Benthic macroinvertebrate communities 150 4.3.1.2. Environmental parameters and benthic macroinvertebrate
communities
163 4.3.1.3. Comparison of benthic macroinvertebrate communities
during isolation and connection of the lagoon with the sea
167
4.3.2. Salgados coastal lagoon 170
4.3.2.1. Benthic macroinvertebrate communities 170 4.3.2.2. Environmental parameters and benthic macroinvertebrate
communities
180 4.3.2.3. Comparison of benthic macroinvertebrate communities
during isolation and connection of the lagoon with the sea
183
4.3.3. Comparison of the two coastal lagoons 185
4.3.3.1. Benthic macroinvertebrate communities 185 4.3.3.2. Environmental parameters and benthic macroinvertebrate
communities
193 4.3.3.3. Comparison of benthic communities during isolation and
connection of the lagoons with the sea
197 4.3.3.4. Benthic macroinvertebrate community’s preference/tolerance
to salinity
199
5. GENERAL DISCUSSION AND CONCLUSIONS 202
5.1. Hidrological aspects 202
5.2. Water parameters 203
5.3. Phytoplankton 206
5.3.1. Chlorophyll a concentration 206
5.3.2. Phytoplankton communities 206
5.3.3. Potentially harmful phytoplankton 208
5.3.4. Phytoplankton salinity tolerance 210
5.4. Sediment parameters 211
5.5. Benthic macroinvertebrates 213
5.5.1. Communities structure 213
5.5.2. Benthic trophic groups 216
5.5.3. Benthic ecological groups 217
5.5.4. Benthic macroinvertebrate salinity tolerance 217
5.6. Lagoons inlets open versus closed 218
5.7. Trophic state and ecological quality 220
6. REFERENCES 226
LIST OF FIGURES
1. INTRODUCTION, GENERAL AIMS AND STUDY AREAS
Figure 1.1 – Location of Foz de Almargem and Salgados lagoons in the south coast of Algarve. 6 Figure 1.2 – Foz de Almargem coastal lagoon with high (left side) and low (right side) water level. 7 Figure 1.3 – Salgados coastal lagoon with high (left side) and low (right side) water level. 8 Figure 1.4 – Typology of transitional waters and sheltered coastal water. 10 2. ENVIRONMENTAL CONDITIONS: HYDROLOGY, WATER, SEDIMENT AND TROPHIC STATE
Figure 2.1 - Variation of daily rainfall registered in Loulé meteorological station and Foz de Almargem coastal lagoon openings to the sea.
17
Figure 2.2 - Seasonal variation of physical and chemical water parameters (salinity, temperature, pH, total solids in suspension, dissolved oxygen and oxygen saturation) in Foz de Almargem sampling stations.
19
Figure 2.3 - Daily variation of physical and chemical water parameters (temperature, salinity, pH, dissolved oxygen and oxygen saturation) during spring (May 2002) in the upstream and downstream sampling stations from Foz de Almargem coastal lagoon.
20
Figure 2.4 - Seasonal variation of nitrogen compounds (nitrates, nitrites and ammonia), total dissolved nitrogen (DIN), orthophosphates, total phosphorus concentration and N: P ratio (DIN: orthophosphate) in Foz de Almargem sampling stations.
22
Figure 2.5 - Seasonal variation of photosynthetic pigments concentration (chlorophyll a and phaeo-pigments) and Margalef`s pigment diversity index in Foz de Almargem sampling stations.
23
Figure 2.6 - Principal Component Analysis performed on the hydrological and water parameters
from Foz de Almargem sampling stations. 25
Figure 2.7 - Ternary diagram for textural classification of sediments from Foz de Almargem coastal lagoon, based on sand, silt and clay ratios.
26
Figure 2.8 - Seasonal variation of individual grain size fractions in the tree sampling stations from Foz de Almargem coastal lagoon.
27
Figure 2.9 -Seasonal variation of water content, organic matter content, photosynthetic pigments concentration (chlorophyll a and phaeo-pigments), chlorophyll a degradation index (% phaeo-pigments) and Margalef`s pigment diversity index in the sediment of the tree sampling stations from Foz de Almargem coastal lagoon.
29
Figure 2.10 - Principal component analysis performed on sediment parameters from Foz de
Almargem coastal lagoon. 31
Figure 2.11 - Principal component analysis performed on water and sediment parameters from Foz de Almargem coastal lagoon.
33
Figure 2.12 - Seasonal variation of chlorophyll a in the sediment, chlorophyll a in the water and percentage of each relative to total chlorophyll a in Foz de Almargem sampling stations.
35
Figure 2.13 – Seasonal variation of trophic state and water quality indexes in Foz de Almargem coastal lagoon: TSI with chlorophyll (CHL), TSI with total phosphorus concentrations (TP) and TRIX.
39
Figure 2.14 – Linear regression between chlorophyll a concentration (µg L-1) and the concentrations of nitrites (µM) and nitrates (µM), during the period Foz de Almargem lagoon was closed.
43
Figure 2.15 - Variation of daily rainfall registered in Algoz meteorological station and daily water level measured in the deepest part of Salgados coastal lagoon.
44
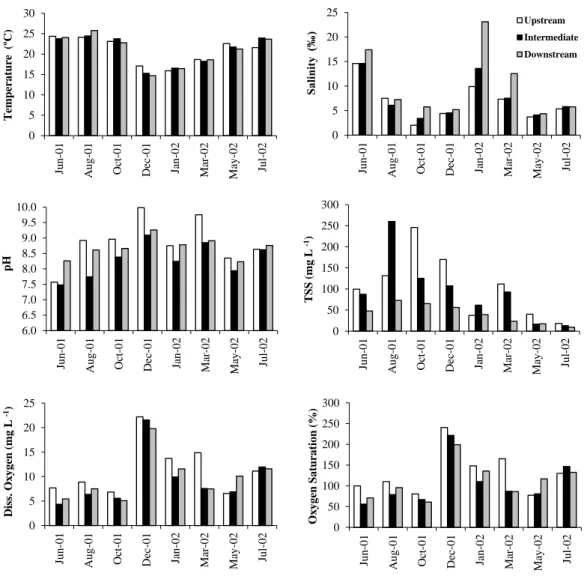
Figure 2.16 - Seasonal variation of physical and chemical water parameters (salinity, temperature, pH, total solids in suspension, dissolved oxygen and oxygen saturation) in Salgados sampling stations.
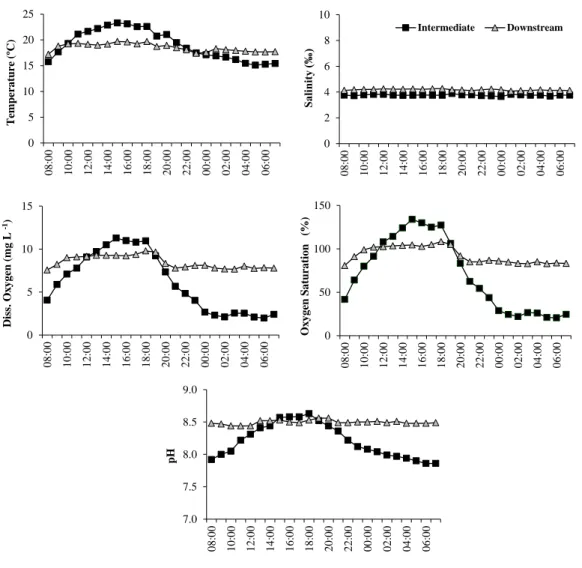
Figure 2.17 - Daily variation of physical and chemical water parameters (temperature, salinity, pH, dissolved oxygen and oxygen saturation) during spring (May 2002) in the intermediate and downstream sampling stations from Salgados coastal lagoon.
47
Figure 2.18 - Seasonal variation of nitrogen compounds (nitrates, nitrites and ammonia), total dissolved nitrogen (DIN), orthophosphates, total phosphorus concentration, N: P ratio (DIN: orthophosphates) and total solids in suspension (TSS) in Salgados sampling stations.
49
Figure 2.19 - Seasonal variation of photosynthetic pigments concentration (chlorophyll a and phaeo-pigments) and Margalef’s pigment diversity index in Salgados sampling stations.
50
Figure 2.20 - Principal Component Analysis performed on the hydrological and water parameters from Salgados sampling stations.
52
Figure 2.21 - Ternary diagram for textural classification of sediments from Salgados coastal lagoon, based on sand, silt and clay ratios.
53
Figure 2.22 - Seasonal variation of individual grain size fractions in the two sampling stations from Salgados coastal lagoon.
53
Figure 2.23 - Seasonal variation of water content, organic matter content, photosynthetic pigments concentration (chlorophyll a and phaeo-pigments), chlorophyll a degradation index (% phaeo-pigments) and Margalef`s pigment diversity index in the sediment of the two sampling stations from Salgados lagoon.
55
Figure 2.24 - Principal component analysis performed on sediment parameters from Salgados
lagoon. 56
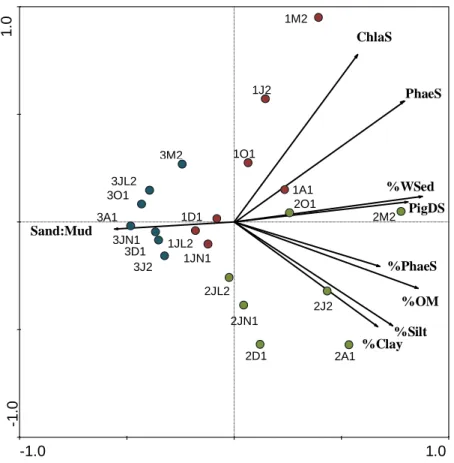
Figure 2.25 - Principal component analysis performed on environmental parameters from Salgados
coastal lagoon. 59
Figure 2.26 - Seasonal variation of chlorophyll a in the sediment, chlorophyll a in the water and
percentage of each relative to total chlorophyll a in Salgados sampling stations. 61 Figure 2.27 – Seasonal variation of trophic state and water quality indexes in Salgados coastal
lagoon: TSI with chlorophyll (CHL), TSI with total phosphorus concentrations (TP) and TRIX.
65
Figure 2.28 - Variation of monthly rainfall registered in Foz de Almargem (Loulé meteorological station) and Salgados (Algoz meteorological station) and duration of the connection between the lagoons and the sea (number of days per month).
68
Figure 2.29 - Seasonal variation of physical and chemical water parameters mean values (salinity, temperature, pH, total solids in suspension, dissolved oxygen and oxygen saturation) in Foz de Almargem and Salgados coastal lagoons.
70
Figure 2.30 - Seasonal variation of nitrogen compounds (nitrates, nitrites and ammonia), total dissolved nitrogen (DIN), orthophosphates, total phosphorus concentration and N: P ratio (DIN: orthophosphate) mean values in Foz de Almargem and Salgados coastal lagoons.
72
Figure 2.31 - Seasonal variation of photosynthetic pigments mean concentrations (chlorophyll a and phaeo-pigments) and Margalef’s pigment diversity index in Foz de Almargem and Salgados coastal lagoons.
73
Figure 2.32 - Principal Component Analysis performed on the hydrological and water parameters mean values from Foz de Almargem and Salgados coastal lagoons.
75
Figure 2.33 - Seasonal variation of mean sand, silt and clay contents in Foz de Almargem and Salgados coastal lagoons.
76
Figure 2.34 - Seasonal variation of mean values for water content, organic matter content,
photosynthetic pigments concentration (chlorophyll a and phaeo-pigments), chlorophyll
a degradation index (% phaeo-pigments) and Margalef`s pigment diversity index in Foz
de Almargem and Salgados coastal lagoons.
78
Figure 2.35 - Principal Component Analysis performed on the sediment parameters mean values
from Foz de Almargem and Salgados coastal lagoons. 79
Figure 2.36 - Principal Component Analysis performed on the environmental parameters mean values from Foz de Almargem and Salgados coastal lagoons.
Figure 2.37 - Seasonal variation of chlorophyll a in the sediment, chlorophyll a in the water and percentage of each relative to total chlorophyll a in Foz de Almargem and Salgados lagoons.
82
Figure 2.38 – Seasonal variation of trophic state and water quality indexes (means) in Foz de Almargem and Salgados coastal lagoons: TSI with chlorophyll (CHL), TSI with total phosphorus concentrations (TP) and TRIX.
85
3. PHYTOPLANKTON COMMUNITIES
Figure 3.1 - Evolution of phytoplankton richness, total phytoplankton abundance, Shannon-Wiener diversity (H `) and evenness (E) in Foz de Almargem sampling stations.
93 Figure 3.2 - Evolution of phytoplankton abundance per class and relative frequency of each class
in Foz de Almargem sampling stations.
94 Figure 3.3 - Seasonal variation of Dinophyceae taxa abundance in Foz de Almargem sampling
stations.
96 Figure 3.4 - Evolution of Bacillariophyceae taxa abundance in Foz de Almargem sampling
stations.
97 Figure 3.5 - Evolution of Chlorophyceae (Cosmarinum sp.; Staurastrum sp.), Cryptophyceae
(Cryptomonas sp.; Rhodomonas sp.), Euglenophyceae (Eutreptiella sp.) and Cyanophyceae (Anabaena flos-aqua) taxa abundances in Foz de Almargem sampling stations.
98
Figure 3.6 - Canonical correspondence analysis performed with thephytoplankton groups (total density per station)from Foz de Almargem sampling stations.
102 Figure 3.7 - Evolution of phytoplankton richness, total phytoplankton abundance, Shannon-Wiener
diversity (H `) and evenness (E) in Salgados sampling stations.
106 Figure 3.8 - Evolution of phytoplankton abundance per class and relative frequency of each class
in Salgados sampling stations.
107 Figure 3.9 - Evolution of Cyanophyceae taxa abundance in Salgados sampling stations. 109 Figure 3.10 - Evolution of Bacillariophyceae taxa abundance in Salgados sampling stations. 110 Figure 3.11 - Evolution of Chlorophyceae taxa abundance in Salgados sampling stations. 112 Figure 3.12 - Evolution of Euglenophyceae taxa abundance in Salgados sampling stations. 113 Figure 3.13 - Evolution of Cryptophyceae and Dinophyceae taxa abundances in Salgados sampling
stations.
115 Figure 3.14 - Canonical correspondence analysis performed with thephytoplankton groups(total
density per station)from Salgados sampling stations.
119 Figure 3.15 - Evolution of phytoplankton richness, total phytoplankton abundance,
Shannon-Wiener diversity (H `) and evenness (E) monthly mean values in Foz de Almargem and Salgados lagoons.
123
Figure 3.16 - Evolution of phytoplankton mean abundance per class and relative frequency of each class in Foz de Almargem and Salgados lagoons.
124 Figure 3.17 - Monthly mean abundances of phytoplankton taxa that occurred in both lagoons. 127 Figure 3.18 - Canonical correspondence analysis performed with the phytoplankton groups (mean
density) from Foz de Almargem and Salgados lagoon.
130 Figure 3.19 – Evolution of taxonomic richness and phytoplankton abundance according to taxa
salinity preferences in Foz de Almargem and Salgados lagoons.
138 Figure 3.20 - Monthly mean abundances of potentially harmful taxa in Foz de Almargem and
Salgados lagoons.
141 Figure 3.21 - Monthly mean abundances of potentially harmful taxa in Foz de Almargem and
Salgados lagoons, according to taxa occurrence in terms of habitats.
4. BENTHIC MACROINVERTEBRATE COMMUNITIES
Figure 4.1 - Evolution of total benthos density, taxa richness, Shannon-Wiener diversity (H `) and evenness (E) in Foz de Almargem sampling stations.
152 Figure 4.2 - Seasonal variation of the main taxonomic benthos groups densities and relative
frequency of each group in Foz de Almargem sampling stations.
153 Figure 4.3 - Seasonal variation of Polychaeta taxa densities in Foz de Almargem sampling
stations.
157 Figure 4.4 - Seasonal variation of Mollusca taxa densities (Gastropoda Ventrosia ventrosa and
Hydrobia ulvae; Bivalvia Abra segmentum and Cerastoderma glaucum) in Foz de
Almargem sampling stations.
157
Figure 4.5 – Relative frequency of taxa in terms of constancy and fidelity in Foz de Almargem sampling stations.
158 Figure 4.6 - Seasonal variation of trophic groups densities and relative frequency of each group in
Foz de Almargem sampling stations.
162 Figure 4.7 - Seasonal variation of ecological AMBI groups densities and relative frequency of
each group in Foz de Almargem sampling stations. 163
Figure 4.8 - Canonical correspondence analysis performed with the benthic macroinvertebrate
taxa (total density per station) from Foz de Almargem lagoon.
167 Figure 4.9 - Evolution of total benthos density, taxa richness, Shannon-Wiener diversity (H `) and
evenness (E) in Salgados sampling stations.
171 Figure 4.10 - Seasonal variation of the main taxonomic benthos groups densities and relative
frequency of each group in Salgados sampling stations.
172 Figure 4.11 - Seasonal variation of Insecta taxa densities in Salgados sampling stations. 174 Figure 4.12 - Seasonal variation of Oligochaeta taxa densities in Salgados sampling stations. 175 Figure 4.13 - Seasonal variation of Crustacea taxa densities in Salgados sampling stations. 175 Figure 4.14 – Relative frequency of taxa in terms of constancy and fidelity in Salgados sampling
stations.
176 Figure 4.15 - Seasonal variation of trophic groups densities and relative frequency of each group
in Salgados sampling stations.
178 Figure 4.16 - Seasonal variation of ecological AMBI groups densities and relative frequency of
each group in Salgados sampling stations
179 Figure 4.17- Canonical correspondence analysis performed with the benthic macroinvertebrate
taxa (total density per station) from Salgados lagoon.
182 Figure 4.18 - Evolution of benthic macro invertebrate richness, total density, Shannon-Wiener
diversity (H `) and evenness (E) monthly mean values in Foz de Almargem and Salgados lagoons.
186
Figure 4.19 - Seasonal variation of the main taxonomic benthic groups’ densities and relative frequency of each group in Foz de Almargem and Salgados lagoons.
188 Figure 4.20 - Monthly mean abundances of benthic macroinvertebrate taxa that occurred in both
lagoons.
188 Figure 4.21 - Seasonal variation of trophic groups densities and relative frequency of each group
in Foz de Almargem and Salgados lagoons.
192 Figure 4.22 - Seasonal variation of ecological AMBI groups densities and relative frequency of
each group in Foz de Almargem and Salgados lagoons.
193 Figure 4.23- Canonical correspondence analysis performed with the benthic macroinvertebrate
groups (mean density) from Foz de Almargem and Salgados lagoon
196 Figure 4.24 – Evolution of taxonomic richness and density of benthic macroinvertebrate taxa
according to salinity preferences in Foz de Almargem and Salgados lagoons.
LIST OF TABLES
1. INTRODUCTION, GENERAL AIMS AND STUDY AREAS
Table 1.1 – Resume of the general characteristics of Foz de Almargem and Salgados lagoons. 10 2. ENVIRONMENTAL CONDITIONS: HYDROLOGY, WATER, SEDIMENT AND TROPHIC STATE
Table 2.1- Water level in the lagoon and periods of isolation, semi-isolation and connection between Foz de Almargem coastal lagoon and the sea.
18 Table 2.2 – Minimum, maximum and mean values of physical and chemical water parameters
(temperature, salinity, pH, dissolved oxygen and oxygen saturation) monitored during a 24 hours cycle in spring (May 2002) at the upstream and downstream sampling stations from Foz de Almargem lagoon.
21
Table 2.3 – Annual mean values and standard deviation of water parameters in Foz de Almargem sampling stations.
24 Table 2.4 – Annual mean values and standard deviation of sediment parameters in Foz de Almargem
sampling stations.
30 Table 2.5 - Significant correlations between water and sediment parameters from Foz de Almargem
coastal lagoon.
32 Table 2.6 – Water and sediment parameters in January 2002 and variation between values when the
lagoon was closed (December 2001) and opened to the sea (January 2002) in Foz de Almargem sampling stations.
37
Table 2.7 – Trophic state and water quality indexes mean values, standard deviation and classification in Foz de Almargem sampling stations, determined during all studied period (June 2001-July 2002) and when the lagoon was closed (June-December 2001; March-July 2002).
40
Table 2.8 – Water quality in Foz de Almargem sampling stations, based on the 90th percentile of chlorophyll a (µg L-1), adapted from Brito et al. (2012) and Pereira Coutinho et al. (2012).
42
Table 2.9 - Periods of connection with the sea and water level in Salgados coastal lagoon. 44 Table 2.10 – Minimum, maximum and mean values of physical and chemical water parameters
(temperature, salinity, pH, dissolved oxygen and oxygen saturation) monitored during a 24 hours cycle in spring (May 2002) at the intermediate and downstream sampling stations from Salgados lagoon.
47
Table 2.11– Annual mean values and standard deviation of water parameters in Salgados sampling stations.
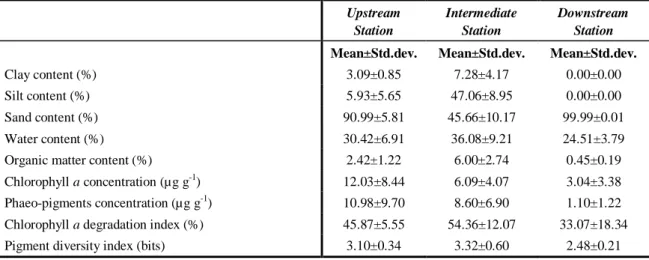
50 Table 2.12 – Annual mean values and standard deviation of sediment parameters in Salgados
sampling stations.
55 Table 2.13 - Significant correlations between water and sediment parameters from Salgados lagoon. 58 Table 2.14 – Water and sediment parameters in January 2002 and variation between values when the
lagoon was isolated (December 2001) and connected to the sea (January 2002) in Salgados sampling stations.
62
Table 2.15 – Trophic state and water quality indexes mean values, standard deviation and
classification in Salgados sampling stations, determined during all studied period (June 2001-July 2002) and when the lagoon was closed (June-December 2001; March-July 2002).
65
Table 2.16 – Water quality in Salgados sampling stations, based on the 90th percentile of chlorophyll
a (µg L-1), adapted from Brito et al. (2012) and Pereira Coutinho et al. (2012).
67 Table 2.17– Annual mean values and standard deviation of water parameters in Foz de Almargem
and Salgados coastal lagoons.
74 Table 2.18 – Annual mean values and standard deviation of sediment parameters in Foz de 77
Almargem and Salgados coastal lagoons.
Table 2.19 – Water and sediment parameters in January 2002 and variation between mean values when the lagoons were isolated (December 2001) and connected to the sea (January 2002).
83
Table 2.20 – Trophic state and water quality indexes mean values, standard deviation and
classification in Foz de Almargem and Salgados lagoons, determined during all studied period (June 2001-July 2002) and when the lagoon was closed (June-December 2001; March-July 2002).
86
Table 2.21 – Water quality in Foz de Almargem and Salgados lagoons, based on the 90th percentile of chlorophyll a (µg L-1), adapted from Brito et al. (2012) and Pereira Coutinho et al. (2012).
88
3. PHYTOPLANKTON COMMUNITIES
Table 3.1 – Annual mean annual and standard deviation of phytoplankton parameters in Foz de Almargem sampling stations.
99 Table 3.2 - Significant correlations between phytoplankton and environmental parameters in Foz de
Almargem lagoon.
101 Table 3.3 – Phytoplankton communities in January 2002 and variation between values when the
lagoon wasisolated (December 2001) and connected to the sea (January 2002) in Foz de Almargem sampling stations.
103
Table 3.4 – Annual mean values and standard deviation of phytoplankton parameters in Salgados sampling stations.
116 Table 3.5 - Significant correlations between phytoplankton and environmental parameters in
Salgados lagoon.
118 Table 3.6 – Phytoplankton communities in January 2002 and variation between values when the
lagoon wasisolated (December 2001) and connected to the sea (January 2002) in Salgados sampling stations.
121
Table 3.7 – Annual mean values and standard deviation of phytoplankton parameters in Foz de Almargem and Salgados lagoons.
128 Table 3.8- Resume of the significant correlations between phytoplankton communities and
environmental parameters in Foz de Almargem and Salgados lagoons.
129 Table 3.9 - Significant correlations between environmental parameters and the abundances of
phytoplankton taxa that occurred in both lagoons.
131 Table 3.10 – Phytoplankton parameters in January 2002 and variation between mean values when
the lagoons wereisolated (December 2001) and connected to the sea (January 2002).
133 Table 3.11 - Significant correlations between environmental parameters and potentially harmful
taxa from Foz de Almargem and Salgados lagoons.
143
4. BENTHIC MACROINVERTEBRATE COMMUNITIES
Table 4.1 – Annual mean values and standard deviation of benthic macroinvertebrate parameters in Foz de Almargem sampling stations.
159 Table 4.2 - Significant correlations between benthic macroinvertebrate and environmental
parameters (water and sediment) from Foz de Almargem lagoon.
165 Table 4.3 – Benthic macroinvertebrate communities in January 2002 and variation between values
when the lagoon was isolated (December 2001) and connected to the sea (January 2002) in Foz de Almargem sampling stations.
169
Table 4.4 – Annual mean values and standard deviation of benthic macro invertebrate parameters in Salgados sampling stations.
177 Table 4.6 – Benthic macroinvertebrate communities in January 2002 and variation between values
when the lagoon was isolated (December 2001) and connected to the sea (January 2002) in Salgados sampling stations.
Table 4.7 – Annual mean values and standard deviation of benthic macro invertebrate parameters in Foz de Almargem and Salgados lagoons.
190 Table 4.8 - Resume of the significant correlations between benthic macroinvertebrate communities
and environmental parameters in Foz de Almargem and Salgados lagoons.
194 Table 4.9 – Benthic macroinvertebrate communities in January 2002 and variation between mean
values when the lagoons were isolated (December 2001) and connected to the sea (January 2002).
198
Table 4.10 - Classification of benthic macroinvertebrate taxa based on the salinity preference/tolerance in Foz de Almargem and Salgados lagoons.
199
5. GENERAL DISCUSSION AND CONCLUSIONS
Table 5.1 – Trophic state and water quality in Foz de Almargem and Salgados lagoons, based on different authors and approaches
222
LIST OF APPENDICES
Appendix I.A - Results of One-Way ANOVA, Kruskal-Wallis test and multiple comparisons LSD Fisher test among sites for water parameters (Ln (x+1)) in Foz de Almargem coastal lagoon.
235
Appendix I.B - Results of One-Way ANOVA, Kruskal-Wallis test and multiple comparisons LSD Fisher test among sites for sediment parameters (Ln x+1) in Foz de Almargem coastal lagoon.
236
Appendix I.C - Results of One-Way ANOVA, Kruskal-Wallis test and multiple comparisons LSD Fisher test among sites for water parameters (Ln (x+1)) in Salgados coastal lagoon.
237 Appendix I.D - Results of Mann-Whitney U test and Student T test for sediment parameters
(Ln (x+1)) comparison between sites from Salgados lagoon.
238 Appendix I.E - Results from Mann-Whitney U test and Student T test for water parameters
(Ln (x+1)) comparison between lagoons.
239 Appendix I.F - Results of Mann-Whitney U test and Student T test for sediment parameters
(Ln (x+1)) comparison between lagoons.
240 Appendix I.G - Results of One-Way ANOVA and Kruskal-Wallis test among sites for
phytoplankton parameters (Ln (x+1)) in Foz de Almargem coastal lagoon.
240 Appendix I.H - Results of One-Way ANOVA and Kruskal-Wallis test among sites for
phytoplankton parameters (Ln (x+1)) in Salgados coastal lagoon.
240 Appendix I.I - Results of Mann-Whitney U test and Student T test for phytoplankton parameters
(Ln (x+1)) comparison between lagoons.
241 Appendix I.K - Results of One-Way ANOVA and Kruskal-Wallis and multiple comparisons LSD
Fisher test among sites for benthic macroinvertebrate parameters (Ln (x+1)) in Foz de Almargem coastal lagoon.
242
Appendix I.K - Results of Mann-Whitney U test and Student T test for benthic macroinvertebrate parameters (Ln (x+1)) in Salgados coastal lagoon.
243 Appendix I.L - Results of Mann-Whitney U test and Student T test for benthic macro invertebrate
parameters (Ln (x+1)) comparison between lagoons.
243 Appendix II.A – List of phytoplankton taxa identified in Foz de Almargem coastal lagoon. 244 Appendix II.B – List of phytoplankton taxa identified in Salgados coastal lagoon. 245 Appendix II.C – List of benthic macroinvertebrate taxa identified in Foz de Almargem coastal
lagoon.
246 Appendix II.D – List of benthic macroinvertebrate taxa identified in Salgados coastal lagoon. 246
1. INTRODUCTION, GENERAL AIMS AND STUDY AREAS
1.1. Introduction
Coastal lagoons were defined by Kjerfve (1994) as shallow coastal water bodies separated from the ocean by a barrier, connected at least intermittently to the ocean by one or more restricted inlets and usually oriented shore-parallel. Lagoons formed as a result of rising sea level during the Holocene or Pleistocene and the building of coastal barriers by marine processes. On a geologic time scale, they are short-lived landscape features, with an existence intrinsically linked to their filtering efficiency and the rate of relative sea-level change in response to global climatic change, local tectonic activity, and anthropogenic activities (Kjerfve, 1994).
The size of coastal lagoons varies substantially, having depths which seldom exceed a couple of meters. It may or may not be subject to tidal mixing and salinity can vary from that of a coastal fresh-water lake to a hypersaline lagoon, depending on the hydrologic balance. Hydrological features are moulded to a certain extent by the morphology of the lagoon and by the dimension of the canals through which exchange of water with the sea occurs (Bird, 1994; Kjerfve, 1994).
Kjerfve and Magill (1989) sub-divided coastal lagoons into three geomorphic types based on the water exchange with the ocean: choked lagoons, restricted lagoons and leaky lagoons. According to these authors:
Choked lagoons are connected to the sea by a single long narrow entrance channel, along coasts with high wave energy and significant littoral drift. Tidal oscillations are often reduced to 5% or less as compared to the adjacent coastal tide and lagoons are characterized by long flushing times, dominant wind forcing and intermittent stratification events due to intense solar radiation or runoff events. Lagoons are mostly oriented shore-parallel but some are associated with river deltas and then occasionally oriented shore-normal.
Restricted lagoons consist of a large and wide water body, usually oriented shore-parallel and exhibit two or more entrance channels or inlets. As a result, restricted coastal lagoons have a well-defined tidal circulation, are influenced by winds, mostly vertically well mixed and exhibit salinities from brackish water to
oceanic salinities. Flushing times are usually considerably shorter than for choked coastal lagoons.
Leaky lagoons are elongated shore-parallel water bodies with many ocean entrance channels along coasts where tidal currents are sufficiently strong to overcome the tendencies by wave action and littoral drift to close the channel entrances. These lagoons occupy the opposite end of the spectrum from choked lagoons. Leaky lagoons are characterized by numerous wide tidal passes, unimpaired water exchange with the ocean on wave, tidal and longer time scales, strong tidal currents, and salinities close to that of the coastal ocean.
The choked lagoon type is characteristic of physically controlled ecosystems with strong fluctuations in environmental parameters depending on weather conditions (Gamito et al., 2005). Some examples of portuguese choked lagoons are Foz de Almargem, Salgados, Santo André and Albufeira lagoons. In South Portugal, Ria de Alvor can be considered a restricted lagoon, although it has only one entrance channel, and Ria Formosa belongs to the leaky lagoon type.
These coastal ecosystems are highly dynamic and strongly influenced by river input, wind stress, tides, precipitation-evaporation balance, responding differently to these forcing functions (Kjerfve, 1994). Water quality and eutrophication depend critically on lagoon circulation, salt and material dispersion, water exchange with the ocean and turnover, residence or flushing times (Bird, 1994; Kjerfve, 1994).
The generated environmental stress regulates the structure of biological assemblages and leads to complex interactions among physical (light, temperature, mixing, flow), chemical (organic and inorganic carbon, oxygen, nutrients) and biological parameters and processes (nutrients uptake, predation, competition). Changes in the primary producers’ structure affect secondary producers, as they are the basis of the trophic food web (Pérez-Ruzafa et al., 2002; Gamito et al., 2005; Viaroli et al., 2008).
Coastal lagoons are commonly characterised by high productivity as they accumulate nutrients supplied by the surrounding watershed and therefore are particularly vulnerable to water quality deterioration, namely eutrophication (Taylor et al., 1999; Cloern, 2001). Eutrophication is often caused by a rapid enrichment of nutrients (phosphorus and nitrogen) as a consequence of some anthropogenic activities such as
the introduction of sewage effluents and agriculture runoff. High concentrations of nutrients promote the growth of phytoplankton leading to the potential occurrence of algal blooms, generally dominated by single species some of which can be harmful due to the production of biotoxins (Tomàs- Vives, 1996; Glibert et al., 2005). Algal blooms in the water column also affect benthic primary producers through shading, causing their decline. Dead material decomposition in the sediments promotes the decay of dissolved oxygen and the efflux of nutrients from the sediments to the water column, contributing to the intensification of eutrophication (Brito et al., 2010, 2012).
The eutrophication process comprises four major successional stages: oligotrophic, mesotrophic, eutrophic and hypertrophic. A brief description of each state defines that (Gamito et al., 2005 and references therein):
Oligotrophic lagoons have low levels of nutrient concentrations in the water column and consequently there is a restriction of phytoplankton growth, keeping water at high transparency levels. Light can easily reach the bottom and is not a limiting factor for benthic vegetation.
Mesotrophic lagoons are characterized by a medium level nutrient concentration in the water high enough to allow the growth of macroalgae, together with phytoplankton, as the major primary producers. Nutrients at this stage can still be assimilated by organisms, hence introducing major changes in the community structure, but keeping the water at relatively high levels of transparency. Mesotrophy can be induced by agriculture run-off and urban or industrial sewage. Nevertheless, river and groundwater inputs with high nutrients concentration, atmospheric deposition or the exchange of nutrient-enriched seawater from upwelling areas outside the lagoon can provide significant loads of nutrients. Both the planktonic and the benthic systems are affected by nutrient enrichment in the water column, increasing the competition between seagrass and macroalgae.
Eutrophic lagoons present high levels of nutrients in water and sustain large assemblages of phytoplankton as dominant primary producers.
Hyper-eutrophic lagoons correspond to the state in which phytoplankton assemblages increase up to the self-shadow level, preventing light from reaching the bottom and not allowing macroalgae to grow.
Water quality deterioration and eutrophication have become a major problem affecting coastal lagoons worldwide and in 2000, the European Community established as one of the main goals of the European Water Framework Directive (C.E.C., 2000), the achievement of good ecological status in coastal and transitional waters by the year 2015.
In Portugal, Bettencourt et al. (2004) developed guidelines for the application of the WFD concerning the definition of the typology and reference conditions for Portuguese transitional and coastal waters. Ferreira et al. (2007) defined a monitoring plan for water quality and ecology in Portuguese coastal waters. For restricted coastal water bodies, which include coastal lagoons, the monitoring plan proposes the surveillance of hydro-morphological elements; physic and chemical water parameters, namely thermal conditions, dissolved oxygen, salinity and nutrients; special pollutants in suspended particulate matter, sediments and tissues of fish and shellfish; and biological quality elements. The biological quality elements to monitor are focused on phytoplankton, other aquatic flora, macroinvertebrates and fish. Sampling frequency depends on the quality elements monitored. For physic and chemical water parameters, phytoplankton biomass and abundance is suggested a monthly frequency, while for phytoplankton species composition and macroinvertebrates it could be every six months (Ferreira et
al., 2007).
Phytoplankton communities have been used as biological indicators of water quality, once respond to changes in nutrients concentrations, water renewal, physical, chemical and biological parameters (CEMAGREF-IARE, 1994; Ferreira et al., 2007; Gamito et
al., 2005; Brito et al., 2012; Pereira Coutinho et al., 2012). Phytoplankton dynamics is
influenced by bottom-up and/or top-down factors (Krebs, 1994). Bottom-up factors control species growth (e.g. light intensity, temperature, salinity, availability of nutrients, nutrients ratio and chemical form), while top-down factors control its biomass (e.g. predation, competition) (Wehr and Descy, 1998).
Benthic macroinvertebrates also represent a relevant component of coastal ecosystems, playing a vital role in nutrient cycling, detrital decomposition and as a food source for higher trophic levels (Pearson and Rosenberg, 1978). Due to the relatively sessile habit and thus, the incapability to avoid unfavourable conditions, macrobenthic species are sensitive indicators of changes in the environment caused by natural or anthropogenic disturbances (Salas et al., 2006). Since benthic species are relatively long-lived they
integrate water and sediment quality conditions with time and thereby, indicate temporal and chronic disturbances (Warwick et al., 1990). Effects of these disturbances include changes in diversity, biomass, abundance of stress tolerant or sensitive benthic species, and changes in the trophic or functional structure of the benthic community (Pearson and Rosenberg, 1978; Reiss and Kröncke, 2005; Gamito, 2006, 2008).
1.2. General Aims
The present study intended to compare environmental conditions and biotic communities of two choked coastal lagoons, with the purpose of evaluating the effects of organic pollution from wastewater discharges in water quality and biotic communities from different levels of the food chain. Thereby, three general aims were defined:
1. Characterize the environmental conditions (hydrological aspects, water parameters and sediment parameters) and evaluate the water quality and trophic state of the coastal lagoons;
2. Study the phytoplankton communities’ dynamics and determine its relation with environmental parameters and the trophic state of the coastal lagoons;
3. Study the dynamics of benthic macroinvertebrate communities and determine its relation with environmental parameters and the trophic state of the coastal lagoons.
A few studies had been done before 2001 in Salgados lagoon, mainly focused on the landscape, fauna and flora characterization and management (e.g. Fernandes, 2001; Ministro, 2002), water quality (e.g. Neves, 1999) and also on the implications of artificial opening of the lagoon to the sea (e.g. Pinto et al., 2001). For Foz de Almargem lagoon, no previous studies were available.
1.3. Study Areas
The selection of the study areas was based on the presence and absence of discharges from wastewater treatment plants in Salgados and Foz de Almargem, respectively. Both lagoons are located in the south coast of Algarve and belong to the Algarve’s rivers hydrographical region (Figure 1.1).
Figure 1.1 – Location of Foz de Almargem and Salgados lagoons in the south coast of Algarve. (adapted from http://geo.snirh.pt/AtlasAgua/)
Foz de Almargem coastal lagoon is located in the Loulé council (Lat. 37º 03` 39`` N; Long. 8º 04` 58`` W). The drainage basin comprises two small rivers, Almargem and Fonte Santa, with a seasonal dynamic strongly influenced by meteorological conditions. The lagoon is a small brackish wetland, which occupies around 20 ha, most of it shallow and only with a deeper main channel (Fig. 1.2). When all the lagoon area is flooded, the mean depth is approximately 1m and the maximum depth is about 2.5 m. Most of the year, the lagoon is isolated from the sea by a thin sand barrier, but from autumn until spring sometimes this barrier is naturally destroyed by waves or artificially by fishermen forming a channel between the lagoon and the sea. The frequency and duration of natural channel opening depends mainly on the wave height and tide amplitude. When the lagoon is opened there is tidal influence but only in the main channel, where the maximum depth is around 1.5 m; the remaining area is not flooded and the sediment becomes exposed.
No sources of organic pollution were known, besides the runoff from agriculture lands.
Figure 1.2 – Foz de Almargem coastal lagoon with high (left side) and low (right side) water level. Sampling stations: E1 – Upstream; E2 – Intermediate; E3 – Downstream (adapted from Google Earth).
Salgados coastal lagoon is a semi-enclosed brackish wetland, located in the Albufeira and Silves councils (Lat. 37º 05` 25`` N; Long. 8º 19`44`` W). The drainage basin comprises 39 Km2 from two small rivers, Espiche and Vale Rabelo (Neves, 1999). The lagoon occupies a total surface of 40 ha, most of it shallow and only with a deeper area downstream. The mean depth is approximately 1 m and the maximum depth is about 5 m (Figure 1.3).
A thin sand barrier separates the lagoon from the sea and in natural conditions, when the water level in the lagoon would reach 5.7 m above the sea level, a channel was formed connecting the lagoon to the sea (Pinto et al., 2001). Nowadays, a channel is artificially opened every time the water level in the lagoon rises from 4.5 to 5.0 m above the sea level. The artificial openings of the lagoon are managed by the regional environmental
services, former CCDR Algarve, with the purpose of renewing the lagoon water and preventing the flooding of a golf course located nearby. Usually, the period of connection between the lagoon and the sea does not exceed a week, depending on the freshwater inputs, the wave height and tide amplitude. When rivers runoff is high and the sea is calm, the lagoon stays open for longer time.
Besides the freshwater inputs from the small rivers, Salgados lagoon also used to receive the discharges of two wastewater treatment plants, which accounted approximately 27% of the total freshwater input in summer (Neves, 1999) and maintained the water level high in this season. These wastewater treatment plants worked inefficiently most of the time, due to the high affluence of tourists to this region all over the year. Consequently, effluents were discharged into Espiche river with concentrations of organic matter, phosphorous and nitrogen higher than those allowed by national legislation. Wastewater was therefore, the main direct source of organic pollution in the lagoon (Neves, 1999). Nevertheless, in the drainage basin there were also some sources of diffuse organic pollution namely, the runoff from agriculture lands and from a golf course implanted in one of the lagoon margins.
Figure 1.3 – Salgados coastal lagoon with high (left side) and low (right side) water level. Sampling stations: E1 – Upstream; E2 – Intermediate; E3 – Downstream (adapted from Google Earth).
According to the report that defined the typology and reference conditions for Portuguese transitional and coastal waters (Bettencourt et al., 2004), coastal lagoons in Portugal were considered coastal waters and were divided in two typologies (Figure 1.4):
(A3) – Mesotidal semi-enclosed lagoons. These types of lagoons have a direct but
intermittent connection with the ocean, which is frequently closed by a sand bar. Artificial opening occurs mainly in the summer months. These systems are shallow, with a mean water depth less than 2 m. Salinity varies widely and is strongly influenced by evaporation, occasional freshwater inputs (precipitation and runoff) and by cycles of temporary communication with the sea. The tidal influence on the lagoons is moderate and only occurs during periods of free connection with the ocean. Sand dunes cover the coastal and lagoon shores and extensive reed beds colonize wetland areas. Santo André, Albufeira and Óbidos lagoons were included in this typology.
(A4) – Mesotidal shallow lagoon. The communication between the lagoon and the sea
is permanent and occurs through several inlets located along the system. The shallow depth, strong tidal currents and high water renewal make this type of lagoon vertically well-mixed. The mean water depth is about 2 m and salinity values are always above 30 since the freshwater input can be considered negligible – in summer conditions this type of system may become an inverse estuary. This type encompasses a complex of coastal seawater lagoons on sandy or muddy soils, extensive mudflats, sandbanks, sand dune systems, salt marshes, wetlands and subtidal seagrass beds. Ria Formosa and Ria de Alvor are the most significant examples in Portugal of this type of lagoon.
This classification associated the systems in southern Portugal with most Mediterranean systems, which present a hot summer Mediterranean climate with dry season and precipitation during the winter (Brito et al., 2012).
Although Foz de Almargem and Salgados lagoons are located in southern Portugal (between Ria Formosa and Ria de Alvor), these lagoons are not permanently open to the sea and present characteristics of semi-enclosed lagoons.
Table 1 resumes the general characteristics of Foz de Almargem and Salgados lagoons on the perspective of the Water Framework Directive.
TICOR systems shown in blue.
Figure 1.4 – Typology of transitional waters and sheltered coastal waters (Bettencourt et al., 2004).
Table 1.1 – Resume of the general characteristics of Foz de Almargem and Salgados lagoons.
Foz de Almargem lagoon Salgados lagoon
Latitude 37º 03` 39`` N 37º 05` 25`` N
Longitude 8º 04` 58`` W 8º 19`44`` W
Type Coastal Water
A3 – Mesotidal semi-enclosed lagoon
Mesotidal – 2 m during periods of free connection to the ocean Descriptor
Tidal range
Salinity Mesohaline (5-6 to 18-20 ‰)
Strongly influenced by occasional freshwater inputs and by cycles of temporary communication with the ocean
Shape Semi-enclosed
2. ENVIRONMENTAL CONDITIONS:
HYDROLOGY, WATER, SEDIMENT AND TROPHIC STATE
2.1. Specific Aims
A general aim of this study was to characterize environmental conditions and to evaluate the water quality and trophic state of the two coastal lagoons. Specifically this aim included:
1. Description of seasonal changes in the hydrological regimen of the lagoons, associated to rainfall and connection with the sea.
2. Characterization of seasonal variation in water parameters, comparison along the gradient of distance to the sea and between lagoons.
3. Characterization of seasonal variation in sediment parameters, comparison along the gradient of distance to the sea and between lagoons.
4. Study the relations among environmental parameters in the two lagoons.
5. Comparison of environmental parameters, when the lagoons were isolated and in connection with the sea.
6. Evaluation of the trophic state and water quality along the gradient of distance to the sea and comparison between lagoons.
2.2. Material and Methods
2.2.1. Hydrological aspects
Hydrological characterization consisted on basic description of water level variation in the lagoons. Water level data and information about Salgados lagoon connection to the sea was provided by the regional environmental services, CCDR-Algarve, former DRAOT. Water level measurements were daily collected in the deepest part of the lagoon.
No quantitative data was available for the water level in Foz de Almargem lagoon and an ordinal scale was adopted, based on reference points in the lagoon margins.
Information about the lagoon openings to the sea was given by local fishermen and by observation in situ.
Meteorological data were obtained from the INAG - Instituto Nacional da Água website
(http://snirh.pt). The meteorological field station nearest to Foz de Almargem coastal
lagoon is located in Loulé (31I/01UG) and the only data available for the studied period concerned daily rainfall, wind speed and wind direction. For Salgados coastal lagoon, daily rainfall and temperature data were gathered from the Algoz meteorological field station (31H/02C).
2.2.2. Water parameters
2.2.2.1. Field procedures and laboratory analyses
Field work was done from June 2001 to July 2002, with an interval of approximately 45 days.
In each lagoon, water sampling took place in three stations along a gradient of distance from the sea (E1- Upstream; E2- Intermediate; E3- Downstream).
Physical and chemical water parameters were analysed in situ and in laboratory. Temperature, salinity, dissolved oxygen concentration, oxygen saturation and pH were measured in the superficial water layer (50 cm depth) with a multi-parameter probe (YSI 556 MPS). Water samples with 1 L were collected at the same depth and preserved in cold, dark conditions for laboratory analysis of suspended matter (total solids in suspension) and dissolved nutrients (ammonia, nitrites, nitrates, orthophosphates and total phosphorus), as described in Greenberg et al. (1992). Dissolved inorganic nitrogen (DIN) was obtained as the sum of N-NH4+, N-NO2- and
N-NO3-.
In spring (May 2002), temperature, salinity, dissolved oxygen concentration, oxygen saturation and pH were monitored during a 24 hours cycle in two sampling stations (upstream and downstream in Foz de Almargem; intermediate and downstream in Salgados).
Besides physical and chemical water parameters, chlorophyll a was also quantified as an indicator of phytoplankton biomass that is required by many indexes of water quality and trophic state (Carlson, 1977; Vollenweider et al. 1998; Brito et al. 2012; Pereira
Coutinho et al. 2012). Water samples for chlorophyll a determinations were filtered through Whatman GF/C glass fibre filters and pigment extraction was performed with 90 % acetone. Pigment concentration was measured by spectrophotometry (Parsons et
al., 1984; Greenberg et al., 1992) and calculations were done according to Lorenzen
(1967). Pigment diversity was determined based on the absorbance at 430 and 665 nm (Margalef, 1960).
2.2.2.2. Data analysis
Data from the lagoons were first analysed separately, for sampling station comparison and then, mean values of each lagoon were compared.
Differences in water parameters from the sampling stations and differences between lagoons were tested through parametric tests (One-Way ANOVA: three stations; Student T test: two lagoons) or non-parametric tests (Kruskal-Wallis test: three stations; Mann-Whitney U test: two lagoons), depending on data normality distribution and homogeneity of variances, after logarithmic transformation (ln x+1). The LSD Fisher multiple comparison test was used to determine which of the three stations differed significantly (Maroco, 2010).
Principal component analyses (PCA) were performed oneach sampling station data and on the mean values of the lagoons, to determine which variables were correlated and to summarize stations and lagoons characteristics in ordination diagrams. Water level in the lagoons and rainfall (cumulative values of rainfall from the 10 days prior to sampling) were also included, for seasonal comparison. Data were first centred and standardized, once variables had different units (Pielou, 1984).
2.2.3. Sediment parameters
2.2.3.1. Field procedures and laboratory analyses
Field work was done in the same periods as water monitoring.
In Foz de Almargem lagoon, sediment sampling was done in the three stations previously described, but in March 2002 no samples were collected as the water level was in its maximum and sampling stations were not reachable.