Mohammad Zaefizadeh(1), Shahzad Jamaati‑e‑Somarin(2), Javid Ojaghi(3), Seyed Mehdi Seyedi(4), Roghayyeh Zabihi‑e‑Mahmoodabad(2) and Mehran Ochi(5)
(1)Islamic Azad University, Ardabil Branch, Ardabil, Iran. E‑mail: mzaefi@gmail.com (2)Young Researchers Club, Islamic Azad University,
Ardabil Branch, Ardabil, Iran. E‑Mail: jamaati_1361@yahoo.com, rogizm@yahoo.com (3)Faculty of Biology, Baku State University‑Azerbaijan.
E‑mail: sos594490@yahoo.com (4)National Institute of Genetic Engineering and Biotechnology (NIGEB). E‑mail: nlotfollah@yahoo.com (5)Academic Center for Evaluation & Researchers of Iran. E‑mail: ochimehran@yahoo.com
Abstract – The objective of this study was to identify gliadin band patterns andthe extent of genetic diversity in durum wheat genotypes from Northwestern Iran and the Republic of Azerbaijan. Gliadinsfrom 46 landraces and four
cultivars were evaluated through acid PAGE analyses. Sixty‑six polymorphic bands and 81 patterns were identified. Twenty‑four different motility bands and 22 patterns were found in the ω gliadin region with 14 polymorph bands and 20 patterns for α and γ gliadins, and 14 bands and 19 different patterns for β gliadins. The combination of these patterns generated 38 and 39 combinations for Gli‑1 and Gli‑2 loci, respectively. The genetic diversity index (H) was
higher for α gliadins (0.924), followed by ω and γ gliadins (0.899 and 0.878, respectively), and for β gliadin patterns (0.866). Extensive polymorphism (H = 0.875) was observed in four gliadin pattern regions, with higher genetic
diversity in the Iranian landraces than in the Azerbaijani ones. Each genotype had special identifying patterns in the
gliadin acid PAGE analysis, and cluster analysis based on Jaccard’s similarity coefficients formed six groups. Gliadin
has a simple, repeatable and economic analysis, and can be used in genetic studies.
Index terms: Triticum durum, acid PAGE analysis, germplasm, traditional agriculture.
Diversidade genética para padrões de gliadinas de raças locais
de trigo duro no Noroeste do Iran e no Azerbaijão
Resumo – O objetivo deste trabalho foi identificar padrões de bandas de gliadinas e a extenção da variabilidade genética em genótipos de trigo duro do Noroeste do Iran e da República do Azerbaijão. Gliadinas de 46 raças locais e de quatro cultivares foram avaliadas por meio de análises "acid PAGE". Sessenta e seis bandas polimórficas e 81 padrões foram identificados. Foram encontradas 24 bandas de mobilidade e 22 padrões na região da gliadina ω, com 14 bandas polimorfas e 20 padrões para as gliadinas α e γ, e 14 bandas e 19 padrões diferentes para as gliadinas β. A combinação desses padrões gerou 38 e 39 combinações, para os locos Gli‑1 e Gli‑2, respectivamente.
O índice de diversidade genética (H) foi maior para as gliadinas α (0,924), seguidas pelas gliadinas ω e γ (0,899 e 0,878, respectivamente), e pela gliadina β (0,866). Alto polimorfismo (H = 0,875) foi observado em quatro regiões dos padrões de gliadinas obtidos, com diversidade genética maior nas raças locais iranianas do que nas do Azerbaijão. Cada genótipo apresentou padrões de identificação especiais na análise "acid PAGE" de gliadinas, e a análise de agrupamento baseada no coeficiente de similaridade de Jaccard formou seis grupos. A gliadina é de
análise simples, repetível e econômica, e pode ser usada em estudos genéticos.
Termos para indexação: Triticum durum, análise "acid PAGE", germoplasma, agricultura tradicional.
Introduction
Landraces or traditional cultivars are locally adapted diverse populations, which are the result of natural selection and farmers’ cultivation methods. They have contributed with genetic material to many breeding programs and constitute important plant genetic resources. Landraces have attracted the scientific interest because of the presence of genetic variability in well-adapted backgrounds. Despite the
great advantages of using local-adapted germplasm, the diversity of durum wheat (Triticum durum Desf.) landraces is seriously threatened by genetic erosion due to its replacement with new, exogenous, high-yielding genetically uniform cultivars of bread wheat (Rashed et al., 2007).
the bread making quality of wheat. Gliadin proteins can be grouped into α, β, γ and ω‑gliadin families based on their mobility in electrophoresis gels (Laemmli, 1970). Each variety is characterized by a specific set of traits that determine its use. Gliadins and glutenins are genetic markers that allow expeditious and objective identification of a variety, and the determination of its genetic constitution and some important traits.
Tanaka et al. (2003) used acid PAGE to determine the electrophoretic patterns of gliadins in 107 common wheat lines derived from Japan. They found that the gliadin patterns of Japanese wheat cultivars and landraces differed greatly from the patterns of wheat lines from other countries, and the variation seen in wheat lines from Japan was limited to 46 patterns. Seven collection or breeding areas in Japan showed different frequencies in their gliadin patterns. Sewa et al. (2005) analysing the acid PAGE gliadin patterns of 156 Indian wheats (Triticum aestivum L.), reported extensive polymorphism [genetic diversity index (H) = 0.875] and identified 147 gliadins band patterns. Caballero et al. (2004) studied gliadin composition analysis in 403 accessions of Spanish spelt wheat (Triticum aestivum ssp. spelta). They found 61different patterns for the ω gliadins, 44 for the γ gliadins, 19 for the β gliadins and 15 for the α gliadins. Several authors reported high degree of variability in gliadin patterns (Zillman & Bushuk, 1979; Metakovsky et al., 1991).
The combination of different alleles of gliadins makes it possible to distinguish wheat genotypes. In addition, significant positive effects of certain gliadin alleles have been reported on gluten strength (Metakovsky et al., 1997). Nizar (2002) used the electrophoretic pattern of gliadin groups to identify and classify 187 Triticum durum cultivars. He found that the omega-gliadin region had a wider range for the number of bands than all the other gliadin regions. Cluster analyses put the cultivars of all groups in trees on the basis of the gliadin band distribution. The genetic polymorphism of gliadins has been used to evaluate genetic diversity within several germplasms in Australia (Metakovsky et al., 1990), Yugoslavia (Metakovsky et al., 1991), Italy (Metakovsky et al., 1994), France (Metakovsky & Branard, 1998), and Spain (Metakovsky et al., 2000).
The knowledge of the genetic relationships of genotypes provides useful information for breeding
(Roldán-Ruiz, 2001). Some advantages of gliadin alleles for wheat genotype identification over up-to-date molecular markers have been discussed (Metakovsky et al., 1997). Although located on only two chromosomes of seven homologous groups, gliadin genes (Payne et al., 1982) show many more multiple alleles than other wheat genes: more than 30 allelic variants were described and catalogued for some Gli loci (Metakovsky et al., 1991), while only a few alleles were found for the most polymorphic DNA markers (Talbert et al., 1994; Röder et al., 1995). Therefore, using gliadin alleles enables investigation of wheat cultivars to reveal much more intraspecific genetic polymorphism.
Allelic variants differ in the number, mobility, and intensity of their components, and can be characterized through acid PAGE or even SDS-PAGE. The use of registered crop varieties makes their expeditious identification important, and its significance is increased by the diversity of varieties in many important traits (Masouleh, 2005). The diversity of gliadin patterns in Northwestern Iran and Azerbaijan durum wheat landraces has not been reported so far.
The objective of this study was to identify gliadin band patterns andthe extent of genetic diversity in durum wheat genotypes from Northwestern Iran and the Republic of Azerbaijan.
Materials and Methods
Four cultivars and 46 subconvars (landraces) of durum wheat from Northwestern Iran and the Republic of Azerbaijan were evaluated (Table 1). Landraces were obtained from the Azerbaijan Genetic Resources Institute (AMEA) and from the Ardabil Islamic Azad University (Iran), in 2008. Subconvars of durum wheat were defined and identified by the method of Dorofeev et al. (1979), based on spike characteristics.
For the polyacrylamide gel electrophoresis (A-PAGE), gliadins were extracted with a 1.5 mol L-1
dimethylformamide aqueous solution and fractionated by A‑PAGE at 8.5% (C 5 2.67%), with low catalyst levels (ferrous sulfate and hydrogen peroxide) to increase gel firmness. Electrophoresis was done at 25 mA per gel at 88oC for 45 min, after the tracking
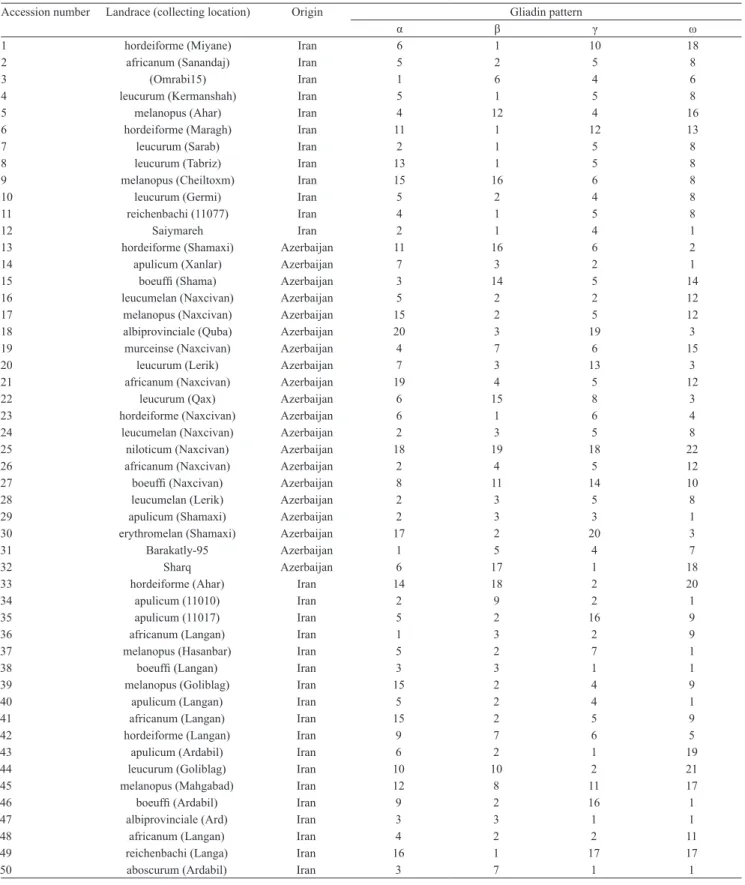
Table 1. Durum wheat landraces and their identified a, β, γ and ω patterns.
Accession number Landrace (collecting location) Origin Gliadin pattern
α β γ ω
1 hordeiforme (Miyane) Iran 6 1 10 18
2 africanum (Sanandaj) Iran 5 2 5 8
3 (Omrabi15) Iran 1 6 4 6
4 leucurum (Kermanshah) Iran 5 1 5 8
5 melanopus (Ahar) Iran 4 12 4 16
6 hordeiforme (Maragh) Iran 11 1 12 13
7 leucurum (Sarab) Iran 2 1 5 8
8 leucurum (Tabriz) Iran 13 1 5 8
9 melanopus (Cheiltoxm) Iran 15 16 6 8
10 leucurum (Germi) Iran 5 2 4 8
11 reichenbachi (11077) Iran 4 1 5 8
12 Saiymareh Iran 2 1 4 1
13 hordeiforme (Shamaxi) Azerbaijan 11 16 6 2
14 apulicum (Xanlar) Azerbaijan 7 3 2 1
15 boeuffi (Shama) Azerbaijan 3 14 5 14
16 leucumelan (Naxcivan) Azerbaijan 5 2 2 12
17 melanopus (Naxcivan) Azerbaijan 15 2 5 12
18 albiprovinciale (Quba) Azerbaijan 20 3 19 3
19 murceinse (Naxcivan) Azerbaijan 4 7 6 15
20 leucurum (Lerik) Azerbaijan 7 3 13 3
21 africanum (Naxcivan) Azerbaijan 19 4 5 12
22 leucurum (Qax) Azerbaijan 6 15 8 3
23 hordeiforme (Naxcivan) Azerbaijan 6 1 6 4
24 leucumelan (Naxcivan) Azerbaijan 2 3 5 8
25 niloticum (Naxcivan) Azerbaijan 18 19 18 22
26 africanum (Naxcivan) Azerbaijan 2 4 5 12
27 boeuffi (Naxcivan) Azerbaijan 8 11 14 10
28 leucumelan (Lerik) Azerbaijan 2 3 5 8
29 apulicum (Shamaxi) Azerbaijan 2 3 3 1
30 erythromelan (Shamaxi) Azerbaijan 17 2 20 3
31 Barakatly‑95 Azerbaijan 1 5 4 7
32 Sharq Azerbaijan 6 17 1 18
33 hordeiforme (Ahar) Iran 14 18 2 20
34 apulicum (11010) Iran 2 9 2 1
35 apulicum (11017) Iran 5 2 16 9
36 africanum (Langan) Iran 1 3 2 9
37 melanopus (Hasanbar) Iran 5 2 7 1
38 boeuffi (Langan) Iran 3 3 1 1
39 melanopus (Goliblag) Iran 15 2 4 9
40 apulicum (Langan) Iran 5 2 4 1
41 africanum (Langan) Iran 15 2 5 9
42 hordeiforme (Langan) Iran 9 7 6 5
43 apulicum (Ardabil) Iran 6 2 1 19
44 leucurum (Goliblag) Iran 10 10 2 21
45 melanopus (Mahgabad) Iran 12 8 11 17
46 boeuffi (Ardabil) Iran 9 2 16 1
47 albiprovinciale (Ard) Iran 3 3 1 1
48 africanum (Langan) Iran 4 2 2 11
49 reichenbachi (Langa) Iran 16 1 17 17
(w/v) Coomassie Brilliant Blue R‑250. Destaining was carried out with tap water. The strategy was followed for all the cultivars, and large numbers of different patterns were identified in each group of gliadins (α, β, γ and ω). The exercise was repeated five times to confirm the pattern of genotypes within each group. Since Bezostaya and Anza cultivars were used as checks in each gel, comparison of bond pattern among different genotypes was easy. Homogeneity of each genotype was determined by extracting gliadins from five individual seeds from each sample.
The presence and absence of each band polyacrylamide gel electrophoresis was coded as "1" and "0" respectively. The genetic distance and similarity were computed with the SPSS software (SPSS, 1999). Cluster analysis was done based on the Jaccard’s similarity coefficients. The genetic diversity for each gliadin pattern was calculated as per Nei (1973) as H =1 -
S
Pi2, in which H is the genetic variation index,and Ρi is the proportion of a particular pattern in each group of α, β, γ and ω gliadins separately. The mean value of H was calculated for all the four groups of gliadins.
Results and Discussion
Up to 66 different bands were detected assuming that the bands with the same relative mobility represent the same subunit. Each zone (α, β, γ and ω) was considered as a single locus and the different patterns as allelic variants. The patterns within each gliadin group of α, β, γ and ω were identified by comparing banding patterns of each variety with all the other varieties, and a specific number was assigned to each of the patterns as per the modified method of Masouleh (2005).
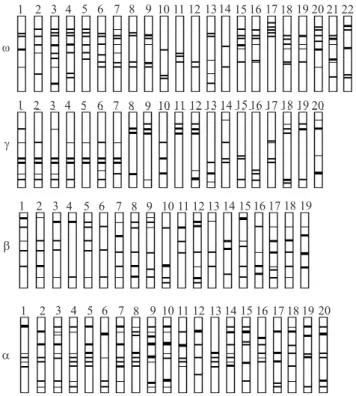
Eighty-one different gliadin patterns were identified, of which 22 different mobility band patterns were in the region of ω gliadins, 20 in the region of γ gliadins, 19 in the region of β and 20 in the region of α gliadins. Ideograms of all the different patterns observed are presented in Figure 1. The most frequent patterns were: 5, 2 and 6 in α gliadins; 1, 2 and 3 in β gliadins; 1, 2, 4, 5 and 6 in γ gliadins, and 1, 3, 8, 9 and 12 in the region of ω gliadins (Table 1). In this study, the ω gliadin patterns 1 and 8 were present in 20% landraces, the γ gliadin patterns 4
2 and 3 in 30 landraces (60%) and α gliadin pattern 2, 5 and 6 in 19 landraces (38%).
The ideogram showed higher variation in the γ and ω gliadins than in the α and β gliadins (Figure 1). This may be either due to greater staining intensity of the α and β gliadins, or the separation of these proteins may not be complete in a 1-D electrophoresis system (Sewa et al., 2005). Although care was taken to separate all the bands, more than one protein may be present in a band in the region.
Since α and β gliadins are controlled by genes present on six homological groups, and γ and ω gliadins on only one homological group, there may be less polymorphism in gliadins synthesized by the six homological groups, though this should be verified by further genetic studies. Tanaka et al. (2003) also reported larger variation in γ and ω gliadins than in α and β gliadins in Japanese cultivars.
Most of γ and ω gliadin genes are located at the Gli‑1 loci (Payne, 1987). The combination of their different patterns would give different allelic variation for these loci. In our study, we found 38 different combinations. The combination formed
Figure 1. Ideograms of different gliadins patterns in the a,
by pattern 8 of the ω gliadins and pattern 5 of the γ gliadins were most frequent (14% of the landraces), followed by the combination of patterns γ ‑5, γ ‑1 and ω ‑12, ω ‑1, which appeared in six landraces.
The gene codings for most α and β gliadins occur on the Gli‑2 loci (Payne, 1987). In the present study, 39 different combinations of these gliadins were detected, with the most frequent being pattern 2 of the β gliadins and pattern 5 of the α gliadins found in 12% landraces. All patterns were classified following the Marshall & Brown (1975) criteria, defining four classes of alleles based on their allele frequency and their distribution within and between populations. The alleles with frequency lower than 5% were defined as rare.
Twenty‑two patterns for the ω zone were classified as rare, five with wide distribution appearing in at most two landraces, and fifteen that occurred in only one landrace each. For the γ zone, two common, five rare and thirteen very rare patterns were found, all with a wide distribution. For the β zone, three common, three rare and thirteen very rare patterns were found, all with a wide distribution. All of the α gliadins patterns were rare or very rare, except for the 2 and 5, which appeared in six and eight landraces respectively. This finding concurs with the work by Caballero et al. (2004) and with Spanish spelt wheat accessions.
The variation found in the analyzed gliadin patterns was higher than in the gliadin bands. Sewa et al. (2005) reported 45 different gliadin bands in 157 Indian wheats, but they found 147 patterns. Harsch et al. (1997) found only 30 different bands, when analyzing sixteen spelt cultivars using densitometry methods, whereas Caballero et al. (2004) detected up to 72 different bands in 403 lines of spelt wheats.
The genetic diversity (H) based on gliadin patterns, observed in the durum wheat landraces, in this study, was higher (H = 0.892) than in other countries (Table 2): Spain, H = 0.844 (Metakovsky et al., 2000); France H = 0.714 (Metakovsky & Branlard, 1998); England, Italy, and the former Yugoslavia with H = 0.676, 0.754, and 0.728, respectively (Metakovsky et al., 1994); and Índia, H = 0.875 (Sewa et al., 2005). The high level of genetic diversity of durum wheat landraces grown in Iran and Azerbaijan could be caused initially by the variation of ecological conditions. It was shown that wheat might undergo intense geographical and microgeographic differentiation in adjusting their genotypes to the environment. The diversity was probably maintained by continuing cultivation of old varieties and local landraces and by introduction of new wheat germplasm from different sources (Metakovsky et al., 2000).
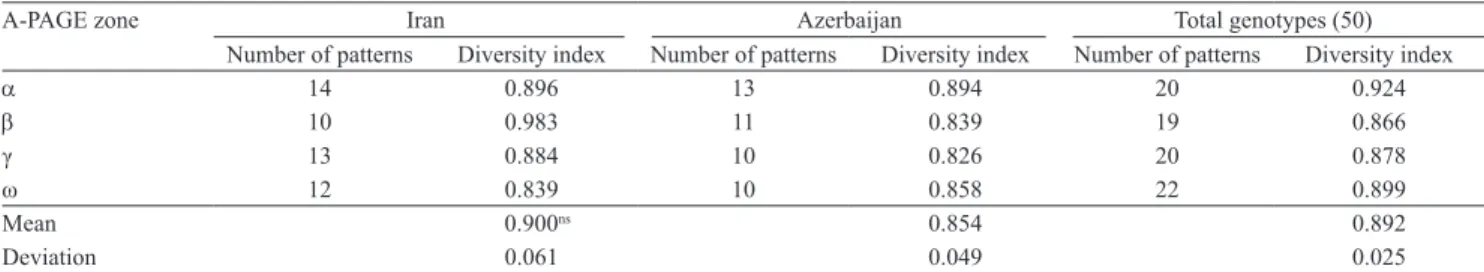
The genetic diversity indexes for 28 genotypes from Iran for α, β, γ and ω were 0.896, 0.983, 0.884 and 0.839, respectively, and for Azerbaijan landraces they were 0.894, 0.839, 0.826 and 0.858, respectively (Table 2). The highest genetic diversity index in this study was for β gliadin (H = 0.983) in Northwestern Iran, followed by β gliadin (H = 0.839) in Azerbaijan.
The average genetic diversity calculated from the data of four gliadin electrophoresis zones of the 28 Iranian landraces (Table 2) and the Azerbaijan landraces is high (H = 0.900 and 0.854, respectively), and could be caused by the wide geographical distribution of the genotypes.
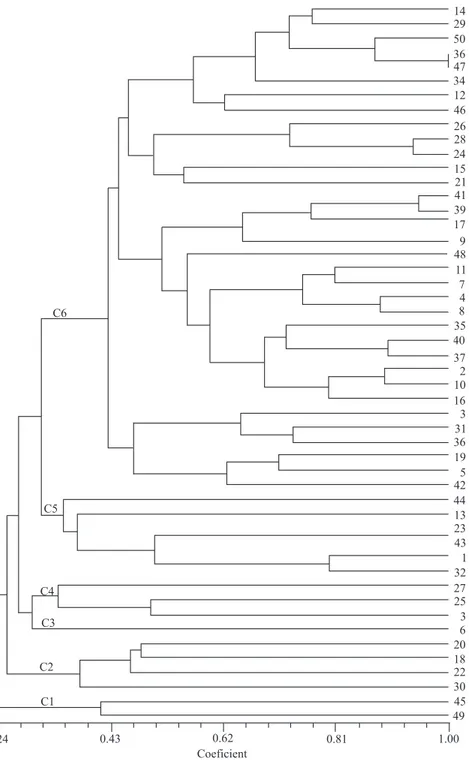
The genotype grouping can be seen in Figure 2. The six resulting dendrograms showed a clear separation of the durum wheat landraces. Cluster 1 included Iranian landraces 45 (melanopus from Mahgabad)
Table 2. Genetic diversity index of Iran and Azerbaijan durum wheat using a, β, γ and ω gliadins.
A-PAGE zone Iran Azerbaijan Total genotypes (50)
Number of patterns Diversity index Number of patterns Diversity index Number of patterns Diversity index
a 14 0.896 13 0.894 20 0.924
b 10 0.983 11 0.839 19 0.866
γ 13 0.884 10 0.826 20 0.878
ω 12 0.839 10 0.858 22 0.899
Mean 0.900ns 0.854 0.892
Deviation 0.061 0.049 0.025
pattern in the ω zone. Cluster 2 included landraces 18 (albiprovinciale from Quba), 20 (leucurum from Lerik), 22 (leucurum from Qax) and 30 (Barakatly‑95) from Azerbaijan, which had pattern 3 in the ω zone. The third cluster included only landrace 6 (hordeiforme from Maragh). Cluster 4 included
27 (boeuffi from Naxcivan) and 3 (Omrabi15 from Iran). Cluster five included landraces 1 (hordeiforme from Miyane), 13 (hordeiforme from shamxi), 23 (hordeiforme from Naxcivan), 32 (Sharq), 43 (apulicum from Ardabil) and 44 (leucurum from Goliblag) with pattern 6 from α gliadin zone.
Figure 2. Dendrogram of durum wheat landraces from Iran and Azerbaijan based
No correlation between genetic diversity, geographical distribution and the landraces was observed. Wegrzyn & Waga (2004) evaluated the relationships among 45 cultivars and strains of winter wheat by gliadin and glutenin protein polymorphisms. They found that the cluster analysis showed a considerable variation of the investigated genotypes, and the genetic distances between the cultivars ranged from 0.12 to 1.00.
Conclusions
1. Durum wheat landraces grown in Northwestern Iran and Azerbaijan have great genetic polymorphism in gliadin loci and patterns.
2. Gliadin acid PAGE analysis permits grouping of gliadin patterns and of group-based patterns, and is a reliable, simple, repeatable and economic procedure.
Acknowledgements
To Bonyad Melli Nokhbeghan, for partially supporting this work; to Drs. J. Ojaghi, H. Sadeghov and Sh. Jamaati-e-Somarin, for their critical review.
References
CABALLERO, L.; MARTIN, L.M.; ALVAREZ, J.B. Variation and
genetic diversity for gliadins in Spanish spelt wheat accessions. Genetic Resources and Crop Evolution, v.51, p.679‑686, 2004.
DOROFEEV, V.F.; FILATENKO, A.A.; MIGUSHOVA, E.F.; UDACZIN, R.A.; JAKOBZINER, M.M. Wheat. In: DOROFEEV,
V.F.; KOROVINA, O.N. (Ed.). Flora of cultivated plants.
Leningrad: Kolos, 1979. v.1, 346p.
HARSCH, S.; GÜNTHER, T.; KLING, C.I.; ROZYNEK, B.; HESEMANN, C.U. Characterization of spelt (Triticum spelta L.) forms by gel electrophoretic analyses of seed storage proteins. I. The gliadins. Theoretical and Applied Genetics, v.94, p.52‑60,
1997.
LAEMMLI, S. Cleavage of structural proteins during the assembly
of the head of bacteriophage-T4. Nature, v.227, p.680‑685, 1970.
MARSHALL, D.R.; BROWN, A.H.D. Optimum sampling strategies in genetic conservation. In: FRANKEL, O.H.; HAWKES,
J.G. (Ed.). Crop genetic resources for today and tomorrow.
Cambridge: Cambridge University, 1975.p.53‑70.
MASOULEH, A.K. Toward a molecular evaluation of grain quality using glutenin subunits in Triticum carthlicum. African Journal of Biotechnology, v.4, p.346‑349, 2005.
METAKOVSKY, E.V.; ANNICCHIARICO, P.; BOGGINI, G.;
POGNA, N.E. Relationship between gliadin alleles and dough strength in Italian bread wheat cultivars. Journal of Cereal Science, v.25, p.229‑236, 1997.
METAKOVSKY, E.V.; BRANLARD, G. Genetic diversity of French common wheat germplasm based on gliadin alleles.
Theoretical and Applied Genetics, v.96, p.209‑218, 1998.
METAKOVSKY, E.V.; GÓMEZ, M.; VÁZQUEZ, J.F.; CARRILLO,
J.M. High genetic diversity of Spanish common wheats as judged from gliadin alleles. Plant Breeding, v.119, p.37‑42, 2000.
METAKOVSKY, E.V.; KNEZEVIC, D.; JAVORNIK, B. Gliadin allele composition of Yugoslav winter‑wheat cultivars. Euphytica,
v.54, p.285‑295, 1991.
METAKOVSKY, E.V.; POGNA, N.E.; BIANCARDI, A.M.;
REDAELLI R. Gliadin allele composition of common wheat cultivars grown in Italy. Journal of Genetics and Breeding, v.48, p.55-66, 1994.
METAKOVSKY, E.V.; WRIGLEY, C.W.; BEKES, F.; GUPTA,
R.B. Gluten polypeptides as useful genetic markers in Australian wheats [Triticum aestivum]. Australian Journal of Agricultural Research, v.41, p.289‑306, 1990.
MURPHY, R.W.; SITIES, J.W.; BUTH, D.G.; HAUFLER, C.H. Protein. 1: Isozyme electrophoresis. In: HILLIS, D.M.; MORITZ, C. (Ed.). Molecular systematics. Sunderland: Sinauer Associates,
1990. p.45‑126.
NEI, M. Analysis of gene diversity in subdivided populations. Proceedings of the National Academy of Sciences of the United States of America, v.70, p.3321‑3323, 1973.
NIZAR, M.A. Gliadins polymorphism and cluster analyses of Syrian grown durum wheat. Plant Breeding and Seed Science, v.46, p.45-56, 2002.
PAYNE, P.I. Genetics of wheat storage proteins and the effect of
allelic variation on bread-making quality. Annual Review of Plant Physiology and Plant Molecular Biology, v.38, p.141‑153, 1987.
PAYNE, P.I.; HOLT, L.M.; LAWRENCE, G.J.; LAW, C.N. The
genetics of gliadin and glutenin, the major storage proteins of the wheat endosperm. Plant Foods for Human Nutrition, v.31,
p.229‑241, 1982.
RASHED, M.A.; ABOU‑DEIF, M.H.; SALLAM, M.A.A.; RIZKALLAA, A.A.; RAMADAN, W.A. Identification and prediction of the flour quality of bread wheat by gliadin
electrophoresis. Journal of Applied Sciences Research, v.3,
p.1393‑1399, 2007.
RÖDER, M.S.; PLASCHKE, J.; KÖNIG, S.U.; BÖRNER, A.; SORRELLS, M.E.; TANKSLEY, S.D.; GANAL, M.W. Abundance,
variability and chromosomal location of microsatellites in wheat. Molecular and General Genetics, v.246, p.327‑333, 1995.
ROLDÁN‑RUIZ, I.; EEUWIJK, F.A. van; GILLILAND, T.J.; DUBREUIL, P.; DILLMANN, C.; LALLEMAND, J.; DE LOOSE, M.; BARIL, C.P. A comparative study of molecular
and morphological methods of describing relationships between perennial ryegrass (Lolium perenne L.) varieties. Theoretical and Applied Genetics, v.103, p.1138-1150, 2001.
SEWA, R.; JAIN, N.; DAWAR, V.; SINGH, R.P.; SHORAN, J.
Analysis of Acid-PAGE gliadin pattern of India wheats (Triticum aestivum L.) representing different environments and periods. Crop Science, v.45, p.1256-1263, 2005.
SPSS. SPSS base 10.0 for Windows user’s guide. Chicago:
MAGYAR, G.M. Evaluation of sequence‑tagged‑site PCR
products as molecular markers in wheat. Theoretical and Applied Genetics, v.87, p.789‑794, 1994.
TANAKA, H.; TOMITA, M.; TSUJIMOTO, H.; YASUMURO, Y. Limited but specific variations of seed storage proteins in
Japanese common wheat (Triticum aestivum L.). Euphytica, v.132,
p.167‑174, 2003.
by gliadin electrophoregrams. II. Effects of environmental and experimental factors on the gliadin electrophoregrams. Canadian Journal of Plant Science, v.59, p.281‑286, 1979.
WEGRZYN, S.; WAGA, J. Genetic diversity of winter wheat
cultivars and strains determined by electrophoregrams of gliadin and glutenin proteins. Plant Breeding and Seed Science, v.49, p.51-61, 2004.