I
Cláudio Alexandre Almeida Pinheiro
Licenciado em Biologia
Measuring DNA lesions induced by
chemotherapeutic agents – DNA repair
and DNA Damage
Dissertação para obtenção do Grau de Mestre em Biotecnologia
Orientadora: Susana Nunes da Silva, Professora
Doutora, ToxOmics(NMS/UNL)
Co-orientadora: Helena Borba, Professora
Doutora, ToxOmics (NMS/UNL)
Júri:
Presidente: Professor Doutor Pedro Viana Baptista, FCT/UNL Arguente: Doutor Fábio Ferreira Carlos, FCT/UNL
III
LOMBADA
M
ea
su
ri
ng
D
N
A
L
es
ion
s i
nd
uc
ed
by
C
he
mot
he
rape
uti
c
A
ge
nts
–
D
N
A
R
ep
air
an
d DN
A
D
amag
e
V
UNIVERSIDADE NOVA DE LISBOA
FACULDADE DE CIÊNCIAS E TECNOLOGIA
DEPARTAMENTO DE QUÍMICA
Cláudio Alexandre Almeida Pinheiro
Measuring DNA lesions induced by chemotherapeutic agents – DNA repair and DNA damage
Dissertação apresentada para a obtenção do Grau de Mestre em Biotecnologia, pela Universidade Nova de Lisboa, Faculdade de Ciências e Tecnologia
Orientadora:
Professora Doutora Susana Nunes da Silva (NMS/UNL)
Coorientadora:
Professora Doutora Helena Borba (NMS/UNL)
VII
Measuring DNA lesions induced by chemotherapeutic agents – DNA repair and DNA damage
Copyright Cláudio Alexandre Almeida Pinheiro, FCT/UNL, UNL
IX
This thesis has data or methodologies presented in the following communications in
scientific meetings:
Pinheiro, C., Borba, H., Rueff, J., Silva, S. N. Measuring DNA lesions induced by
XI
Agradecimentos
Este último ano foi um ano de mudanças e de alterações na minha vida. Um ano de aventuras e de descobertas interiores, e ao longo deste ano existiram um conjunto de pessoas que considero que foram fundamentais para a conclusão desta etapa da minha vida.
Gostaria de começar por agradecer ao Professor José Rueff. Obrigado por me ter permitido a entrada no Centro de Toxicogenómica e Saúde Humana e me ter possibilitado a participação neste trabalho. Quero agradecer toda a amabilidade e disponibilidade que sempre mostrou para me ajudar. Obrigado por todos os comentários e por todas as histórias que me brindou ao longo deste ano. É sem sombra de duvidas uma das pessoas mais genuínas que eu tive contacto em toda a minha vida. O meu muito obrigado.
À minha orientadora. À Doutora Susana. A minha segunda “mãe”. Acolheste-me no teu laboratório e na tua vida. Juntos rimos e partilhamos neuras. Vimos um trabalho crescer e ganhar pernas para andar. Posso sinceramente dizer que sem ti nada seria igual. Para mim és mais do que uma mera orientadora, és uma Amiga! Viste que existia mais em mim e nunca duvidaste das minhas capacidades. Estiveste sempre lá para mim e espero conseguir retribuir tanta bondade que me trespassaste ao longo deste ano. A ti o meu mais sincero obrigado e quero que saibas: este trabalho é tanto meu como teu. É nosso!
À Doutora Helena Borba, agradeço a confiança, a sinceridade, a disponibilidade constante e os ensinamentos.
Ao Doutor Michel e ao Doutor Sebastião, toda a amizade e todas as críticas prestadas. Foram certamente fundamentais pois acolheram-me desde o primeiro dia como se um de vós se tratasse. Agradeço toda a disponibilidade e todos os ensinamentos ao longo deste ano, o vosso conhecimento foi importante para a finalização deste trabalho ajudando-me a ultrapassar barreiras que sozinho seriam impossíveis de ultrapassar.
Ao “Doutor” (está quase) Bruno Gomes. Bruno, o que dizer? Foste como um segundo orientador
À Diana Campelo, uma irmã mais velha. Desde o primeiro dia que sempre te preocupaste comigo. Mesmo quando te encontras com a neura nunca te deixas de preocupar e sei que estás sempre lá quando eu precisar. Ensinaste-me muita coisa para além de ensinamentos científicos. Graças a ti sou uma pessoa melhor. Obrigado
Ao Doutor Francisco Esteves. Já nos conhecíamos há mais tempo, mas não tinha tido a oportunidade de disfrutar a tua fantástica companhia. És uma casa cheia. Quando estás no laboratório este fica mais suave. Nada parece difícil e quando se faz com a dedicação que tu fazes
tudo corre bem. Mas quando não…. “repete!”
À Mafalda Pinho e à Renata Soares. O duo do sotaque. Obrigado por todas as palhaçadas e todos os convites. Viram o que de mim havia bom e nunca duvidaram de mim. Sempre me apoiaram até nos dias de pior humor. São duas amigas que quero guardar. À Rita Jerónimo. Acompanhaste-me na minha recta final, mas não foi por isso que deixaste de ser importante. Foste um sorriso constante e a tua felicidade passa para todos à tua volta. Obrigado por seres simples e divertida.
À Mafalda Pinto, the last one standing. Mafalda, apesar parecer que estavas longe nunca estiveste na realidade. Sempre pronta para ajudar e para me apoiar. És alguém em quem eu posso confiar sem pensar duas vezes e és alguém a quem eu posso realmente chamar amiga. Obrigado por tudo
“até ao lar!”. Ao João Serra e ao André Marinho. A vossa ajuda em momentos mais difíceis foi
fulcral para a finalização deste trabalho. Obrigado pelo vosso constante apoio.
A ti “Speedy”, entraste na minha vida e tornaste-te tanto tão depressa. Foste quem me aturou nos
piores momentos e quem me ouviu quando tinha que “gritar”. Ensinaste-me que é possível ser
tudo sendo tão simples. Viste em mim algo que mais ninguém viu. Por todos os momentos e por todos os olhares. Obrigado! Obrigado por seres quem és. Nunca mudes, pois tornas o meu mundo num mundo melhor quando estás nele.
À minha família. A vós dedico este trabalho. São o meu pilar. Quando tudo falha estão lá para me apanhar. Sem vocês nada disto seria possível. Mãe, Pai, Diogo, obrigado! Por tudo que fizeram e irão algum dia fazer. São tudo para mim. Este trabalho é vosso.
XIII
Resumo
Diariamente, as células estão expostas a uma variedade de agentes que podem conduzir a lesões no DNA e a sua acumulação poderá ser um indutor da cancerigénese induzindo a acumulação de mutações que originam erros genéticos. Lesões no DNA podem surgir devido a vários factores externos ou internos às células assim como de ineficiências em processos de reparação de DNA. Os agentes antineoplásicos têm como alvo danificar o DNA e são um dos tipos de terapêutica mais utilizados no tratamento do cancro. A primeira linha de defesa contra as lesões no DNA está atribuída à via de reparação BER.
O objectivo principal deste estudo foi a avaliação do papel da via BER através da avaliação de lesões no DNA induzidas por agentes antineoplásicos. Três genes que actuam na BER foram selecionados e individualmente silenciados em células HeLa: APE1, PARP1 e XRCC1. Estas linhas silenciadas foram expostas, individualmente, a três agentes antineoplásicos diferentes utilizados na terapia do cancro: doxorubicina (DOX); paclitaxel (PAX); e 5-fluorouracilo (5-FU). Seguidamente foi quantificada a lesão induzida por esses agentes através do ensaio do cometa.
Os nossos resultados mostram que, globalmente, as linhas silenciadas quando comparadas com a linha controlo apresentam maior resistência à exposição das drogas, observada pela diminuição de lesão quantificada. Adicionalmente, as lesões provocadas por 5-FU e PAX, medidas em % de DNA na cauda, apresentaram um comportamento semelhante ao obtido para o controlo negativo. No entanto, os efeitos medidos após a exposição a H2O2 demonstraram o contrário, com as linhas silenciadas ao apresentar maior lesão do que a linha controlo, o que pode ser representativo do tipo de lesão associada.
Em conclusão, o impacto do silenciamento de cada gene em testes genotóxicos não ficou totalmente esclarecido sendo que serão necessários futuros testes (e.g. ensaios de apoptose) de maneira a melhor entender o papel dos genes da via BER em lesões induzidas no DNA.
Palavras-chave: Via de reparação BER; Ensaio do cometa; danos no DNA; células HeLa;
XV
Abstract
DNA-damaging chemotherapy is amongst the main kinds of cancer treatment. Conversely, our cells are exposed to a wide variety of factors that may cause DNA lesions which, by themselves, may be precursors of cancer development. Cancer genomes, as a whole, accumulate mutations
(‘driver’ and ‘passenger’ mutations) which may amount to more than 1000 in cancer-associated
genes. These mutations may ensue from a multiplicity of exogenous and endogenous DNA damaging agents, as well as by less proficient DNA repair processes. The first line of cell defense against DNA damage is attributed to BER pathway.
The main aim of this study was evaluate the role of BER pathway through the measure of DNA lesions induced by chemotherapeutic agents. Three genes acting on BER pathway were individually silenced in HeLa cells: PARP1, XRCC1 and APE1. These silenced cell-lines were then exposed individually to three different chemotherapeutic agents used in cancer therapy: doxorubicin (DOX); paclitaxel (PAX); and 5-fluorouracil (5-FU), and the DNA damage induced by these agents was measured by comet assay.
Our results showed that, globally, silenced cell lines were slightly resistant to drugs exposure than wild-type ones. Furthermore, the effect of DNA lesion measured by % DNA in tail induced by 5-FU and PAX was similar to the one reported for negative control in all cell lines. However, the effect measured for H2O2 (Positive Control) exposure was the inverse, the silenced cell lines showed much more lesion that the wild-type, which might be representative of the lesion type.
In conclusion, the impact of each gene silencing on the genotoxicity of individual agents was not fully clear. Additional approaches able to measure other end-points (e.g. apoptosis) are fundamental to better understand the role of BER genes in DNA induced lesion.
Keywords: BER pathway; Comet assay; DNA damage; HeLa cells; DNA repair;
XVII
Table of content
Agradecimentos ... XI
Resumo ... XIII
Abstract ... XV
Table of content ... XVII
Figure Index ... XIX
Table Index ... XXI
List of Abbreviations, genes, proteins and chemicals ... XXIII
1. Introduction ... 1
1.1. Base Excision Repair ... 3
1.1.1. AP endonuclease (APE1) ... 5
1.1.2. Poly(ADP-ribose) polymerase 1 (PARP-1) ... 5
1.1.3. X-ray cross complementing protein 1 (XRCC1)... 6
1.2. Chemotherapeutic agents ... 7
1.2.1. Doxorubicin... 7
1.2.2. Paclitaxel ... 7
1.2.3. 5-Fluorouracil ... 8
1.3. Comet assay ... 8
2. Materials and methods ... 11
2.1. HeLa SilenciX ... 11
2.2. Protein quantification ... 11
2.3. Western Blot ... 11
2.4. Quantitative real time PCR (qRT-PCR) ... 12
2.5. Cell viability assay (MTT assay) ... 14
2.6. Comet assay ... 15
2.7. Statistical analysis ... 16
3. Results ... 17
3.1. Western Blot ... 17
3.2. Quantitative real time PCR (qRT-PCR) ... 17
3.3. MTT assay ... 18
3.4. Comet assay ... 22
4. Discussion ... 28
4.1. Confirmation of silencing by Western Blot ... 28
XVIII
4.3. MTT assays ... 29
4.4. Comet assay ... 29
5. References ... 34
6. Appendix ... 38
6.1. Appendix A ... 38
6.2. Appendix B ... 39
XIX
Figure Index
Figure 1 DNA damage, repair mechanisms and consequences. ... 2
Figure 2: Schematic representation of the BER pathway. ... 4
Figure 3: Confirmation of the silenced genes by western blot. ... 17
Figure 4:Mean relative expressions of the HeLa SilenciX® genes.. ... 18
Figure 5:MTT assays for Doxorubicin after 48h of exposure to the cell lines. ... 20
Figure 6: MTT assays for 5-Fluoruracil after 48h of exposure to the cell lines ... 21
Figure 7: MTT assays for Paclitaxel after 48h of exposure to the cell lines ... 22
Figure 8: Independent comet assays on HeLa SilenciX cell lines.. ... 23
Figure 9: Representative image of each section of a cell after the comet assay. ... 24
Figure 10:Response of individual cell lines to each compound in comet assay after 1-hour of exposure. ... 26
XXI
Table Index
Table 1:Different assays to assess the damage on DNA - ... 10
Table 2: Plate arrangement for qPCR reactions ... 14
MEASURING DNA LESIONS INDUCED BY CHEMOTHERAPEUTIC AGENTS – DNA REPAIR AND DNA DAMAGE
XXIII
List of Abbreviations, genes, proteins and chemicals
All genes names are denoted in accordance with HUGO Gene Nomenclature Committee. All protein names are denoted in accordance with The Universal Protein Resource UniProt.
%DNA head - percentage DNA in head
%DNA tail - percentage DNA in tail
3’OH - 3’-hydroxyl
5’dRP - 5’ deoxyribose phosphate
5-FU – 5-fluorouracil
AIF - Apoptosis-inducing factor
ALS - alkali-labile sites
AP site - abasic site
APE1 – AP endonuclease 1
APE2 – AP endonuclease 2
BER – Base Excision Repair
BSA – Bovine Albumin Serum
DMEM - Dulbecco's Modified Eagle's Medium
DMSO - Dimethyl sulfoxide
DOX – Doxorubicin
DSBs – Double strand breaks
dTMP - Deoxythymidine monophosphate
dUMP - Deoxyuridine monophosphate
EDTA - Ethylenediaminetetraacetic acid
FDA - Food and Drug Administration
FdUTP - Fluorodeoxyuridine triphosphate
FEN1 - Flap endonuclease 1
XXIV FUTP - Fluorouridine triphosphate
GC-MS - Gas chromatography–mass spectrometry
HR – Homologous Recombination
KD - knock down
kDa – kilodaltons
LB - Laemmli buffer
LigIII - DNA ligase III
LMP - low melting point
MTS - 3-(4,5-dimethylthiazol-2-yl)-5-(3-carboxymethoxyphenyl)-2-(4-sulfophenyl)-2H-tetrazolium
MTT - 3-(4,5-dimethylthiazol-2-yl)-2,5-diphenyltetrazolium bromide
NAD+ - Nicotinamide adenine dinucleotide
NC - negative control
NER – Nucleotide Excision Repair
NHEJ – Non-Homologous End Joining
nM – nano molar
NMP - normal melting point
OTM - Olive Tail Moment
PAR - Poly(ADP-ribose)
PARG - Poly(ADP-ribose) glycohydrolase
PARP1 – poly(ADP-ribose) polymerase 1
PAX – Paclitaxel
PBS - Phosphate-buffered saline
PCR - Polymerase chain reaction
PNKP - polynucleotide kinase
MEASURING DNA LESIONS INDUCED BY CHEMOTHERAPEUTIC AGENTS – DNA REPAIR AND DNA DAMAGE
XXV PUA - α,β-unsaturated aldehyde
PVDF - polyvinylidene fluoride membrane
qRT-PCR - Quantitative real time PCR
ROS – Reactive Oxygen Species
rRNA - Ribosomal ribonucleic acid
RT - Room temperature
SBs - Strand breaks
SCGE - Single cell gel electrophoreses assay
SDS - Sodium dodecyl sulfate
SiRNA - Small interfering RNA
SSBs – Single Strand Breaks
TM - Tail moment
TS – Thymidylate synthase
UV – Ultraviolet
WST - Water-soluble Tetrazolium
WT – Wild type
XRCC1 – X-ray cross complementing protein 1
MEASURING DNA LESIONS INDUCED BY CHEMOTHERAPEUTIC AGENTS – DNA REPAIR AND DNA DAMAGE
1
1.
Introduction
Cells are permanently exposed to reactive agents, either chemical or physical, and cellular components are hence permanently damaged and replaced. DNA is the only biological molecule that relies solely on repair of existing molecules, without any resynthesizes. It also can accumulate damage over a lifetime and is uniquely represented by one single copy in most cells. As a target of multiple endogenous and exogenous agents capable of causing DNA lesion it can be said that DNA is the largest molecule capable of accumulating numerous lesions and yet be kept intact (at best in germline and proliferating cells) (Hoeijmakers 2009). The bases in DNA are highly vulnerable to chemical modification, which can cause numerous lesions. This lesions can be converted into mutations by means of defective repair. When this happens their effect and changes are permanent and continually exert their effect on the respective descendant cells. One of the possible consequence of this mutations, besides cell death, is the loss of tumor-suppressor genes and the improper activation of oncogenes, which will trigger an uncontrolled cellular proliferation and the development of malignant cells (Hoeijmakers 2009).
DNA integrity is threatened from three sides. First, as (by)products of our own cell metabolism that generates reactive oxygen (e.g. one of the results of respiration) and nitrogen species, lipid peroxidation products, endogenous alkylating agents, estrogen and cholesterol metabolites and reactive carbonyl species are formed, all of which are able to damage DNA. The second side comes from the spontaneous reactions (of which mostly consist of hydrolysis), intrinsic to the chemical nature of DNA. Hydrolysis of nucleotide residues leave a non-instructive abasic site (AP site) and are capable of causing deaminations. Lastly, the third side is due to the damage caused by exogenous agents. Environmental agents such as the ultraviolet (UV) component of sunlight, and genotoxic agents like cigarette smoke, can cause alterations in the DNA structure, although this damage is somewhat avoidable with the appropriate protections (Hoeijmakers 2009; Hoeijmakers 2001).
2
In order to prevent lesions on the cell’s vital genetic information, a series of different
DNA repair systems are used. Since the problem of DNA damage has existed from the beginning of life it is only natural that the DNA repair systems had arisen at the same time. This explains why all known repair pathways are highly conserved. In mammals exist, at least, four mains (sometimes overlapping) damage repair pathways – Nucleotide Excision Repair (NER), Base Excision Repair (BER), homologous recombination (HR) and non-homologous end joining (NHEJ) (Figure 1).
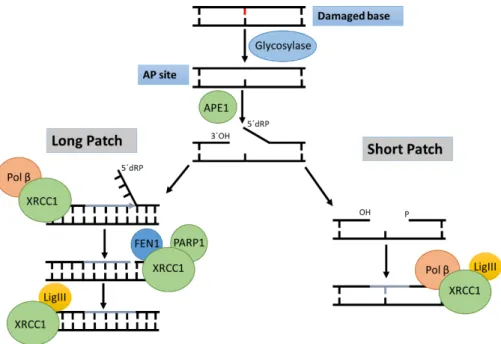
Figure 1 DNA damage, repair mechanisms and consequences.a. General DNA damaging agents
(top); examples of DNA lesions induced by these agents (middle); and DNA mechanism responsible for the removal of the lesions (bottom). b. Critical effects of DNA damage on cell-cycle progression.
Adapted from Hoeijmakers 2001
MEASURING DNA LESIONS INDUCED BY CHEMOTHERAPEUTIC AGENTS – DNA REPAIR AND DNA DAMAGE
3
recombination and non-homologous end joining are designed to repair double strand breaks (DSBs). NHEJ acts during the S and G2 phase of replication, provided that a second copy of the sequence exists, for the aligning of the breaks. NHEJ repair system acts during G1 phase of the cell cycle, and it is used in situations where a second copy of the genetic material is not available as a template (Hoeijmakers 2001).
The focus of this work will be on the Base Excision Repair pathway as a way of understanding the importance of specific proteins involved in this pathway, when the cell DNA is exposed to different chemotherapeutic agents. In this study four independent HeLa cell lines were used. One cell line acted as a control cell line (wild-type), were no alteration was made in the genetic material of the cell. The remaining three cell lines have 3 specific genes silenced. One cell line had the poly(ADP-ribose) polymerase 1 (PARP1) gene silenced, another line had the AP endonuclease (APE1) gene silenced, and the last cell line had the X-ray cross complementing protein 1 (XRCC1) silenced. All of the silenced genes play major roles in the BER pathway, however the importance of each gene in repairing DNA lesions specific to different chemotherapeutic agents is not fully known. The cell lines were thus exposed to three different widely used chemotherapeutic agents: doxorubicin (DOX), 5-fluorouracil (5-FU), and paclitaxel (PAX). These agents are often used as a first line of cancer treatment, making it imperative the measurement of the DNA lesions for a better understanding of how these specific proteins impact the activity of the DNA repair mechanism of the BER pathway.
1.1.
Base Excision Repair
Base excision repair (BER) is a highly conserved pathway from bacteria to humans and is responsible for repairing the vast majority of endogenous DNA damage including deaminations, depurinations, alkylations, oxidations, as well as single-strand breaks (SSBs), a total of about 30,000 per human cell per day (Wallace 2014). The first step in BER is recognition and removal of an altered base in DNA by DNA glycosylases. These enzymes remove the altered base by cleaving the N-glycosyl bond releasing the damaged base, and can either be monofunctional or bifunctional. If the enzyme is monofunctional, an abasic site (or AP site) results. This location in the DNA is characterized by the absence of a purine or a pyrimidine base. The AP sites are recognized by an apurinic endonuclease (APE1) which will cleave the site leaving a nick with a
3’-hydroxyl (3’OH) and 5’ deoxyribose phosphate (5’dRP) termini (Wallace, Murphy, and
Sweasy 2012). The 5’dRp at the nick is removed bythe lyase activity of the DNA polymerase β
(Pol β). DNA Pol β then inserts the missing base, with the resulting nick being sealed by a DNA
-4
unsaturated aldehyde (PUA) or a phosphate group attached to the 3’ end of the break. The PUA
sites are removed by the diesterase activity of APE1 creating a 3’ hydroxyl substrate for Polβ. If
the result is a phosphate group, this one is removed by the phosphatase activity of polynucleotide kinase (PNKP) (Wallace, Murphy, and Sweasy 2012; Wallace 2014).
The BER pathway can follow up to two paths, the short patch or the long patch. In the short patch (also known as single nucleotide BER), the DNA Pol β inserts the missing base, with the resulting nick being sealed by a DNA ligase III (LigIII) complexed to XRCC1 (Figure 2) (Wallace, Murphy, and Sweasy 2012).
In long patch BER a different number of polymerases can take over, including the replicative polymerases. The damage-containing strand is displaced and removed by flap endonuclease 1 (FEN1). This enzyme will remove this flap from the DNA, leaving behind a nick in the DNA. 2-13 nucleotides are removed from the original site of damage, with the nick being sealed by Pol β, resulting in the addition of several nucleotides. XRCC1 and LigIII also seal the
nick (Wallace, Murphy, and Sweasy 2012).The choice of whether repair is accomplished via short or long patch BER is mainly dependent on whether the abasic sugar is oxidized or reduced, as DNA Pol β cannot eliminate a modified sugar. This means that if the 5’ sugar is modified, it is
not removed by Pol β and long patch BER is initiated (figure 2) (Wallace, Murphy, and Sweasy 2012).
MEASURING DNA LESIONS INDUCED BY CHEMOTHERAPEUTIC AGENTS – DNA REPAIR AND DNA DAMAGE
5
1.1.1.
AP endonuclease (APE1)
AP endonucleases (or apurinic/apyrimidinic endonucleases) are enzymes with the role of creating a nick in the phosphodiester backbone of the AP site. In the BER pathway these enzymes have the role of identifying and cleaving the AP site leaving a 3’ OH and a 5’ dRP.When an AP site is created by DNA glycosylase during BER, recruitment of APE1 may displace the DNA glycosylase from the abasic site and then both, recruit DNA Pol β and cleaves the abasic site (Wallace, Murphy, and Sweasy 2012), furthermore it is also known as a redox active enzyme.
In humans there are two AP endonucleases, APE1 and APE2. Human apurinic/apyrimidinic endonuclease 1 (APE1) is a ubiquitous multifunctional protein, a key player in BER pathway (Abbots and Madhusudan, 2010), responsible for the repair of cytotoxic abasic sites. AP endonuclease APE1 (also known as Hap1, Apex and Ref-1) displays the major AP
endonuclease activity in mammalian cells and cleaves the 5’ sugar phosphate backbone of abasic
sites. This enzyme accounts for over 95% of the AP site processing in mammalian cells (Mol, Hosfield, and Tainer 2000).
Four different types of AP endonucleases have been classified according to their sites of incision and their products after cleavage. Class I and class II endonucleases, nick the DNA at the
phosphate groups 3’ and 5’ resulting in a 3’-hydroxyl group and a 5’-deoxyribose phosphate
group. Class III and class IV AP endonucleases also cleave the phosphate groups 3’ and 5’
resulting in a 3’-phosphate and a 5’-OH groups. This way the AP endonucleases present in
humans are classified as class II endonucleases like majority of this enzymes (Marenstein, Wilson, and Teebor 2004).
1.1.2.
Poly(ADP-ribose) polymerase 1 (PARP-1)
Poly(ADP-ribose) polymerases belong to a family of proteins involved in a series of cellular processes from DNA repair to programmed cell death. In this family of enzymes, the most abundant and studied protein is the poly(ADP-ribose) polymerase 1 (PARP-1). PARP1 is an abundant nuclear protein that can function as a molecular nick sensor and is important for genetic stability and for cellular resistance to extracellular or intracellular agents that may disrupt the DNA (Wallace, Murphy, and Sweasy 2012; Amé, Spenlehauer, and de Murcia 2004; Satoh and Lindahl 1992).
6
depletion of cellular NAD+. When PARP-1 binds to sites of SSBs it results in dimerization of the enzyme triggering an elongation and transfer of a long linear or branched chains of poly(ADP-ribose) (PAR) onto various nuclear acceptors (heteromodification). This process may include PARP-1 itself (automodification) at the expense of NAD+. Once a SSB is detected and PARP-1 binds to the DNA it acts as a signal for other DNA-repairing enzymes such as DNA ligase III,
DNA polymerase β and scaffold proteins such as XRCC1. After repairing the DNA damage, the
PAR chains are degraded via Poly(ADP-ribose) glycohydrolase (PARG) and the complex is released. This rapid dissociation of PARP-1 from the breaks is important to allow subsequent access to the break by other DNA repair proteins (Godon et al. 2008).
1.1.3.
X-ray cross complementing protein 1 (XRCC1)
The XRCC1 protein plays a major role in enabling the repair of SSBs and in the BER pathway, due to its ability to interact with multiple core enzymes. XRCC1 acts as a scaffold protein and has no known enzymatic activity of its own, but scaffolding allows these repair enzymes to then carry out their enzymatic steps in repairing DNA. This enzyme is known to
interact with proteins like Pol β, PARP-1, LigIII and APE1 and it has three globular domains
connected by two linker segments of approximately 120 to 150 residues. The N-terminal domain
binds to the DNA polymerase β, the C-terminal domain interacts with Lig III and the central
domain contains a PAR binding motif (Wallace, Murphy, and Sweasy 2012; Caldecott 2003; London 2015). In the BER pathway, XRCC1 attaches to LigIII, where it appears to be required for the stability of cellular LigIII, preventing the degradation by proteosome. Besides preventing degradation XRCC1 also has the function of guiding the DNA ligase to the sites of stranded breakage (Caldecott 2003).
MEASURING DNA LESIONS INDUCED BY CHEMOTHERAPEUTIC AGENTS – DNA REPAIR AND DNA DAMAGE
7
1.2.
Chemotherapeutic agents
1.2.1.
Doxorubicin
Doxorubicin (DOX) is a frontline drug capable of intercalating with base pairs of DNA’s
double helix. It has been used in the treatment of cancer for over 35 years. This nonselective chemotherapeutic agent is a class I anthracycline with aglyconic and sugar moieties. In its unaltered form, DOX is considered to be one of the most potent approved chemotherapeutic drugs. The cellular internalization of this drug is via passive diffusion, and after which it binds to target enzymes such as topoisomerase I and II creating a range of different cytotoxic effects, such as covalent cleavage complexes, leading to apoptosis induction. However, DOX can also intercalate itself in the DNA, inhibiting both DNA and RNA polymerase, resulting in the cessation of DNA replication and RNA transcription. DOX acts by forming a proteasome complex (binding itself to the 20S subunit of the proteasome) and being translocated through the nuclear pore into the nucleus. Once in the nucleus DOX dissociates itself from the proteasome and binds to the DNA. This binding happens due to the higher affinity of DOX to nuclear DNA over the proteasome. It is estimated that one molecule of doxorubicin intercalates with the DNA every fifth base pair. When intercalated in the DNA it leads to a generation of free radicals, such as ROS, resulting in an increase of DNA lesions and consequently cell death. These free radicals are associated with the dangerous side effects of DOX toxicity and unspecific mechanism of action, making the property that makes DOX such a potent anticancer drug, the same that causes the high levels of toxicity associated with this chemotherapeutic agent (Tacar, Sriamornsak, and Dass 2013).
1.2.2.
Paclitaxel
Paclitaxel (PAX) is a taxane extremely important in the treatment of cancer, due to its ability to target tubulin, altering the mitotic spindle function. This alteration disrupts chromosome segregation and inhibits mitotic progression therefore prevents cell division. PAX inhibits the detachment of the microtubules suppressing their dynamic behavior and through this action inhibits mitosis (Ganguly, Yang, and Cabral 2010). Paclitaxel gains access to the microtubules
through diffusion. Once in the microtubule PAX binds to the β-subunit of the tubulin which is on
8
1.2.3.
5-Fluorouracil
5-Fluorouracil (5-FU) is an antimetabolite drug capable of inhibiting essential biosynthetic processes and be incorporated into the DNA and RNA. 5-FU is used in the treatment of a wide range of cancers and its mechanism of action has been associated with the drugs capacity to be misincorporated in macromolecules, such as DNA and RNA, while at the same time inhibiting the nucleotide synthetic enzyme thymidylate synthase (TS). As such 5-FU is considered to be an analogue of the nucleobase uracil, with the exception that this drug contains a fluorine atom at the C-5 position instead of a hydrogen. The cellular internalization of 5-FU is the same transport mechanism as uracil – passive diffusion. When inside 5-FU is converted to several active metabolites such as: fluorodeoxyuridine triphosphate (FdUTP) and fluorouridine triphosphate (FUTP). These metabolites disrupt RNA synthesis and the action of TS.(Longley, Harkin, and Johnston 2003) The action of TS is of extreme importance due to its catalysis activity. TS catalyzes the reduction of deoxyuridine monophosphate (dUMP) to deoxythymidine monophosphate (dTMP). This reaction is responsible for a new source of thymidylate, which is necessary for the replication and repair of the DNA. Furthermore, when metabolite FUTP is incorporated into RNA it results in a high toxicity to RNA metabolism, with the inhibition of the process of maturation of pre-rRNA into rRNA. Misincorporation of 5-FU can also disrupt post-transcriptional modifications of tRNA. This properties of 5-FU make it an important chemotherapeutic agent that has been used over the last 20 years (Longley, Harkin, and Johnston 2003).
1.3.
Comet assay
Human cells are constantly exposed to a series of harmful factors (which have the proficiency of causing DNA damage) create the necessity of a method which is capable of measuring the extension of this damage. This method should be sensitive, rapid, simple, and able to assess the damage in both proliferating as well as non-proliferating cells (Gunasekarana, Raj, and Chand 2015).
MEASURING DNA LESIONS INDUCED BY CHEMOTHERAPEUTIC AGENTS – DNA REPAIR AND DNA DAMAGE
9
such, the amount of protein present will not be representative of the DNA repair activity (Azqueta et al. 2014).
The comet assay (or single cell gel electrophoreses assay - SCGE) differentiates itself for being able to detect low levels of DNA damage and for obtaining results in a relatively short period of time. This assay combines the simplicity of biochemical techniques for detecting DNA single strand breaks (strand break and incomplete excision repair sites), alkali-labile sites, and cross-linking, with the single cell approach typical of cytogenetic assay. The comet assay technique might be use in a wide range of cells, ranging between peripheral blood mononuclear cells to even biopsy tissues. Advantages of this technique are: i) the possibility of cell to cell approach as a result of a single cell electrophoreses; ii) its applicability to a variety of different types of cells; iii) there is no in vitro cultivation step required; iv) it is possible to have an estimation of the global repair capacity after one in vitro challenging experiment; v) it’s very simple, fast and cheap to reproduce; vi) and can give some indications on apoptosis of the cells,
although it doesn’t permit to assess the pathway of apoptosis followed by the cell. Even though
this technique is granted of some limitations such as: the inability of revealing DNA damage caused by small deletions, the uncertainty of if the lesion tested corresponds to the fixed mutations. However, even with these disadvantages the comet assay is a versatile tool of choice to assess the DNA damage and repair efficiency of the damaged cells (Gunasekarana, Raj, and Chand 2015).
The principle behind the comet assay is the movement of negatively charged damaged low molecular weight DNA fragments towards the positive electrode (anode), during the electrophoresis. As a result, a comet-like image appears with the intensity of the tail depending on the frequency of breaks which relax supercoiling, allowing migration of the DNA loops containing the breaks. The head of the comet corresponding to the nucleus (where most of the undamaged DNA is) and the tail of the comet corresponding to the damaged DNA of the cell. In
this study a variant of the comet assay is used. The method used is denominated by “alkaline”
10
Once the electrophoresis is over the cells are stained with an intercalating nucleic acid stain allowing the comets to be captured via fluorescent microscopy. Posteriorly the images captured are analyzed in a separated software, scoring the percentage DNA in the head and percentage DNA in the tail. This results are then grouped and analyzed using a statistical software for a better comprehension of the results obtained.
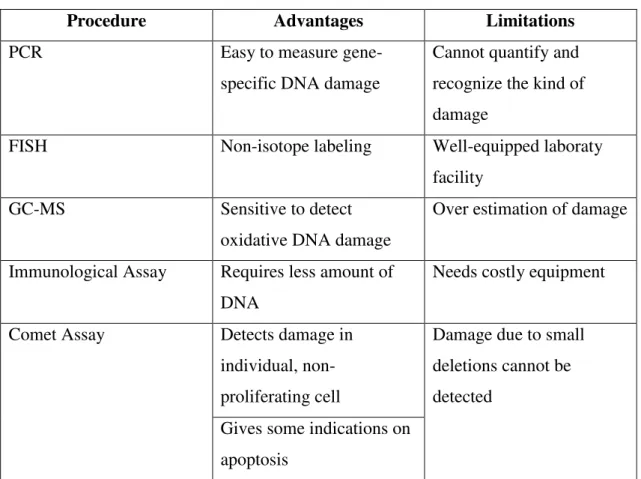
Table 1:Different assays to assess the damage on DNA - Adapted from Gunasekarana et. al 2015
Procedure
Advantages
Limitations
PCR
Easy to measure
gene-specific DNA damage
Cannot quantify and
recognize the kind of
damage
FISH
Non-isotope labeling
Well-equipped laboraty
facility
GC-MS
Sensitive to detect
oxidative DNA damage
Over estimation of damage
Immunological Assay
Requires less amount of
DNA
Needs costly equipment
Comet Assay
Detects damage in
individual,
non-proliferating cell
Damage due to small
deletions cannot be
detected
MEASURING DNA LESIONS INDUCED BY CHEMOTHERAPEUTIC AGENTS – DNA REPAIR AND DNA DAMAGE
11
2.
Materials and methods
2.1.
HeLa SilenciX
HeLa cells were purchased from Tebu-Bio, more explicitly, the Silencix lines. These are cellular models with ready-to-use knock down (KD) that are based on a unique siRNA delivery system. The cell lines bought were the following: Control HeLa SilenciX, PARP1- HeLa SilenciX (97% KD efficiency), XRCC1- HeLa SilenciX (87% KD efficiency) and APE1- HeLa SilenciX (70% KD efficiency). HeLa cells were cultured in DMEM High Glucose (Sigma-Aldrich D6046), 10% fetal bovine serum (FBS; Sigma-Aldrich F7524), 0.25% hygromycin B (Sigma-Aldrich I9278) and 1% penicillin-streptomycin (with 10,000 units penicillin and 10 mg streptomycin per mL) (Sigma-Aldrich P0781). All cell lines were incubated at 37 °C with 5% CO2 in a humidified chamber
2.2.
Protein quantification
Protein quantification was done by Bradford assay using protein assay dye reagent concentrate (Bio-Rad # 500-00006) and bovine serum albumin (BSA) standard (Bio-Rad #500-0206). Standard concentrations of protein (0; 1; 2; 4; 8; 16; 32; 64| µg) were prepared in deionized water to a final volume of 800 µL. Then, 200 µL of protein assay dye reagent concentrate were added. The samples were then loaded in a 96-well plate and read in a plate-reader spectrophotometer at 595 nm. The same procedure was done using the protein extracts and then by linear regression the exact concentration determined.
2.3.
Western Blot
Western Blot is an analytic technique, used in molecular biology to detect specific proteins in a sample or extract. This method utilizes a gel electrophoreses to separate the proteins in the extract. This separation can be accomplished using different characteristics of the proteins, either it being its isoelectric point or molecular weight. The nature of the separation will depend however on the treatment of the sample and the nature of the gel. This methodology separated proteins by molecular weight, and relies on the fact that when placed in the gel and submitted to a voltage the proteins will migrate in the gel accordingly to its molecular weight (in kilodaltons - kDa). This means that smaller proteins migrate faster through the gel and thus separating different proteins according to their size
12
along with a protein ladder (Page Ruler™), using a Hamilton pipet. Afterwards an electrophoreses was performed at 100V (400mA) for 1h30 in running buffer (25mM Tris, 250mM glycine, 0.1% SDS). Gels were equilibrated in transfer buffer 1x (500nM Glycine, 50nM TrisHCl, 0.01% SDS, 20% methanol) for 20 minutes as well as the polyvinylidene fluoride membrane (PVDF). The gel
was transferred to the PVDF membrane in transfer buffer 1x for 1 hour at 100V (400mA) . Membranes were then cut and washed twice in double-distilled water (ddH2O) for 5 min each, and blocked with blocking buffer from WesternDot™ 625 Goat Anti-Mouse Western Blot Kit (# W101132) during 1h at room temperature (RT). Membranes were exposed to an appropriated
primary antibody (Thermo Fisher #13B 8E5C2 / Thermo Fisher #7A10 / Thermo Fisher #33-2-5), for each protein tested and β-actin (Santa Cruz # sc-47778), diluted in wash buffer provided
with the kit (1:1000 in wash buffer) over night at 4˚C. After the primary exposure the membranes were washed with wash buffer five times for 5 minutes and then incubated with secondary antibody (1:1000 in wash buffer) provided with the kit for 1h at RT followed by three washings with wash buffer. To ensure a correct staining, the membranes where submerged with a streptavidin conjugate (1:2000 in blocking buffer) for 1h at RT and followed by 3 successive washes with wash buffer where it remained. The membrane was visualized under ultra-violet light and photographed in a ChemiDoctm Imaging System by Bio Rad.
2.4.
Quantitative real time PCR (qRT-PCR)
In order to confirm the gene silencing of commercial cell lines under study we performed a real-time PCR quantification. To carry out the qRT-PCR several steps should be performed:
1) cells disruption and homogenization; 2) total RNA purification; 3) syntheses of cDNA and 4) qPCR reaction.
1) Cells disruption and homogenization– cells were grown in cell culture flasks and trypsinized
in normal conditions as previously described (section 2.1), the number of cells was determined, followed by two washing steps with cold PBS centrifuge at 500 rpm for 10 minutes each; the next step was disruption of the cells by adding Buffer RLT Plus (Qiagen) in the proportion
recommended in manufacturer’s instructions (350 µl RLT per 1 x 10⁵ cells), the final step was
vortexed the lysate to guarantee a complete homogenization.
2) Total DNA/RNA purification – the lysate obtained in step 1) was used to proceed to RNA
MEASURING DNA LESIONS INDUCED BY CHEMOTHERAPEUTIC AGENTS – DNA REPAIR AND DNA DAMAGE
13
for 15 seconds at ≥10000 rpm, discarding the flow-through. A wash was done by adding 700 μl
of buffer RW1 to the RNeasy spin column and centrifuged for 15 seconds at ≥10000 rpm. The
flow-through was discarded. A second wash with 500 μl of RPE buffer was done, followed by a
centrifugation for 15 seconds at ≥10000 rpm. The flow-through was also discarded. A third wash
with 500 μl of RPE buffer was done, followed by a centrifugation for 2 minutes at ≥10000 rpm.
The flow-through was again discarded. An additional centrifugation at full speed for 1 minute was done to eliminate any possible carryover of Buffer RPE. Next, 30 μl of nuclease-free water
was added directly to the spin column membrane and centrifuged for 1 min at ≥10000 rpm to
elute the RNA. The eluate RNA obtained from previous step was centrifuged once again, at the same speed and time, to increase the RNA yield. This RNA was then stored at -80 °C until further use.
At last, the genomic DNA was purified by adding 500 μl of AW1 buffer to the AllPrep
DNA spin column that was stored before and centrifuged for 15 seconds at ≥10000 rpm. The
flow-through was discarded and 500 μl of AW2 buffer were added to the column and centrifuged for 2 minutes at full speed. After discarding the flow-through, 100 μl of elution buffer was added to the column and incubated for 1 minute at room temperature. Then, the column was centrifuged
for 1 minute at ≥10000 rpm. The genomic DNA was then stored at -80 °C until further use.
All samples were quantified using a NanoDrop™ spectrophotometer.
3) Syntheses of cDNA – The synthesis of cDNA was done using the High Capacity
RNA-to-cDNA kit (ThermoFisher # 4387406). The eluted RNA obtained in step 2) was firstly diluted to the concentration of 1 µg per 20 µl. Each reaction tube was prepared for a final volume of 20 µl, mixing 10 µl of 2x RT Buffer, 1 µl of 20x Enzyme mix, RNA sample volume define according the concentration and nuclease-free water to the final volume. A negative control reaction was also performed, to guarantee that samples used correspond to RNA. For this negative control reaction, all components described above except the Enzyme mix, were mixed together in the same proportion. All samples reaction was incubated for 37 ºC for 60 minutes, the reaction was then stopped by heating to 95 ºC for 5 minutes and cooled to 4 ºC. The cDNA was then stored at -20 ºC until further use. This incubation was performed in a thermal cycler (9700 ABI).
4) qPCR reaction– Using the cDNA of each sample obtained in step 3), was carried out the
14
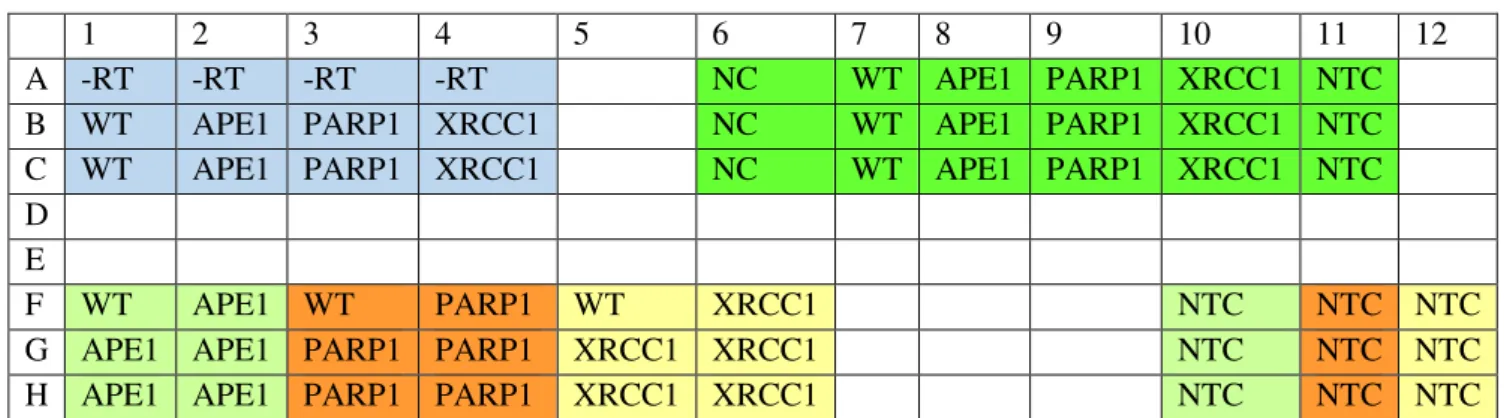
independent experiments. GAPDH was used as endogenous control. The qPCR reactions were performed in a 96 well-plate, and can be seen the arrangement of each plate in the Table below.
Table 2: Plate arrangement for qPCR reactions
NC – Negative Control; WT – Wild-Type HeLa cell line; APE1-– HeLa silenced for APE1 gene; PARP1- - HeLa
silenced for PARP1 gene; XRCC1- – HeLa silenced for XRCC1 gene; NTC – Non template control; -RT – negative
control samples obtained through cDNA synthesis.
2.5.
Cell viability assay (MTT assay)
The MTT assay is colorimetric assay used for assess cell metabolic activity. This assays consist on the reduction of monotetrazolium salts from weakly colored aqueous solutions to brightly colored derivatives know as formazans (Berridge et. al, 2005). MTT 3-(4,5-dimethylthiazol-2-yl)-2,5-diphenyltetrazolium bromide is a monotetrazolium salt that when exposed to metabolic active cells is converted into an insoluble formazan with a purple coloration. Other examples of monotetrazolium salts used in colorimetric assays are: XTT; MTS and WST-1. With MTT and MTS being the most used in this types of assays and with the difference residing in the solubilization of the salts. When monotetrazolium salts enter the cells they are reduced by NAD(P)H-dependent oxireductases and dehydrogenases of metabolic active cells, resulting in a production of formazans that can variate from insoluble (MTT) to water-soluble (MTS) formazans. This allows to established a correlation between the colour intensity of the formazan dye and the number of viable cells. The MTT assay requires the salt to be solubilized before the spectrophotometric analysis, and this step might limit some applications.
Cell viability assay was assessed using the MTT assay. Metabolically active mitochondrial dehydrogenases convert the tetrazolium salt MTT into insoluble purple formazan crystals at a rate that is proportional to cell viability. The cells were trypsinyzed and placed in a 96 well plate, with 6x10³ cells for PARP1-, XRCC1-, and control cell lines and 8x10³ for the APEX cell line. Then they were left to incubate for a period of 24h at the standard conditions (37°C with 5% CO2). The cells were then exposed to six different chemotherapeutic agents for 48h (table 3). After the exposure period the cells were incubated with the MTT diluted in mean at a concentration of 0.5 mg/ml for 3h. At the end of incubation time the MTT was removed and
1 2 3 4 5 6 7 8 9 10 11 12
A -RT -RT -RT -RT NC WT APE1 PARP1 XRCC1 NTC
B WT APE1 PARP1 XRCC1 NC WT APE1 PARP1 XRCC1 NTC
C WT APE1 PARP1 XRCC1 NC WT APE1 PARP1 XRCC1 NTC
D E
F WT APE1 WT PARP1 WT XRCC1 NTC NTC NTC
G APE1 APE1 PARP1 PARP1 XRCC1 XRCC1 NTC NTC NTC
MEASURING DNA LESIONS INDUCED BY CHEMOTHERAPEUTIC AGENTS – DNA REPAIR AND DNA DAMAGE
15
the crystals were dissolved in DMSO obtaining a gradient of purple. The absorbance was determined via a microplate reader at 595nm. This procedure was performed for all cell lines obtaining different cell viability curves.
Table 3: Concentrations tested in the MTT assay for each chemotherapeutic agent. Each cell line was
exposed to the agent during a period of 48h. Afterwards the cells were submerged in the monotetrazolium salt MTT were crystals were formed. These were diluted in DMSO and the plate was read at 595nm in a microplate reader.
2.6.
Comet assay
Single cell gel electrophoreses is a quantitate DNA damage assay able to evaluate DNA damage in individual cells by lysing and embedding them in agarose (Rojas, Lopez, and Valverde 1999). The technique applied on this work uses alkaline electrophoreses (pH>13) and it was first introduced by Singh et al 1998. This version of the assay allows the detection DNA SSBs and alkali labile. A single cell suspension is embedded in low melting point (LMP) agarose in an agar gel sandwich. The cells are submitted to a treatment with a lysis solution that enables the removal of the cell contents except the nuclear material. With the remaining DNA supercoiled the slides are submersed in an alkaline electrophoreses solution which will allow the unwinding of the DNA increasing the display of the DNA damage and also allowing the migration of the damaged DNA
when submitted to an electrical current, giving the cell the appearance of a “comet”.
The Comet assay was performed under alkaline conditions according to the procedures of Singh et al. (1988). HeLa cells were trypsinized and resuspended obtaining a cell suspension of 60000 cells per well. The cells were incubated in a 12 wells plate with DMEM high glucose medium where then they were exposed to a variety of chemotherapeutic agents with different concentrations (Doxorubicin 500-1000nM; Paclitaxel 1nM and 5-fluorouracil 200µM). Non-treated cells were used as a negative control (white) and cells exposed to H2O2 (100µM) were used as a positive control. The exposure time was 1h and afterwards the cells were washed twice, once with fresh culture medium, and the second time with PBS, with centrifugations of 2000rpm for 5 min, between washings. Then, the cells were dissolved in 0.5% low melting point (LMP) agarose, and spread onto a glass microscope slide pre-coated with 1% normal melting point
DOX (nM) PAX (nM) 5-FU (μM)
1 0.01 10
5 0.1 20
10 0.5 50
50 1 75
100 5 100
16
(NMP) agarose. After this step the agarose was allowed to stand for 20min at 4°C. The slides were then left over-night on a cold lysis solution (2.5M NaCl, 10mM Tris, 100mM EDTA, 1% Triton, pH 10) being washed afterwards with fresh water and allowed to stand in the water for 10 min. Then the slides were covered with fresh electrophoresis buffer (10M NaOH, 200mM EDTA, pH > 13) and left there for 20 min allowing DNA unwinding to occur. Electrophoresis was conducted for 20 min at 25V (400mA). Slides were then neutralized (0.4M Tris, pH 7.5), dried with ethanol and stained with GelRed (3x). The cells were observed with a 400x amplification with a fluorescent microscope (Leica DMLB). Approximately 50 cells were randomly selected and analyzed via the CometScore software. The percent of DNA in tail (%Tail DNA) of comets was measured to assess the extent of DNA damage.
2.7.
Statistical analysis
Data was analyzed with GraphPad Prims 5 software. In order to determine if our variables have a Gaussian distribution we performed Kolmogorov-Smirnov test. To determine the equality
of variances we performed Levens’s test. Since our variables violate the assumptions of
MEASURING DNA LESIONS INDUCED BY CHEMOTHERAPEUTIC AGENTS – DNA REPAIR AND DNA DAMAGE
17
3.
Results
3.1.
Western Blot
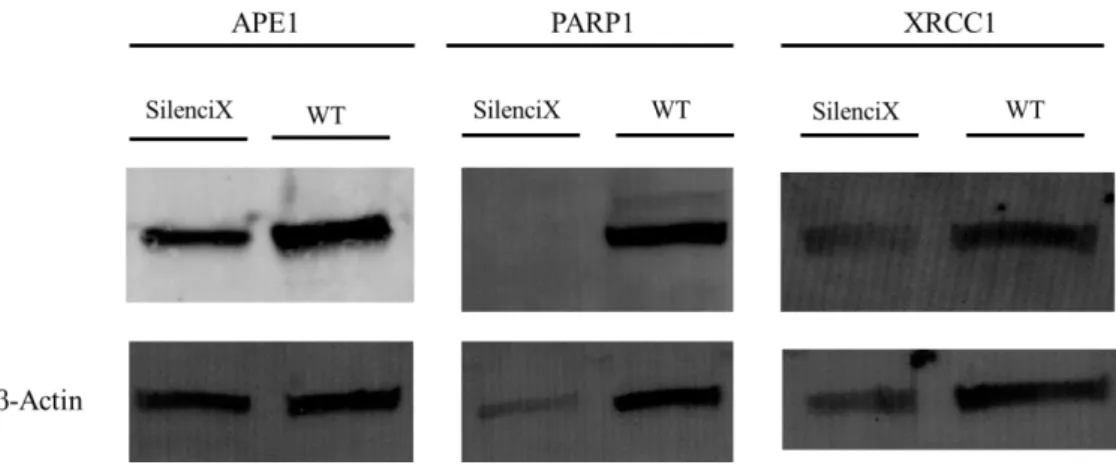
In this work, western blot was used to corroborate the silencing of the cell lines, in order to perform the consequent assays without the uncertainty that the cell lines were indeed silenced for the selected genes. The necessity for this kind of technique provides from the fact that the HeLa SilenciX cell lines are a commercial line and therefore there was a need for a confirmation of the silencing.
As stated previously (section 2.1) every cell line had a different efficiency on the knock down of the expression of the respective genes. Therefore 4 different western blots were performed in order to gauge the silencing of the genes. The first western was a positive control were all the protein extracts of the cell lines were incubated with a primary antibody for β-actin.
β-actin was used due to its a housekeeping characteristic, meaning that the expression of the protein is universal (mainly because of its importance in the maintenance of basic cellular functions). The following westerns aim to confirm the expression of target proteins, therefore three more westerns were performed (Figure 3).
Figure 3: Confirmation of the silenced genes by western blot.
3.2.
Quantitative real time PCR (qRT-PCR)
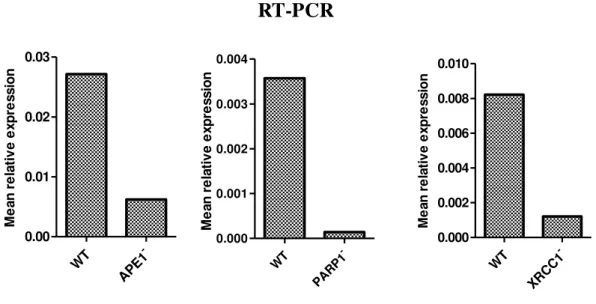
18 WT -APE1 0.00 0.01 0.02 0.03 M e an r e la ti v e e xp re ss io n WT -PARP1 0.000 0.001 0.002 0.003 0.004 M e an r e la ti v e e xp re ss io n WT -XRCC1 0.000 0.002 0.004 0.006 0.008 0.010 M e an r e la ti v e e xp re ss io n
RT-PCR
Figure 4:Mean relative expressions of the HeLa SilenciX® genes. The mean relative expressions where
obtain via 2-ΔCt method. The KD efficiency was confirmed where the cell lines for APE1, PARP1 and
XRCC1 presented a silencing rate of 77%, 96% and 85% respectively.
3.3.
MTT assay
As stated previously, six different concentrations were tested for each one of the three different drugs present in this study (Table 3). Each chemical was tested versus each cell line (total of 4 different cell lines). Every assay had present a negative control (NC) were the cells
weren’t exposed to any concentration of chemical. Since the negative control was not exposed to
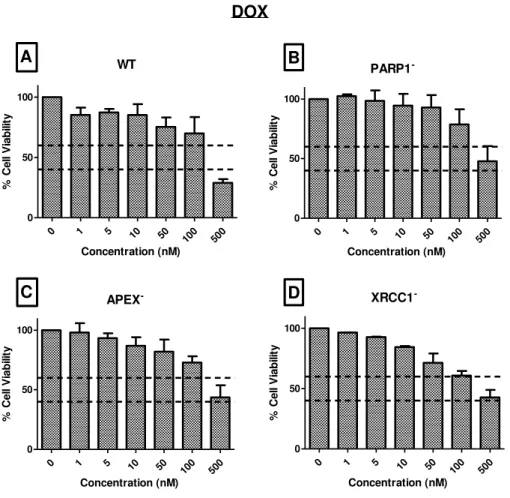
any concentration it was associated with 100% of cell viability (Figure 5, 6 and 7). In MTT assay for DOX (Figure 5) it is possible to observe that although six different concentrations were tested, only one concentration dropped below the 50% viability mark. The objective of this assay was to select the concentration that would reveal a significant number of lesions without obtaining a large percentage of cell death. Only 500nM was seemed to accomplish the objective of this assay. As such, the concentration of 500nM was selected as the concentration to use for the subsequent comet assay methodology. Few results have been published with the same concentration interval that we used (Koo et al. 2015). Additional, the ones that show the same concentration as ours are associated with a higher cell viability but were tested on other cell lines (MCF-7) (Tomankova et al. 2015)
MEASURING DNA LESIONS INDUCED BY CHEMOTHERAPEUTIC AGENTS – DNA REPAIR AND DNA DAMAGE
19
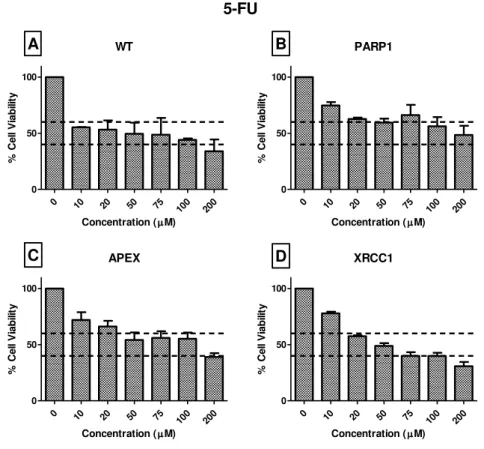
concentration was needed to find a decrease of 50% viability. As such, of all the six different concentrations tested, four were able to get in the range of the objective of 50% cell viability. The possible concentrations were: 50, 75, 100 and 200μM. Only one concentration could be selected to proceed to comet assay, therefore the concentration of 200 μM was chosen since it was the only one that lowered 50% cell viability in the four cell lines. Some results have been published regarding cell viability assay with 5-FU. However, data published until now was not concordant concerning the cell viability related to the concentration of 200 µM in HeLa (Ahmed and Jamil 2011; Kim et al. 2013)
20
WT
0 1 5 10 50
100 500
0 50 100 Concentration (nM) % Ce ll V ia b ili ty PARP1
-0 1 5 10 50
100 500 0 50 100 Concentration (nM) % C el l V ia b ili ty APEX
-0 1 5 10 50
100 500 0 50 100 Concentration (nM) % C el l V ia b ili ty XRCC1
-0 1 5 10 50
100 500
0 50 100 Concentration (nM) % Ce ll V ia b ili ty A B C D DOX
Figure 5:MTT assays for Doxorubicin after 48h of exposure to the cell lines A) HeLa SilenciX WT
cell line; B) HeLa SilenciX PARP1- cell line; C) HeLa SilenciX APE1- cell line; D) HeLa SilenciX XRCC1
MEASURING DNA LESIONS INDUCED BY CHEMOTHERAPEUTIC AGENTS – DNA REPAIR AND DNA DAMAGE
21
WT
0 10 20 50 75
100 200
0 50 100
Concentration (M)
% Ce ll V ia b ili ty PARP1
0 10 20 50 75
100 200
0 50 100
Concentration (M)
% Ce ll V ia b ili ty APEX
0 10 20 50 75
100 200
0 50 100
Concentration (M)
% Ce ll V ia b ili ty XRCC1
0 10 20 50 75
100 200
0 50 100
Concentration (M)
% Ce ll V ia b ili ty 5-FU A B C D
Figure 6: MTT assays for 5-Fluoruracil after 48h of exposure to the cell lines A) HeLa SilenciX WT
cell line; B) HeLa SilenciX PARP1- cell line; C) HeLa SilenciX APE1- cell line; D) HeLa SilenciX XRCC1
22
WT
0
0.01 0.1 0.5 1 5 10
0 50 100 Concentration (nM) % C el l V ia b ili ty PARP1 0
0.01 0.1 0.5 1 5 10
0 50 100 Concentration (nM) % Ce ll V ia b ili ty APEX 0
0.01 0.1 0.5 1 5 10
0 50 100 Concentration (nM) % Ce ll V ia b ili ty XRCC1 0
0.01 0.1 0.5 1 5 10
0 50 100 Concentration (nM) % Ce ll V ia b ili ty PAX A B C D
Figure 7: MTT assays for Paclitaxel after 48h of exposure to the cell lines A) HeLa SilenciX WT cell
line; B) HeLa SilenciX PARP1- cell line; C) HeLa SilenciX APE1- cell line; D) HeLa SilenciX XRCC1
-cell line. After the formation of the formazan crystals these were destroyed and diluted in DMSO enabling a reading of the absorbance at 595nm. Drug concentration of 1nM was chosen as a representative of a rate of cell viability were it would be able to find DNA lesion without verifying to much cell death
3.4.
Comet assay
Comet assay was performed in order to ascertain the importance of the silenced genes in BER pathway, HeLa cell line were exposed to different chemotherapeutic agents for 60 minutes after which was carried-out the procedure to assess the percentage of DNA damage. Unlike the MTT assay the cell lines were only exposed to 1 hour of chemotherapeutic agents due to the fact that if left for 48h the mechanism of DNA repair (possibly aside from BER) would start repairing the DNA lesions caused by the drugs. The chemicals concentration used were determined using the MTT assay (section 3.3) and compared with its counterpart without treatment (no addition of any drug). CometScore software was used to measure the percentage of DNA in the tail of the
MEASURING DNA LESIONS INDUCED BY CHEMOTHERAPEUTIC AGENTS – DNA REPAIR AND DNA DAMAGE
23
Figure 8: Independent comet assays on HeLa SilenciX cell lines.Results obtained after 1h of exposure to: 100μM of H2O2 (Positive Control); 500nM of DOX; 200μM of 5-FU and 1nM of
PAX. The capture of the images was obtained with a Leica DMLB and the quantification of the captures was attained via CometScore software where the %DNA in tail, %DNA in the head; Olive tail moment and tail moment were quantified in order to evaluate the comets.
XRCC1
-APE1
-PARP1
-WT
NC
H
2O
2DOX
5-FU
PAX
Cell line
Chemical
DNA
In
tensi
24
Figure 9: Representative image of each section of a cell after the comet assay.
Tail moment is defined as the product of the tail length and the fraction of total DNA in the tail and can be calculated through this formula (Mozaffarieh et al. 2008):
𝑇𝑀 = 𝑡𝑎𝑖𝑙 𝑙𝑒𝑛𝑔ℎ𝑡 × % 𝑜𝑓 𝐷𝑁𝐴 𝑖𝑛 𝑡ℎ𝑒 𝑡𝑎𝑖𝑙
In addition to the measure of TM the software also calculated the OTM, in which this parameter represents the product of the percentage of total DNA in the tail and the distance between the centers of the mass of the head and tail regions (Mozaffarieh et al. 2008) :
𝑂𝑇𝑀 = (𝑡𝑎𝑖𝑙 𝑚𝑒𝑎𝑛 − ℎ𝑒𝑎𝑑 𝑚𝑒𝑎𝑛) × % 𝑜𝑓 𝐷𝑁𝐴 𝑖𝑛 𝑡ℎ𝑒 𝑡𝑎𝑖𝑙
In order to obtain the best quantification of the assays 50 cells on each slide were chosen at random. Each experience had duplicates with two slides for each chemical. Therefore at least 200 cells were quantified enabling the correct measurement of the comets.
All the data was analyzed using a Kruskal-Wallis test (p value < 0.0001), and a Dunn’s
multiple comparison test to check if the results were statistical significant. Data presented in figure 10, show the results of each drug compared with the respective NC regarding each cell line to attest statistical significance. In order to test the data presented in figure 11 the results of each cell lines, for each drug, were tested versus the WT cell line as a way of determining statistical significance.
In figure 10, the response of individual cell lines to the agents can be observed. In figure 10A the response of the WT cell line for each drug can be observed. Results show that when we compare the mean values of NC with the mean values of the exposed drugs there is a significant variance between each pair. The statistical significance obtained for this results allowed us to understand that each drug per se influence the cell line response. Additionally, Figure 10B shows the response of APE1- cell line after exposure to drugs under study. In this case there was no
MEASURING DNA LESIONS INDUCED BY CHEMOTHERAPEUTIC AGENTS – DNA REPAIR AND DNA DAMAGE
25
difference between NC and PAX measures. Figure 10C and 10D revealed the responses of the PARP1- and XRCC1- cell lines after drugs exposure. The results obtained indicate that when exposed to each drug, both cell lines have a significant increase in %DNA in tail when compared with the NC.
26
WT
-NC 2O2
H DOX 5-FU PAX
0 20 40 60 80 100 * * * * A Drug % D N A in t ai l
APE1
-NC 2O2
H DOX 5-FU PAX
0 20 40 60 80
100 * *
* B Drug % D N A in t ai l PARP1
-NC 2O2
H DOX 5-FU PAX
0 20 40 60 80 100 * * * * C Drug % D N A in t ai l
XRCC1
-NC 2O2
H DOX 5-FU PAX
0 20 40 60 80
100 * *
* * D Drug % D N A in t ai l
Figure 10: Response of individual cell lines to each compound in comet assay after 1-hour of exposure. %DNA in the tail was measured in each captured cells. 50 cells were randomly selected from 2
duplicate slides from 2 independent assays making it a total of 200 cells quantified. Lines represent median with SEM. p. value < 0.05 was considered significant according to non-parametric Dunn’s multiple
MEASURING DNA LESIONS INDUCED BY CHEMOTHERAPEUTIC AGENTS – DNA REPAIR AND DNA DAMAGE
27 H2O2
WT -APE 1 -PAR P1 -XRC C1 0 20 40 60 80
100 * * *
A CELL LINE % D N A in t ai l DOX WT -APE1 -PARP1 -XRCC1 0 20 40 60 80
100 * * *
B CELL LINE % D N A in t ai l NC WT -APE1 -PARP1 -XRCC 1 0 20 40 60 80 100 * * C CELL LINE % D N A in t ai l 5-FU WT -APE1 -PARP1 -XRCC1 0 20 40 60 80 100 * * * D CELL LINE % DN A in t ai l PAX WT -APE1 -PARP1 -XRCC1 0 20 40 60 80 100 * * * E CELL LINE % DNA in t a il
Figure 11:Variances in the %DNA in tail of each cell line after the comet assay with 1-hour exposure to each compound. 50 cells were randomly selected from 2 duplicate slides from 2 independent assays
making it a total of 200 cells quantified. Lines represent median with SEM. p. value < 0.05 was considered significant according to non-parametric Dunn’s multiple comparison test. All multiple comparisons of the