AND DRYING RATES
Flávio Meira Borém1, Eder Pedroza Isquierdo2, Guilherme Euripedes Alves3, Diego Egídio Ribeiro4, Valdiney Cambuy Siqueira5, Jose Henrique da Silva Taveira6 (Received: May 22, 2017; accepted: November 29, 2017)
ABSTRACT: The final quality of coffees depends on the preservation of the cell membranes of the coffee beans, which can be damaged during the drying. Thus, the aim of this study was to assess the immediate and latent effects of the air temperature and drying rate on the sensorial quality of natural coffees, as well as its relationship with the chemical e physiological characteristics of the coffee beans. Mature fruits of arabica coffee were harvested and sundried to moisture content of approximately 35% (wb) and then moved into a mechanical drier under different conditions of drying. This process involved the combination of three dry bulb temperatures – DBT (35°C, 40°C, and 45°C) and two dew point temperatures – DPT (2.6°C and 16.2°C). Thus, the relative humidity of the air used for drying was a dependent variable of DTB and DPT, and as consequences, different drying rates were achieved for each DBT. The increase in the drying rate for the temperatures 35°C and 40°C has a negative effect on the final quality of natural coffee beans. However, for the temperature of 45°C, the effects of the drying rate on the coffee beans are overlaid by the thermal damages that are caused at this level of heating. Higher sensory scores for coffee are linked to lower values of electrical conductivity and potassium leaching of the exudate of the coffee beans, as well as lower values of fatty acids. It is emphasized that while the temperature of 35º C is recommended for the production of specialty coffees the temperature of 45º C is not.
Index terms: Sensory analysis, specialty coffees, relative humidity, dew point temperature.
QUALIDADE DO CAFÉ NATURAL SUBMETIDO A DIFERENTES TEMPERATURAS E TAXAS DE SECAGEM
RESUMO: A qualidade do café depende da preservação das membranas celulares dos grãos, que podem ser afetadas durante a secagem. Assim, este estudo foi realizado com o objetivo de avaliar os efeitos imediatos e latentes da temperatura do ar e da taxa de secagem na qualidade sensorial do café natural e sua relação com as características químicas e fisiológicas dos grãos. Frutos maduros de café arábica foram colhidos e secos ao sol até atingirem a umidade de aproximadamente 35% (b.u.) e então transferidos para um secador mecânico, onde foram submetidos a diferentes condições de secagem, obtidas pela combinação entre três temperaturas de bulbo seco (TBS), 35°C, 40°C e 45°C e duas temperaturas de ponto de orvalho (TPO), 2,6°Ce16,2°C. Assim, a umidade relativa do ar de secagem constituiu-se como uma variável dependente da TBS e da TPO e como consequência da umidade relativa obtiveram-se diferentes taxas de secagem para cada TBS. A análise dos dados indicou que, o aumento na taxa de secagem para as temperaturas de 35°C e 40°C tem efeito negativo na qualidade do café natural. Já para a temperatura de 45ºC, os efeitos da taxa de secagem na qualidade do café natural são sobrepostos pelos danos térmicos que predominam nessa temperatura. Notas sensoriais mais elevadas para o café estão associadas com valores mais baixos de condutividade elétrica, lixiviação de potássio e ácidos graxos. Ressalta-se que enquanto a temperatura de 35ºC é recomendada para a produção de cafés naturais especiais, a temperatura de 45ºC não o é.
Termos para indexação: Análise sensorial, cafés especiais, umidade relativa, temperatura de ponto de orvalho.
1 INTRODUCTION
The quality of the coffee beverage is a fundamental factor to reach the markets that pay the best price for the product, and there is ever increasing demand of the international market for specialty coffees that stand out from common coffees, especially through better beverage quality and complexity (GIOMO; BORÉM, 2011).
1,3,4Universidade Federal de Lavras/UFLA - Departamento de Engenharia/DEG - Cx. P. 3037 - 37.200-000 - Lavras - MG
[email protected],[email protected], [email protected]
2Universidade do Estado de Mato Grosso/UNEMAT - Departamentos de Agronomia - Av. Santos Dumont, s/n - 78.200-000
Cáceres - MT - [email protected]
5Universidade Federal da Grande Dourados/UFGD - Faculdade de Ciências Agrárias/FCA - Cx. P. 533 - 79.804-970 - Dourados - MS
6Universidade Estadual de Goiás/UEG - Av. Protestato Joaquim Boeno, n° 945 - 75.920-000 - Santa Helena de Goiás - GO
Coffee quality is mainly determined by flavor and aroma formed during roasting, based on the chemical compounds present in the green coffee beans. The chemical composition of the beans, for its part, depends on genetic, environmental, and technological factors, such as processing and drying methods (FARAH et al., 2006).
Dry processing of coffee, due to its low water consumption and lower production of polluting
The effects of the drying on the final quality of coffee beans may be observed immediately or long-term after the drying, mainly when assessed after the storage. After the sixth month of storing of coffee beans, a significant quality decrease takes place, characterized by the lowering of the sensorial scores and by the increasing of the values of electrical conductivity and potassium leaching, if compared to the initial values (RIBEIRO et al., 2011).
The aim of this study was to evaluate the immediate and latent effects of the temperature of the air and drying rate on the sensory scores of natural coffee beans and its relationship with the chemical and physiological characteristics.
2 MATERIALS AND METHODS Coffee (Coffea arabica L.) fruits were harvested in the southern region of the state of Minas Gerais, Brazil (Latitude: 21° 27’ 45” S, Longitude: 45° 19’ 17.8” W), in fields of the cultivar Mundo Novo, located at an altitude of 1100 m.
The coffee was harvested manually, selecting only mature fruit. After that, fruits with lower specific weight (dried out, attacked by insects, malformed, etc.) were removed through separation in water, and then one more manual selection was made for removal of under ripe and overripe fruits. The mean initial moisture content of the fruits was 65% (wb) determined in a forced air circulation oven at 105 ± 3°C until achieving constant weight (INSTITUTO ADOLFO LUTZ, 2008).
Immediately after selection, the ripe fruits were dried on a suspended drying bed in fine layers of approximately 3 cm thickness until reaching moisture content of 35% (wb). After that, the fruits underwent intermittent mechanical drying, alternating 14 hours of drying with 10-hour rest intervals.
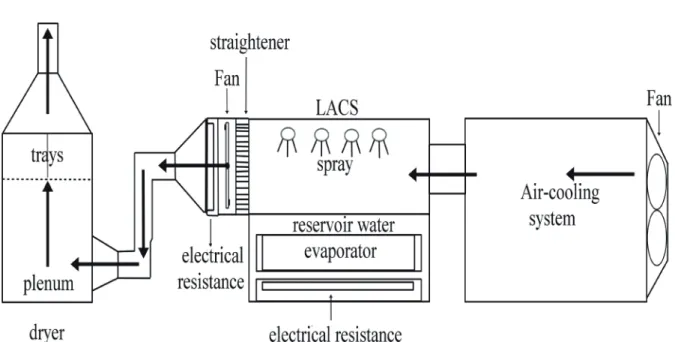
Mechanical drying occurred in the drying system described by Isquierdo et al., (2013) (Figure 1). During mechanical drying, the characteristics of the air were controlled by three air conditioning units in series, coupled to a laboratory air conditioning system (LACS).The speed of the drying air was kept constant at 0.33 ms-1, corresponding to a flow of 20m³min-1m-2of perforated sheet metal. The dew point temperature was measured at the output of the air conditioning system by type K thermocouples connected to universal controllers, Novus Automation N1100. residues, is a more sustainable processing method
in comparison to wet processing (BORÉM; ISQUIERDO; TAVEIRA,2014). However, the literature historically associates dry processed coffees with inferior beverages, compared to wet processed coffees (BORÉM, MARQUES;
ALVES, 2008; SANTOS; CHLFOUN;
PIMENTA, 2009). Nevertheless, when due care is taken during harvest and processing and drying of the fruit, natural coffees give rise to beverages of excellent quality, more full bodied, and with lower acidity in comparison to wet processed coffees, and they are an essential ingredient for blends of espresso coffee(BORÉM, ISQUIERDO; TAVEIRA, 2014;ILLY; VIANI, 2005).
Without a doubt, drying is the key in production of natural specialty coffees since the presence of the hull and the mucilage with high sugar content reduces the drying rate and increases the risks of undesirable fermentations, compromising their quality (BORÉM; ISQUIERDO; TAVEIRA, 2014).
Due to the greater time necessary for drying of natural coffee, normally temperatures of up to 45°C are used in the coffee mass. However, temperatures higher than 40°C bring about serious damage to coffee quality, and they are not recommended for drying of natural specialty coffees (BORÉM et al., 2012; OLIVEIRA et al., 2013).
An alternative for reducing the drying time of natural coffee without the need for use of temperatures higher than 40°C is reduction in the relative humidity of the drying air. That way, thermal damage resulting from the use of high temperatures is avoided (ONDIER;
SIEBENMORGEN; MAUROMOUSTAKOS,
2010). Nevertheless, the isolated effect of the drying rate for the same temperature on the chemical, physiological, and sensory aspects of the coffee is still unknown.
Coffee quality is traditionally evaluated by means of sensory analysis. Yet other analyses, such as determination of electrical conductivity, potassium leaching, reducing and non-reducing sugars, and free fatty acids, among other aspects, can be carried out to assist understanding of physiological changes and changes in chemical composition that occur in coffee during the drying process(CORADI et al., 2007; GUIMARÃES et al., 2002; ISQUIERDO et al., 2012; KLEINWÄCHTER; SELMAR, 2010; MARQUES et al., 2008; SIQUEIRA et al; 2016; SPEER; KÖLING-SPEER, 2006; TAVEIRA et al., 2015).
Relative humidity was measured by a digital hygrometer inserted in the plenum. Coffee fruit temperature was measured by mercury thermometers inserted in the middle of the coffee mass.
The moisture level of coffee fruits during drying was controlled by the gravimetric method. Trays containing the samples were removed from the drier and weighed every two hours on an analytic balance with 0.01 g resolution until the processed coffee beans reached 11±0.5% (wb)moisture. The final moisture content of the processed beans was determined in a laboratory oven at 105°C for 16 hours according to the ISO 6673 standard method (International Organization for Standardization - ISO, 2003). From the results obtained, the drying rates were calculated by equation 1.
in which:
= drying rate (g. kg
-1.h
-1); U
i
= current
moisture content (db); U
i-1=moisture content
in the previous period (db); ∆t = time interval
between weighings (hours).
The immediate and latent effects of
drying were studied, considering the heating
FIGURE 1 - Schematic diagram of the convective dryer used in this study.
of air in the environment as of different
states, representing dry environments (dry bulb temperature – Dbt – equal to 20°C and dew point temperature – Dpt – equal to 2.6°C) and moist environments (Dbt equal to 20°C and Dpt equal to 16.2°C). Under these conditions, relative humidity of the air in the environment would be equal to 30% and 80%, respectively, during the period of coffee harvest.
The drying treatments studied were obtained from the combination between three Dbt (35, 40, and 45 °C) and two Dpt (2.6 and 16.2°C). A completely randomized design was considered in a 3×2 factorial arrangement, with four replications. Thus, the relative humidity of the drying air constituted a dependent variable of the Dpt and the Dbt, and as consequences, different drying rates were achieved for each Dbt.
After drying, the coffee was packed in single-sheet brown Kraft paper bags and polyethylene bags and stored in a controlled climate at 10°C and relative humidity of 50%.
After the sixth month of storage there is a significant drop in coffee quality (RIBEIRO et al., 2011). Thus, to evaluate the immediate effects, coffee samples were analyzed after 1 month of storage and latent effects were evaluated after 7 months of storage.
Coffee quality was evaluated through sensory analysis of the beverage. The following analyses were also performed on the coffee beans for the purpose of understanding the immediate
and latent effects on the quality of the coffee beans: electrical conductivity, potassium leaching, total, reducing, and non-reducing sugars, and free fatty acids, at two different times: at one month and seven months after drying.
Sensory analysis was made by a panel composed of three cupping judges certified by the Specialty Coffee Association of America (SCAA) according to the methodology proposed by Lingle (2011).
Electrical conductivity of the green coffee beans was determined by the methodology proposed by Loeffler, Tekrony and Egli (1988). Four replicates of 50 beans from each plot were used, which were weighed to a precision of 0.001 g, immersed in 75 mL of distilled water in 180 mL plastic cups, and kept in BOD at 25°C for five hours. Electrical conductivity was read on a benchtop conductivity meter BEL W12D,and the results were expressed in μScm-1g-1. After the reading of electrical conductivity, potassium leaching was determined in the solutions. The reading was made on a flame photometer Digimed NK-2002 and the results were expressed in ppm (PRETE; ABRAHÃO, 1995).
Sugars were extracted by the Lane-Enyon method, cited by the Association of Official Analytical Chemists - AOAC (2011) and determined by the Somogy technique, adapted by Nelson (1944).
Free fatty acids were extracted in microcentrifuge tubes containing approximately 65 mg of ground coffee, to which were added 400 ml of a 0.5 N aqueous solution of sodium hydroxide, followed by an ultrasound bath for 10 minutes at 40ºC. After centrifuging at 6200rpm for 30 seconds, a 200 µl aliquot of supernatant was transferred to another microcentrifuge tube. Then, 400 ml of 20% hydrochloric acid, a spatula tip of NaCl, and 600 ml of ethyl acetate were added. After shaking in a vortex for 10 seconds and 5 minutes of rest, a 300 ml aliquot of the organic layer was removed, placed in microcentrifuge tubes, and dried by evaporation, thus obtaining the free fatty acids.
The free fatty acids were methylated with 100 µl BF3 methanol (14%) containing 1.0 mgml -1of methyl laurate (C12:0) used as an internal standard (Christie, 1989). The tube was then heated for 10 minutes in a water bath at 80ºC and then analyzed by Gas Chromatography.
Analyses were made in a gas chromatographHP5890 equipped with a flame
ionization detector. An HP-INNoWax (HP) column of 15 m x 0.25 mm was used, with a 120ºC to 220ºC temperature gradient with a heating rate of 10ºCmin-1,an injector (1/50 split) at 230ºC, and detector at 230ºC. Hydrogen was used as a carrier gas (2 mlmin-1) and an injection volume of 1 ml. Peaks were identified by comparison with standardsof SUPELCO 37 fatty acid methyl esters.
The set of data obtained from the sensory, chemical and physiological analyses was examined by principal component analysis (PCA). The PCA routines were carried out using the Chemoface 1.4 software (NUNES et al., 2012). Furthermore, to study the effect of the treatments on the sensory quality of coffee, the data obtained in sensory analysis were subjected to analysis of variance, and when significant differences were observed, the mean values were compared by the Scott-Knott test at 5% significance.
3 RESULTS AND DISCUSSION
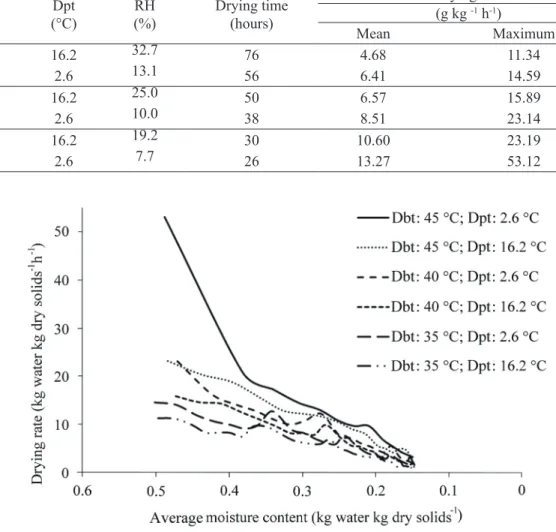
Mean and maximum drying times and drying rates as a function of Dbt and Dpt of the drying air are shown in Table 1.
The response of drying rates as a function of Dbt and Dpt of the drying air throughout the drying process is shown in Figure 2.
An increase in the mean and maximum drying rates and reduction in drying time as a result of reduction in Dpt for the same Dbt and as a result of an increase in Dbt can be observed in Table 1 and in Figure 2.
The maximum drying rate occurs at the beginning of the process when the moisture content of the fruits is higher. In this period, the effect of Dpton the drying rate is more evident. At the end of drying, when the coffees have lower moisture contents, differences among the drying rates as a function of Dpt are not seen, indicated by the overlapping of the curves (Figure 2). In regard to Dbt, although the differences are smaller, it can still be observed that higher temperatures lead to higher drying rates. The peaks of the drying rate observed during the process occur at the resumption of drying soon after the 10-hour rest period. This occurs because with the evolution of the drying process, moisture gradients are formed within the fruits, and the moisture deeper within is higher than the surface moisture. These gradients will be increasingly greater the drier the fruits are in continuous processes of dehydration (Isquierdo et al., 2011). During rest, the migration of water from the inside of the fruits to the surface occurs, increasing the drying rates upon resuming the process.
Table 2 shows the mean results of sensory analyses (Score), electrical conductivity (EC), potassium leaching (PL), total sugars (TS), reducing sugars (RS), non-reducing sugars (NRS), and total free fatty acids (FFA) of coffee carried out as a function of Dbt and Dpt considering two different times: one month and seven months after drying.
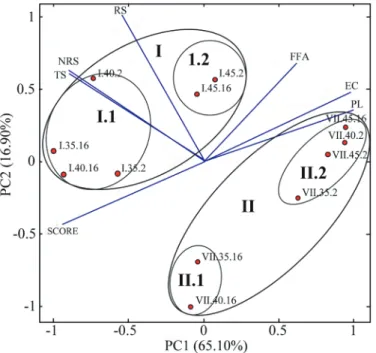
For the purpose of interpreting the effects of temperature and relative humidity on sensory quality and on the chemical and physiological aspects of coffee, principal component analysis (PCA) was used, generating a biplot (Figure 3) as a result of the values obtained in these analyses. In this analysis, it can be observed that the two principal components are responsible for 82% of the total variance due to the treatments, with 65.10% of the variability explained by the first principal component and 16.9% by the second.
TABLE 1 - Mean and maximum drying time and drying rate of natural coffee as a function of Dbt and Dpt of the drying air.
Dbt
(°C) (°C)Dpt (%)RH Drying time(hours)
Drying rate (g kg -1 h-1) Mean Maximum 35 16.2 32.7 76 4.68 11.34 35 2.6 13.1 56 6.41 14.59 40 16.2 25.0 50 6.57 15.89 40 2.6 10.0 38 8.51 23.14 45 16.2 19.2 30 10.60 23.19 45 2.6 7.7 26 13.27 53.12
FIGURE 2 - Drying rate of coffee fruits as a function of the Dbt and Dpt of the drying air.
Analyzing the PCA, the formation of two distinct groups can be seen according to the second PC2 axis. Group I is composed of the coffees analyzed after one month of storage and group 2 by coffees analyzed after seven months of storage. The main characteristic that contributed to the separation of these groups was the sugar content (total, reducing, and non-reducing). The coffees of group I show higher sugar contents in relation to the coffees of group II (Table 2). This result is in agreement with Ribeiro et al. (2011) and Selmar et al. (2008), who affirm that reduction in the sugar contents is directly related to the respiratory activity of the beans during storage.
Within group I, the formation of two distinct groups is observed. GroupI.1, with the points lying to the left of the biplot (I.35.16, I.35.2, I.40.16,and I.40.2)is composed of the coffees dried at 35 and 40 °C, regardless of the Dpt,which exhibited the highest scores in sensory analyses.
TABLE 2 - Mean values of the analyses of Score, CE, PL, TS, RS, NRS, and FFAof coffee as a function of Dbt and Dpt. Treatments Score (μScmEC-1g-1) (ppm)PL (%)TS (%)RS NRS(%) FFA(%) Storage (month) (°C)Dbt (°C)Dpt 1 35 16.2 83.94 53.37 16.88 7.78 0.548 7.05 1.634 1 35 2.6 80.83 61.77 19.11 7.85 0.428 7.19 1.286 1 40 16.2 82.69 56.74 17.96 8.17 0.443 7.49 1.379 1 40 2.6 82.06 60.62 18.11 7.58 0.657 6.79 1.738 1 45 16.2 79.25 78.61 20.71 7.34 0.535 6.64 1.618 1 45 2.6 79.06 76.4 23.16 7.54 0.475 6.87 1.819 7 35 16.2 81.79 62.12 18.63 6.45 0.384 5.76 1.699 7 35 2.6 78.79 77.75 24.53 6.37 0.381 5.69 1.656 7 40 16.2 81.75 62.92 19.07 6.24 0.385 5.56 1.203 7 40 2.6 78.83 81.36 24.68 6.28 0.359 5.62 2.474 7 45 16.2 78.67 85.71 26.27 6.21 0.435 5.52 1.990 7 45 2.6 77.5 85.22 25.74 6.25 0.469 5.39 1.606 Overall mean 80.43 70.21 21.24 7.00 0.458 6.30 1.675 CV 1.96 7.84 10.64 15.62 19.09 16.20 28.04 F 6.5628** 18.0489** 9.0961** 2.172* 3.927** 2.244* 1.5255ns
**Significantat 1% by the F test; *Significant at 5% by the F test; nsNot significant.
FIGURE 3 - Biplot of the two first axes of principal component analysis for data from three Dbt (35, 40, and 45), two Dpt (2, 16) and two times of analysis (I –one month after drying and VII – seven months after drying) according to the values of sensory analyses (Score), electrical conductivity (EC), potassium leaching (PL), total sugars (TS), reducing sugars (RS), non-reducing sugars (NRS), and total free fatty acids (FFA).
Group I.2, for its part, with points lying in the center of the biplot (I.45.16 and I.45.2),is composed of coffees subjected to a drying temperature of 45°C,and they exhibited the highest values of electrical conductivity and potassium leaching and higher contents of free fatty acids.
Within group II, composed by the coffees analyzed after seven months of storage, the formation of two distinct groups is observed. Group II.1, with points lying in the center of the biplot (VII.35.16 and VII.40.16), exhibiting higher scores in sensory analysis and group II.2, with points lying at the right of the biplot (VII.35.2, VII.40.2, VII.45.16,and VII.45.2), exhibiting higher values of electrical conductivity, potassium leaching, and free fatty acid content.
The results shown in Figure 3 confirm the inverse relation existing between the sensory quality of coffee and the values of electrical conductivity, potassium leaching, and free fatty acid contents, which is in agreement with various studies that showed similar results (CORADI et al., 2007; ISQUIERDO et al., 2011; MARQUES et al., 2008).
The analyses of electrical conductivity and potassium leaching indicate the integrity of the cell membrane system of the coffee beans. Beans that were damaged due to high drying temperatures or by deteriorations that occurred during storage show higher values when undergoing these analyses (BORÉMet al., 2014). Deterioration by drying or during storage can also be indicated by an increase in the free fatty acid content, which is one of the first modifications associated with coffee bean deterioration (SPEER; KÖLING-SPEER, 2006).
Furthermore, it can be observed in Figure 3 that the coffees that obtained the highest scores in sensory analysis and the lowest values of electrical conductivity, potassium leaching, and fatty acid contents were the coffees dried at temperatures of 35 and 40 °C, regardless of the Dpt,and analyzed one month after drying.
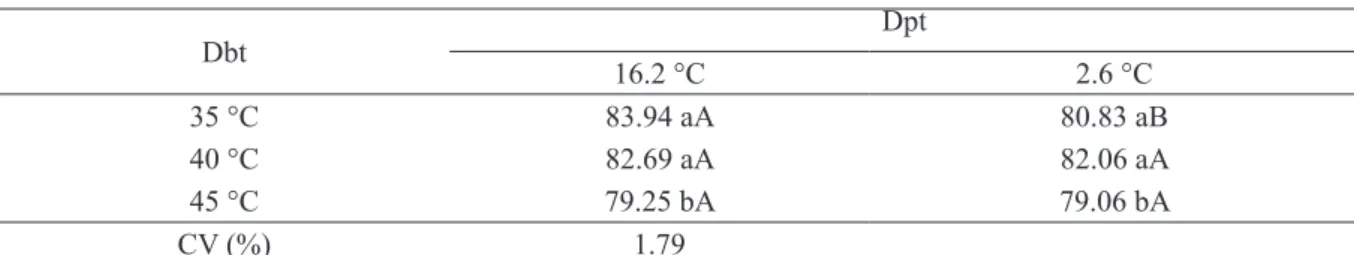
The effects of Dbt and Dpt on the sensory analysis of natural coffee carried out one month and seven months after drying are shown in Tables 3 and 4, respectively.
When sensory analysis was carried out one month after drying (Table 3), it can be observed that, regardless of the Dpt, the coffees dried at 45°C show lower scores compared to coffees dried at 35 and 40 °C. In regard to Dpt, it can be observed that only within the Dbt of 35°C does it have a significant effect on coffee quality, such that the higher the Dpt, and consequently higher relative humidity and lower drying rate, the higher the score obtained by natural coffee.
When sensory analysis was carried out after seven months of storage, the effect of Dbt within the Dpt of 16.2°C (greater relative humidity)is the same observed after one month of storage, that is, the coffees dried at 45°C have significantly lower scores compared to coffees dried at 35 and 40 °C. Nevertheless, within the Dpt of 2.6°C, an abrupt decline in the scores was observed after storage for all the Dbt, and the coffees did not show significant differences among themselves. The effect of Dpt is observed for the Dbt of 35 and 40 °C, such that the greater the Dpt, and consequently greater relative humidity and lower drying rate, the greater the score obtained by natural coffee.
The results of this study confirm the negative effects of high temperatures on the quality of natural coffee, which are in agreement with Oliveira et al. (2013), who affirmed that drying temperatures higher than 40°C are not appropriate for the production of natural specialty coffees. All the coffees dried at 45°C obtained scores lower than 80 points by the SCAA methodology, and are not considered specialty coffees.
In regard to the effects of Dpt and relative humidity, it was observed that when they are reduced, there is an increase in the drying rate, and this increase is more evident for the lower Dbt and in the first hours of drying, when the water content of the coffee is higher. In regard to the effect of drying rate on coffee quality, results indicate that an increase in the drying rate negatively affects the quality of natural coffee, and its effect depends on the temperature. For the temperature of 35°C, the negative effects of the drying rate on coffee quality are evident, both for one month and for seven months after drying. For the temperature of 40°C, it is not possible to observe the immediate effect of the drying rate; however, after seven months of storage, it can be seen that the higher drying rates are associated with lower scores in sensory analysis, showing its latent negative effect on the quality of natural coffee. As for the temperature of 45°C,the effects of thermal damage caused by this temperature predominate, making the effect of the drying rate not very evident.
In general, it was observed that high drying rates are harmful to coffee quality, especially when low temperatures are used. Rapid dehydration of coffee causes damage to the cell structure of the endosperm, triggering a series of chemical and biochemical reactions that negatively affect the sensory quality of the beverage.
TABLE 3 - Mean scores obtained in sensory analysis of natural coffee carried out one month after drying as a function of Dbt and Dpt. Dbt Dpt 16.2 °C 2.6 °C 35 °C 83.94 aA 80.83 aB 40 °C 82.69 aA 82.06 aA 45 °C 79.25 bA 79.06 bA CV (%) 1.79
Means followed by the same lowercase letters in the column and by the same uppercase letters in the line belongs to the same cluster (P>0.05) by the Scott-Knott test.
TABLE 4 - Mean scores obtained in sensory analysis of natural coffee carried out seven months after drying as a function of Dbt and Dpt. Dbt 16.2 °C Dpt 2.6 °C 35 °C 81.79 aA 78.79 aB 40 °C 81.75 aA 78.83 aB 45 °C 78.67 bA 77.50 aA CV (%) 1.98
Means followed by the same lowercase letters in the column and by the same uppercase letters in the line belongs to the same cluster (P>0.05) by the Scott-Knott test.
4 CONCLUSIONS
Dry bulb temperatures higher than 40°C are not recommended for drying of natural specialty coffees.
For the drying temperature set at 35°C, the increasing of the drying rate causes a decreasing in the sensory quality of natural coffee.
For the drying temperature of 45°C, the lowering of the quality of natural coffee is explained by thermal damage and the effect of the drying rate is not evident.
Higher scores in sensory analysis of coffee are associated with lower values of electrical conductivity, potassium leaching, and free fatty acid contents.
5 ACKNOWLEDGEMENTS
The authors are grateful to the Conselho Nacional de Desenvolvimento Científico e Tecnológico (CNPq), the Fundação de Amparo à Pesquisa do Estado de Minas Gerais (FAPEMIG), the Coordenação de Aperfeiçoamento de Pessoal de Nível Superior (CAPES) and the Instituto Nacional de Ciência e Tecnologia do Café (INCT/Café).
6 REFERENCES
ASSOCIATION OF OFFICIAL ANALYTICAL CHEMISTS. Official methods of analysis of the Association of Official Analytical Chemists. Washington, 2011. 1018 p.
BORÉM, F. M. et al.Effect of intermittent drying and storage on parchment coffee quality. Bioscience Journal, Uberlândia, v. 30, n. 2, p. 609-616, Oct. 2014. BORÉM, F. M.; ISQUIERDO, E. P.; TAVEIRA, J. H. S. Coffee processing. In: BORÉM, F. M. Handbook of coffee post-harvest technology. Norcross, Georgia: Gin Press, 2014. p. 49-68.
BORÉM, F.M. et al. Microscopia eletrônica de varredura de grãos de café submetidos a diferentes formas de processamento e secagem. Coffee Science, Lavras, v. 7, n. 3, p. 211-219, set./dez. 2012.
BORÉM, F. M.; MARQUES, E. R.; ALVES, E. Ultrastructural analysis damage in parchment Arabica coffee endosperm cells. Biosystems Engineering, London, v. 99, n. 1, p. 62-66, Mar. 2008.
CHRISTIE, W. W. Gas chromatography and lipids, a practical guide.Ayr: The Oily, 1989. 184 p.
CORADI, P. C. et al. Effect of drying and storage conditions on the quality of natural and washed coffee. Coffee Science, Lavras, v. 2, n. 1, p. 38-47, jan/jun. 2007. FARAH, A. et al. Correlation between cup quality and chemical attributes of Brazilian coffee. Food Chemistry, Oxford, v. 98, n. 2, p. 373-380, Apr. 2006. GIOMO, G. S.; BORÉM, F. M. Cafés especiais no Brasil: opção pela qualidade. Informe Agropecuário, Belo Horizonte, v. 32, n. 261, p. 7-16, mar/abr. 2011. GUIMARÃES, R. M. et al. Tolerância à dessecação em sementes de cafeeiro (Coffea arábica L.). Ciência e Agrotecnologia, Lavras, v. 26, n. 1, p. 128-139, jan/fev. 2002. ILLY, A.; VIANI, R. Espresso coffee: the chemistry of quality. London: Academic Press, 2005. 398 p.
INSTITUTO ADOLFO LUTZ – IAL. 012/IV: perda por dessecação (umidade): secagem direta em estufa a 105 °C. São Paulo, 2008. 1020 p.
INTERNATIONAL ORGANIZATION FOR
STANDARDIZATION. Green coffee: determination of loss in mass at 105ºC: ISO 6673. Geneva, 2003. 17 p. ISQUIERDO, E. P.et al.Drying kinetics and quality of natural coffee. Transactions of the ASABE,v. 56, n.3, p.1003-1010, 2013.
ISQUIERDO, E.P. et al.Quality of natural coffee subjected to different rest periods during the drying process. Ciência e Agrotecnologia, Lavras, v. 36, n. 4, p. 439-445, jul/ago. 2012.
ISQUIERDO, E. P. et al. Qualidade do café cereja desmucilado submetido ao parcelamento da secagem. Coffee Science,v. 6, n. 1, p. 83-90, jan/abr. 2011. KLEINWÄCHTER, M.; SELMAR, D. Influence of drying on the content of sugars in wet processed green Arabica coffees. Food Chemistry, v.119, n. 2, p. 500– 504, Mar. 2010.
LINGLE, T. R. The coffee cupper’s handbook: systematic guide to the sensory evaluation of coffee’s flavor. 4th ed. Long Beach, California: Specialty Coffee Association of America, 2011. 66 p.
LOEFFLER, T. M.; TEKRONY, D. M.; EGLI, D. B. The bulk conductivity test as an indicator of soybean quality. Journal of Seed Technology, Lansing, v. 12, n. 1, p. 37-53, Mar. 1988.
MARQUES, E. R. et al. Eficácia do teste de acidez graxa na avaliação da qualidade do café arábica (Coffea arabica L.) submetidos a diferentes períodos de temperatura e pré-secagem. Ciência e Agrotecnologia,Lavras, v. 32, n. 5, p. 1557-1562, set/out. 2008.
NELSON, N. A photometric adaptation of Somogy method for the determination of glucose. Journal of Biological Chemists,Baltimore, v. 153, n. 1, p. 75-84, Apr. 1944.
NUNES, C.A. et al. Chemoface: a novel free user-friendly interface for Chemometrics. Journal of the Brazilian Chemical Society, São Paulo, v.23, n.11, p. 2003-2010, Nov. 2012.
OLIVEIRA, P.D. et al. Aspectos fisiológicos de grãos de café, submetidos a diferentes tipos de processamento e métodos de secagem, associados à qualidade da bebida. Coffee Science, Lavras, v. 8, n. 2, p. 211-220, abr/jun. 2013. ONDIER, G. O.; SIEBENMORGEN, T. J.; MAUROMOUSTAKOS, A. Low-temperature, low-relative humidity drying of rough rice. Journal of Food Engineering, Essex, v. 100, n. 3, p. 545-550, Oct. 2010.
PRETE, C.E.C.; ABRAHÃO, J.T.M. Condutividade elétrica dos exsudatos de grãos de café (Coffea arabica L.). Semina: Ciências Agrárias,Londrina, v.21, n.1, p. 67-70, mar. 2000.
RIBEIRO, F.C. et al. Storage of green coffee in hermetic packaging injected with CO2. Journal of Stored Products Research, v. 47, n. 4, p. 341-348, Oct. 2011.
SANTOS, M. A.; CHALFOUN, S. M.; PIMENTA, C. J. Influência do processamento por via úmida e tipos de secagem sobre a composição, físico química e química do café (Coffea arabica L). Ciência e Agrotecnologia, Lavras,v.33, n.1, p.213-218, jan/fev. 2009.
SELMAR, D., BYTOF, G., KNOPP, S.E. The storage of green coffee (Coffea arabica): decrease of viability and changes of potential aroma precursors. Annals of Botany, Exeter, v. 101, n. 1, p. 31-38, Jan. 2008. SIQUEIRA, V.C. et al. Drying of hulled naturally processed coffee with high moisture content and its impacts on quality. African Journal of Agricultural Research, Lagos, v. 11, n. 31,p. 2903-2911, Jul. 2016. SPEER, K.; KÖLLING-SPEER, I. The lipid fraction of the coffee bean. Brazilian Journal of Plant Physiology, Piracicaba, v. 18, n. 1, p. 201-216, Jan/ Mar. 2006.
TAVEIRA, J.H.S. et al. Post-harvest effects on beverage quality and physiological performance of coffee beans. African Journal of Agricultural Research, Lagos, v. 10, n. 12, p. 1457-1466, Mar. 2015.