Keeping it simple: flowering plants tend to retain, and revert to,
simple leaves
R. Geeta
1,2, Liliana M. Da´valos
9, Andre´ Levy
3, Lynn Bohs
4*, Mathew Lavin
5*, Klaus Mummenhoff
6*, Neelima
Sinha
7*and Martin F. Wojciechowski
8*1
State University of New York, Stony Brook, NY 11794-5245, USA;2University of Delhi, Delhi 110009, India;3Unidade de Investigac¸a˜o em Eco-Etologia, Instituto Superior de Psicologia Aplicada, Lisbon, Portugal;4Department of Biology, 257 South 1400 East, University of Utah, Salt Lake City, UT 84112, USA;5Department of Plant Science and Plant Pathology, 119 ABS, Montana State University, Bozeman, MT 59717, USA;6Botanik, Fachbereich Biologie, Universita¨t Osnabru¨ck, Barbarastr. 11, D-49076 Osnabru¨ck, Germany;7Section of Plant Biology, University of California, Davis, CA 95616, USA;8School of Life Sciences, Arizona State University, Tempe, AZ 85287-4501, USA;9Consortium for Inter-Disciplinary Environmental Research, School of Marine and Atmospheric Sciences, 129 Dana Hall, Stony Brook University, Stony Brook, NY 11794-5000, USA
Author for correspondence: R. Geeta Tel: +91 11 2766 7573 Email: [email protected] Received: 10 June 2011 Accepted: 23 September 2011 New Phytologist (2012)193: 481–493 doi: 10.1111/j.1469-8137.2011.03951.x
Key words: angiosperm, character, complex leaves, development, rate of evolution, reversal, simple leaves, stasis.
Summary
• A wide range of factors (developmental, physiological, ecological) with unpredictable inter-actions control variation in leaf form. Here, we examined the distribution of leaf morphologies (simple and complex forms) across angiosperms in a phylogenetic context to detect patterns in the directions of changes in leaf shape.
• Seven datasets (diverse angiosperms and six nested clades, Sapindales, Apiales, Papavera-ceae, FabaPapavera-ceae, Lepidium, Solanum) were analysed using maximum likelihood and parsimony methods to estimate asymmetries in rates of change among character states.
• Simple leaves are most frequent among angiosperm lineages today, were inferred to be ancestral in angiosperms and tended to be retained in evolution (stasis). Complex leaves slowly originated (‘gains’) and quickly reverted to simple leaves (‘losses’) multiple times, with a significantly greater rate of losses than gains. Lobed leaves may be a labile intermediate step between different forms. The nested clades showed mixed trends; Solanum, like the angio-sperms in general, had higher rates of losses than gains, but the other clades had higher rates of gains than losses.
• The angiosperm-wide pattern could be taken as a null model to test leaf evolution patterns in particular clades, in which patterns of variation suggest clade-specific processes that have yet to be investigated fully.
Introduction
Leaf form in angiosperms varies from simple (unlobed and lobed) to complex (deeply divided or dissected, and compound). This variation is controlled by developmental and functional (physio-logical and eco(physio-logical) factors. Unlike simple unlobed leaves, lobed and complex leaves undergo differential marginal growth, which is governed by the activity of KNOX proteins (Hagemann & Gleissberg, 1996; Efroni et al., 2010). The repeated evolution of complex leaves appears to be accompanied by the turning on of KNOX expression in leaf primordia (Bharathan et al., 2002; Hay & Tsiantis, 2006; Piazza et al., 2010). Lobed and complex leaves may possess physiological properties (e.g. increased bound-ary layer conductance preventing temperature extremes) that are beneficial under specific environments (e.g. under warm, dry conditions). However, there may be multiple optimal ‘solutions’
for a single set of environmental conditions in a given location, and the particular leaf forms present will depend on local ecological history (e.g. Givnish, 1987; Gurevitch & Schuepp, 1990; Niklas, 1994; Marks & Lechowicz, 2006). These studies suggest that complex leaves evolve readily and, without functional factors to favour particular leaf forms, we do not expect biases in the evolution of leaf form. However, a previous phylogenetic analysis of leaf shape variation in angiosperms showed that com-plex leaves arise from simple leaves (‘gains’) more often than the reverse (‘losses’) (Bharathan et al., 2002). This study did not investigate whether the numbers of gains and losses translated into higher rates of one type of change over the other, introduc-ing a bias towards the origin of complex leaves in angiosperms.
Here, we examine this hypothesis of unequal rates of change in leaf form, specifically that the rate of gains of complex leaves is greater than the rate of losses, assuming no developmental or physiological ⁄ ecological biases. We analyse the phylogenetic patterns of leaf shape variation employing several coding schemes and maximum likelihood (ML) methods, in addition to the
limited ‘simple’ and ‘complex’ coding and parsimony methods used by Bharathan et al. (2002). ML methods have the advantage that they take into account branch lengths and opportunities for change when estimating relative rates of change (Sanderson, 1993). We analysed seven datasets: one broadly sampling all major angiosperm lineages and six focusing on different nested clades of the angiosperms.
Materials and Methods
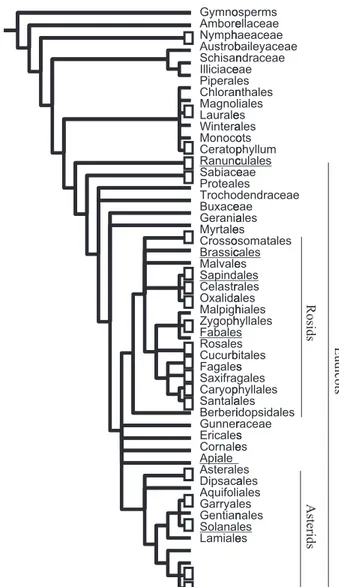
Taxon samplingSeven datasets were analysed (Fig. 1; Supporting Information Figs S1–S8): representatives of a broad sampling of angiosperms (560 taxa from Soltis et al., 2000), and more focused sampling of six angiosperm clades: Sapindales (Gadek et al., 1996), Api-ales (Downie et al., 1998), Papaveraceae (Hoot et al., 1997; Gleissberg & Kadereit, 1999), Fabaceae (Wojciechowski et al., 2004), Lepidium (Brassicaceae: Mummenhoff et al., 2001, 2004) and Solanum (Solanaceae: Bohs, 2005). Angiosperm-wide analyses were conducted both including and excluding Ceratophyllum (controversially placed, e.g. Doyle, 2007); the results were similar, but only the latter analyses are presented. In addition, phylogenetically well-supported subsamples of the full angiosperm dataset (‘560 taxon’) were analysed: eudicots (‘409 taxon’), rosids including Saxifragales (‘195 taxon’) and as-terids (‘147 taxon’). The study groups were chosen because they show variation in leaf form; that is, taxa were sampled based on the availability of sequence data and, therefore, were assumed to be random with respect to leaf form. All analyses included appropriate outgroups based on previously published phylogenies.
Taxon coding
Leaf forms of taxa within each dataset were scored from the literature, internet sources and direct observations (Table S1). The characterization of leaf form is complicated (Hickey, 1973; Ellis et al., 2009). Complex leaves are variably defined; they could be considered to be the opposite end of a continuum from simple unlobed leaves (e.g. Kaplan, 1975; Dengler et al., 1982; Kaplan et al., 1982; Lacroix & Sattler, 1994; Sattler & Rutishauser, 1997). The classical morphological view is that the compound leaf with leaflets articulated to a rachis is distinct from the unlobed, lobed or dissected leaf (e.g. Eames, 1961; Esau, 1965). Developmental morphology suggests that simple lobed leaves are more similar to complex leaves because lateral blastoz-ones (absent in simple entire leaves) initiate both lobes and leaf-lets (Hagemann & Gleissberg, 1996). Molecular developmental data suggest that dissected and compound leaves are similar in being initiated from complex primordia (Bharathan et al., 2002). Physiological data distinguish between simple unlobed and other leaves as a result of the distinct functional correlates of these forms (e.g. Vogel, 1968; Nobel, 1983; Gurevitch & Schuepp, 1990). Here, coding schemes capturing disparate perspectives were adopted. Four mature leaf forms were recognized: simple and unlobed (‘u’), simple and lobed to less than one-third of the way to the midrib (‘l’), simple and lobed but dissected to greater than one-third to nearly all the way to the midrib (‘d’), and com-pound, with leaflets articulated to a rachis (‘c’). Serrated ⁄ toothed margins were not distinguished. Four different coding schemes (henceforth ‘coding’) using variously defined character states were devised to categorize the four forms. Each coding is listed below with references and factors that could be considered to justify that
Asterids Eudicots osperms ellaceae haeaceae baileyaceae ndraceae eae es nthales liales es ales ots phyllum cculales eae es dendraceae eae ales es osomatales cales es ales rales ales hiales hyllales s s bitales s gales phyllales ales idopsidales raceae s es es ales iales les nales les es Rosids Gymno Ambore Nymph Austrob Schisan Illiciace Piperal Chloran Magno Laurale Wintera Monoco Ceratop Ranunc Sabiace Proteal Trocho Buxace Gerania Myrtale Crosso Brassic Malvale Sapind Celastr Oxalida Malpigh Zygoph Fabale Rosale Cucurb Fagales Saxifra Caryop Santala Berberi Gunner Ericales Cornale Apiialle Asteral Dipsaca Aquifol Garrya Gentian Solana Lamiale
Fig. 1 Sampling of taxa and origins of complex leaves shown on reduced topology of angiosperms (after Soltis et al., 1999; Bharathan et al., 2002). Open rectangles indicate lineages that vary in leaf form and represent independent instances of gains and losses of complex leaves. Groups used in the present study include angiosperms (560 taxon dataset; Soltis et al., 2000), as well as six angiosperm clades (underlined taxon names) using molecular datasets from six independent studies (Sapindales (Gadek et al., 1996); Apiales (Downie et al., 1998); Papaveraceae, Ranunculales (Hoot et al., 1997); Fabaceae, Fabales (an earlier, smaller version of that pub-lished in Wojciechowski et al., 2004); Solanum, Solanales (Bohs, 2005; this study); Lepidium, Brassicales (Mummenhoff et al., 2001, 2004)). Sam-pling of taxa within each angiosperm clade, as well as the 560 taxa data-set, was independent of leaf form. The results of the analyses including and excluding Ceratophyllum were similar, and the latter alone are pre-sented.
scheme. Polymorphic coding was used in the case of variation within genera and species (heteroblasty). Three additional schemes analysed for completeness yielded consistent results (Notes S1).
(A) 0: simple unlobed ‘u’ or 1: complex ‘ldc’ (developmental morphological (Hagemann & Gleissberg, 1996), functional); (B) 0: simple unlobed and lobed ‘ul’ or 1: complex ‘dc’ (develop-mental genetic; cf. Bharathan et al., 2002; Barkoulas et al., 2008); (C) 0: simple ‘uld’ or 1: compound ‘c’ (morphological; cf. Hickey, 1973; Ellis et al., 2009);
(D) 0: unlobed ‘u’; 1: lobed ‘l’; 2: dissected ‘d’; 3: compound ‘c’ (morphological, Eames, 1961; developmental genetic, Efroni et al., 2010).
Phylogenetic hypotheses
Bayesian analyses (Rannala & Yang, 1996), implemented in MrBayes (Huelsenbeck & Ronquist, 2001), were conducted on molecular sequence data published for Sapindales (Gadek et al., 1996), Apiales (Downie et al., 1998), Papaveraceae (Hoot et al., 1997), Fabaceae (Wojciechowski et al., 2004), Solanum (Bohs, 2005; this paper) and Lepidium (Mummenhoff et al., 2001, 2004; Lee et al., 2002). Bayesian analyses were run with four Markov chains and sampled every (10–50) · 103 generations over (1–6) · 106 generations, such that 100 trees could be sampled at likelihood stationarity (post-burn-in). These 100 trees from each dataset, with branch lengths, were used in comparative analyses. The nucleotide substitution model used in the Bayesian analysis was selected via Akaike’s information criterion (AIC; Sakamoto et al., 1986), as implemented in ModelTest (Posada & Crandall, 1998).
For the 560 taxon dataset, the published strict consensus tree was used to generate 99 trees through random resolutions of polytomies using MacClade (Maddison & Maddison, 2005). This dataset was too large for Bayesian analyses using the computing capacity available to us at the time. Branch lengths were estimated by ML on the three-gene dataset of Soltis et al. (2000) using PAUP* (Swofford, 1998).
Phylogenetic patterns
ML estimates of ancestral states were obtained for all seven data-sets and subsamples of the angiosperm dataset (409 taxon, 195 taxon, 147 taxon) using BayesMultistate (Pagel, 1994, 1997; Pagel et al., 2004). The algorithm treats polymorphic states as equally probable in likelihood calculations.
Maximum parsimony (MP) estimates of ‘change’ (transition from one character state to another) and ‘stasis’ (no transition) were obtained across all 99 trees for the 560 taxon dataset. These calculations were performed using the ‘Chart’ function in Mac-Clade 4.08 (Maddison & Maddison, 2005). The algorithm optimizes ancestral states across the tree and determines, for each node, whether its descendants have different states (‘change’) or not (‘stasis’). This provides estimates of the instances of change and stasis between pairs of states (ancestral and descendant). Because alternative optimizations are possible, we averaged the
maximum and minimum numbers of estimated changes across all trees. We used these averages to estimate the proportion of changes as a fraction of the total number of nodes (change + stasis). These proportions of gains and losses were taken to repre-sent approximate MP estimates of transition rates, whose inequality is indicated by their ratio. Ancestral reconstructions on individual trees were examined under two modes of resolution of equivocal reconstructions: delayed (DELTRAN) and accelerated (ACCTRAN) changes on the tree.
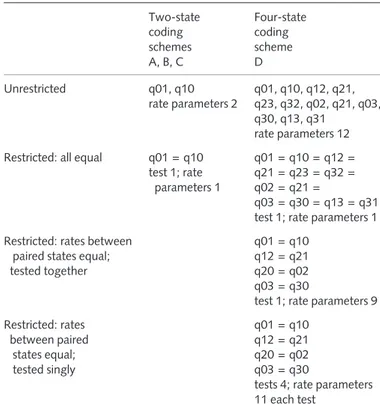
Transition rates (henceforth ‘rates’) between character states (e.g. 0, 1) were modelled by ML under a continuous time Markov model implemented in BayesMultistate. For all codings, unrestricted models (i.e. allowing unequal rates for all possible evolutionary transitions) were tested against restricted models (rates restricted – Tables 1, S2). For two-state coding, the hypotheses of equal rates of gains and losses of complex leaves (codings A and B) or compound leaves (coding C) were tested. Likelihoods were compared under the unrestricted model (Model 1) of unequal rates of gains and losses (two rate parameters: gain, q01; loss, q10) and the restricted model (Model 2) of equal rates (one rate parameter, q01 = q10). The significance of differences between likelihoods was assessed using the likelihood ratio test, where the statistic G = – 2 · (LogLmodel1– LogLmodel2) follows
a chi-squared distribution with degrees of freedom equal to unity, which is the difference in the number of free parameters between models (e.g. Sanderson, 1993). For the four-state coding scheme (D), selected restricted models were tested on the 560 taxon angiosperm dataset (Table 5). These tests allowed us to
Table 1 Summary of unrestricted models (separate rate estimates for all transitions) and restricted models (fewer rate estimates)
Two-state coding schemes A, B, C Four-state coding scheme D Unrestricted q01, q10 rate parameters 2 q01, q10, q12, q21, q23, q32, q02, q21, q03, q30, q13, q31 rate parameters 12 Restricted: all equal q01 = q10
test 1; rate parameters 1 q01 = q10 = q12 = q21 = q23 = q32 = q02 = q21 = q03 = q30 = q13 = q31 test 1; rate parameters 1 Restricted: rates between
paired states equal; tested together
q01 = q10 q12 = q21 q20 = q02 q03 = q30
test 1; rate parameters 9 Restricted: rates between paired states equal; tested singly q01 = q10 q12 = q21 q20 = q02 q03 = q30
tests 4; rate parameters 11 each test
Likelihoods of models were compared using likelihood ratio tests (results in Tables 4, 5).
determine whether particular rates were equal (e.g. rate1 fi 0⁄
rate0 fi 1
=
1) or unequal (e.g. rate1 fi 0⁄ rate0 fi 1 „ 1);exami-nation of the transition rate ratios (henceforth ‘rate ratios’) allowed us to determine the direction of inequality.
Randomization and simulation tests
We analysed two potential sources of systematic bias in our esti-mates of ML rate ratios using simulations of the 560 taxon data-set: relative frequencies of character states and reported inconsistency of ML optimizations.
Effect of relative frequencies of character states We investigated whether the relative frequency of character states (independent of the identity of the species and its phylogenetic position) determined rate ratios by shuffling character states with respect to the terminals of the phylogenies. If relative frequencies of charac-ter states alone decharac-termined rate ratio estimates, the observed and shuffled rate ratios would be statistically similar and strongly correlated. Conversely, if both relative frequencies of character states and phylogeny determined rate ratio estimates, the observed and shuffled rate ratios would be statistically different and weakly correlated. If the latter, we would conclude that the effect of phylogeny is more important than the relative frequency of character states. First, we estimated the asymmetrical rates of change in character state and resulting rate ratios for codings A and B using one binary resolution of polymorphic taxa across each of the 99 angiosperm trees, employing the ace function of the Ape package (Paradis et al., 2004) in R (R Development Core Team, 2010). Second, we shuffled the character states of the terminals 100 times with respect to the phylogenies. Third, we estimated the rate ratios for the shuffled datasets across the 99 trees. Finally, we compared the distributions of estimated observed (i.e. nonshuffled) and shuffled rate ratios, and measured the correlation between them.
Effect of polymorphisms Differences in the resolution of polymorphic taxa into binary states might affect the rate ratio esti-mates. To investigate this issue, we compared the distributions of rate ratios estimated from a random sample of possible binary resolutions of the polymorphic states in a taxon with those from single binary resolutions. To obtain the distributions, we esti-mated the rates of change in character states sampled from 1000 random binary resolutions for codings A and B on 99 original trees using the ace function. These analyses yielded a distribution of rate ratios that summarized the range of results possible from the billions of binary resolutions of the polymorphic taxa. We compared the rate ratio distributions obtained from single and multiple resolutions of polymorphic characters with each other and with a null distribution of rate ratios (based on equal rates of change in both directions, described in the following section, ‘Inconsistency of ML estimates’) to determine the impact of alter-native resolutions of polymorphisms.
Inconsistency of ML estimates If ML estimates spuriously converge on very different rates of change in either direction, the
ML rate ratios obtained would not approximate the actual rate ratio, and the actual rate ratio might not differ significantly from a value of unity (i.e. equal rates). We used simulations to: com-pare the distributions of the rate ratio parameter from observed and simulated data; and generate a null distribution of rate ratios modelled using equal rates of change in both directions. We followed a three-step protocol to generate and analyse these simu-lations. First, a sample of 100 two-rate matrices of change in character states obtained from analyses of the observed data (codings A, B) was used to parameterize simulations employing the sim.char command of the Geiger R package (Harmon et al., 2008). Second, a sample of 100 equal-rate matrices was generated based on rates drawn from a normal random distribution (mean = 5, SD = 1) and used as input to simulate the null distri-bution on rate ratios. The root was assigned state 0 with a proba-bility of 0.7–0.8 (estimated from the data) in the simulations. Third, three distributions of rate ratios were calculated (in the original 99 trees), plotted and compared: observed, simulated (data simulated using estimated rate ratios as input) and null (data simulated using a rate ratio of unity as input).
We anticipated three alternative results. First, if ML estimates of asymmetrical rates of change were unbiased and consistent, the observed and simulated rate ratios should not differ significantly and should be strongly correlated, and both observed and simulated rate ratios should differ significantly from a null distri-bution of equal rates (rate ratio = 1). Second, if ML estimates were systematically biased, but reflected underlying asymmetrical rates of change, the observed and simulated rate ratios should dif-fer and be weakly correlated, and both should difdif-fer from the null distribution. Finally, if ML estimates were systematically biased and unrelated to the underlying rates, the observed and simulated rate ratios should differ and be uncorrelated, and the former should not differ from the null distribution. In the last scenario, ML estimates of rate ratios would be taken as misleading, because significant asymmetrical results could originate from data generated under a model of equal rates of change.
Results
Angiosperms: ancestral state reconstructions (Table 2, Figs 2, S1)
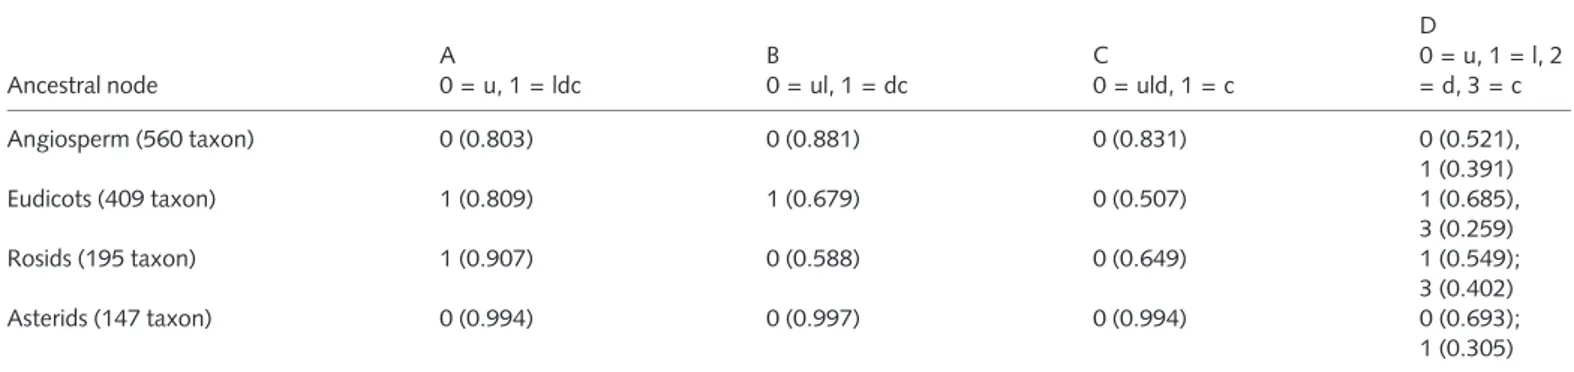
MP analyses yielded unambiguous reconstructions of ancestral states in most cases. The leaf was simple in selected ancestors (angiosperm, eudicot, rosid, asterid) under codings B–D. The state in the ancestral rosid was uncertain in some of the trees under coding A. Reconstructions under ML were uncertain for all but the asterid ancestor. Under two-state coding, the reconstructions of the angiosperm, eudicot and rosid ancestors were uncertain (P = 0.588–0.907), whereas the asterid ancestor consistently had the classic simple leaf (P = 0.99). Under four-state coding, combined probabilities were used to infer ancestral states. The ancestral angiosperm leaf most likely was simple and unlobed or lobed (coding A, P = 0.803 and coding B, P = 0.881), or unlobed, lobed or dissected (coding C, P = 0.831). Simple unlobed or lobed leaves were likely to have
characterized the ancestral angiosperm under coding D (P = 0.912). The combination of results under different codings suggests that the ancestral angiosperm had simple unlobed or lobed leaves (Fig. 2).
The eudicot and rosid ancestors within the 560 taxon tree could have had any of the leaf forms, as inferred from low support values for most of the reconstructions. By contrast, the asterid ancestor was unequivocally simple under all two-state co-dings and was highly likely to have been simple (unlobed ⁄ lobed) under scheme D (P = 0.998), and unlikely to have had compound leaves. Starting with simple leaves in the ancestral angiosperm, there may have been a change to lobed ⁄ complex leaves in the ancestral eudicot, and reversals back to the unlobed
state in the ancestral asterid and, depending on the analysis, in the ancestral rosid (Fig. 2).
Stasis and change (MP) among leaf forms (Tables 3, S1) MP reconstructions revealed that stasis far exceeded change in the case of simple leaves, however defined (on average 973 : 62). Sta-sis was also higher than change in compound (84 : 10), dissected (9 : 1) and lobed (6 : 3) leaves (coding D). The number of changes from simple states (36 gains) exceeded reversals (six losses); however, the ratio of losses to gains ranged from 1.1 to 2.4. In other words, there were proportionately more losses than gains of complex leaves across the tree. Although the evolutionary change from simple to complex leaf development occurred several times during the phylogenetic history of angiosperms (e.g. the ancestral Sapindales going from simple unlobed to compound), many other nodes appear to have retained the ancestral simple form (e.g. the ancestral Malphigiales), whereas others have reverted to the simple state (e.g. Cneorum).
Transition rates (ML) among leaf forms in the angiosperms (Tables 4, 5, Fig. 3)
Across all analyses, simple leaves (however defined) were more likely to evolve from other forms than to change. Analyses of two-state coded data (A, B, C) for the angiosperm-wide dataset showed a significantly higher likelihood (P << 0.001) for the unrestricted model (unequal rates of gains and losses of complex leaves) over the restricted model (i.e. equal rates of gains and losses). For all trees, rates of losses of complex leaves were greater than rates of gains. This implies a strong bias towards simple leaves across angiosperms caused by either retention or reversals, or both.
Four-state coding (D) revealed the complicated nature of this pattern (Table 5). The inequality of rates overall was strongly supported, as was the inequality of rates between paired states tested together (Table 5). This inequality in rates may be attrib-uted to higher rates of change to the unlobed state and lower rates of transitions out of the unlobed state, as may be seen in coding
Table 2 Maximum likelihood (ML) reconstructions of ancestral states of selected nodes in trees from the 560 taxon dataset and subsets (409 taxon, under different coding schemes (A–D); numbers in parentheses indicate average probabilities of alternative ancestral states
Ancestral node A 0 = u, 1 = ldc B 0 = ul, 1 = dc C 0 = uld, 1 = c D 0 = u, 1 = l, 2 = d, 3 = c Angiosperm (560 taxon) 0 (0.803) 0 (0.881) 0 (0.831) 0 (0.521), 1 (0.391) Eudicots (409 taxon) 1 (0.809) 1 (0.679) 0 (0.507) 1 (0.685), 3 (0.259) Rosids (195 taxon) 1 (0.907) 0 (0.588) 0 (0.649) 1 (0.549); 3 (0.402) Asterids (147 taxon) 0 (0.994) 0 (0.997) 0 (0.994) 0 (0.693); 1 (0.305)
Coding schemes: (A) 0: unlobed ‘u’ or 1: complex ‘ldc’; (B) 0: simple ‘ul’ or 1: complex ‘dc’; (C) 0: simple ‘uld’ or 1: compound ‘c’; (D) 0: unlobed ‘u’; 1: lobed ‘l’; 2: dissected ‘d’; 3: compound ‘c’.
Ros
Ang Eu
Ast
u l d c
C
A
B
D
*
*
B
*
*
*
*
*
Fig. 2 Summary of transitions in ancestral states of leaf form in angio-sperms (560 taxon dataset) under coding schemes A–D reconstructed under unrestricted models of evolution (see Table 2). Transitions from the ancestral angiosperm (Ang) to the ancestral Eudicot (Eu), to the ancestral Rosid (Ros) and ancestral Asterid (Ast) are shown as branched diagrams. The silhouetted forms are as follows: u, simple unlobed; l, simple lobed; d, dissected; c, compound. Boxed grouped forms indicate forms coded into a single state (see text for details). Asterisks indicate reconstruction(s) whose probability or combined probability is at least 0.90: for example, in coding scheme D, the state of the ancestral angiosperm was either unlobed or lobed with a combined probability of 0.96 (see Table 2).
D. Estimated rate parameters for changes from lobed to unlobed leaves were high (q10 = 215) and from lobed to compound leaves and back were moderate (q13 = 58, q31 = 25). Changes to unlobed leaves from either dissected or compound leaves, between dissected and compound leaves, or from unlobed to dissected leaves were low or negligible (rate parameter estimates of 0–15) compared with changes from lobed leaves (estimates of 24–215). Phylogenetic patterns in angiosperm clades (Table 4, Figs S2–S8)
The six angiosperm clades displayed varied patterns, mostly opposite to the pattern detected in the angiosperm 560 taxon
dataset, that is, with rates of gain of complex leaves greater than rates of reversals to simple leaves; however, most of these rate differences were not significant.
Among the clades analysed, only the results from Solanum were similar to the pattern across angiosperms: higher rates of reversals to simple leaves relative to gains of complex leaves. The coding scheme for this dataset affected the outcome. Rates of loss were always greater than rates of gain, but this difference was nonsig-nificant under coding B, and marginally signonsig-nificant under codings A and C (P < 0.055). The high proportion of polymor-phisms (0.24) in this dataset may have contributed to the marginal significance of the differences in the rates observed. In analyses of a dataset coded with no polymorphisms, this pattern
Table 3 Average number of instances of stasis (no state change between ancestral and descendant nodes) or change under different coding schemes across the angiosperms (560 dataset)
Change Coding scheme 0 fi 0 0 fi 1 0 fi 2 0 fi 3 1 fi 1 1 fi 0 1 fi 2 1 fi 3 2 fi 2 2 fi 0 2 fi 1 2 fi 3 3 fi 3 3 fi 0 3 fi 1 3 fi 2 A 908.1 957.9 38.6 49.6 106.6 156.0 3.9 14.9 B 961.9 1001.0 26.0 37.0 79.0 118.1 1.0 12.0 C 1006.3 1018.0 30.8 34.0 65.0 76.7 1.0 4.2 D 947.2 14.3 4.0 23.4 3.0 0.0 0.0 1.0 8.0 0.0 0.0 0.0 68.0 1.0 0.0 1.0 980.0 19.0 6.0 33.0 7.8 1.5 0.0 3.0 9.0 0.0 0.0 1.0 98.6 9.0 5.5 3.0
Estimated numbers of stasis (0 fi 0, 1 fi 1, 2 fi 2, 3 fi 3) and change calculated using ‘Chart’ function, MacClade v4.08: minimum and maximum number of unambiguous events of stasis and change among leaf forms reconstructed under maximum parsimony (MP); averaged across 99 trees. Coding schemes as in Table 2.
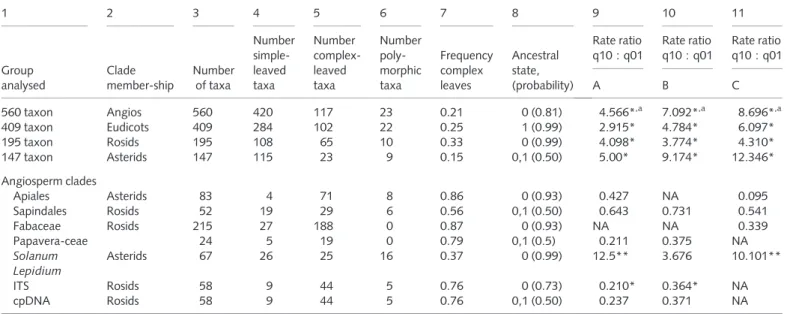
Table 4 Variation in leaf form (columns 1–8: coding scheme A) and ratios of maximum likelihood (ML) estimates of instantaneous rates of evolution in leaf form (losses, q10; gains, q01; coding schemes A–C) with results of likelihood ratio tests
1 2 3 4 5 6 7 8 9 10 11 Group analysed Clade member-ship Number of taxa Number simple-leaved taxa Number complex-leaved taxa Number poly-morphic taxa Frequency complex leaves Ancestral state, (probability) Rate ratio q10 : q01 Rate ratio q10 : q01 Rate ratio q10 : q01 A B C 560 taxon Angios 560 420 117 23 0.21 0 (0.81) 4.566*,a 7.092*,a 8.696*,a 409 taxon Eudicots 409 284 102 22 0.25 1 (0.99) 2.915* 4.784* 6.097* 195 taxon Rosids 195 108 65 10 0.33 0 (0.99) 4.098* 3.774* 4.310* 147 taxon Asterids 147 115 23 9 0.15 0,1 (0.50) 5.00* 9.174* 12.346* Angiosperm clades Apiales Asterids 83 4 71 8 0.86 0 (0.93) 0.427 NA 0.095 Sapindales Rosids 52 19 29 6 0.56 0,1 (0.50) 0.643 0.731 0.541 Fabaceae Rosids 215 27 188 0 0.87 0 (0.93) NA NA 0.339 Papavera-ceae 24 5 19 0 0.79 0,1 (0.5) 0.211 0.375 NA Solanum Asterids 67 26 25 16 0.37 0 (0.99) 12.5** 3.676 10.101** Lepidium ITS Rosids 58 9 44 5 0.76 0 (0.73) 0.210* 0.364* NA cpDNA Rosids 58 9 44 5 0.76 0,1 (0.50) 0.237 0.371 NA
Coding schemes A–C as in Table 2.
Significant differences in rates *, P < 0.05. Marginally significant differences **, P < 0.10 under likelihood ratio test.
Where dissected and compound leaves are mutually exclusive, fewer coding schemes are applied: two (A and B or A and C, e.g. Lepidium, Papaveraceae, Apiales) or one (C for Fabaceae) (no lobed leaves—Bauhinia, the only exception, was coded as simple).
a
Rate parameters estimated under unrestricted models in the 560 taxon dataset (highest estimate within each coding scheme in bold, all inferred to be significantly higher than rate parameters of other changes): (A) q01 = 6.53, q10 = 29.76; (B) q01 = 3.89, q10 = 27.74; (C) q01 = 3.96, q10 = 37.72.
(rates of loss greater than rates of gain) for Solanum was significant across codings (not shown). However, polymorphism contributes significantly to estimates of rate ratios by affecting the frequency of character states (below), and its effect cannot be ignored.
In Apiales, Sapindales, Fabaceae, Papaveraceae and Lepidium, the trend was the opposite of angiosperms in general and Solanum, with higher rates of transitions from simple to complex than the reverse (ratios ranging from 0.095 to 0.731). In Lepidium, this trend was generally significant for the internal tran-scribed spacer (ITS), but not chloroplast DNA (cpDNA), trees. Among ITS trees, 81% of the tests under coding A and 93% of the tests under coding B were significant; in cpDNA trees, only 26–29% of the tests were significant. Despite these differences, possibly caused by differences in the topologies of cpDNA and ITS trees (Bowman et al., 1999; Mummenhoff et al., 2001, 2004), similar trends in leaf form evolution were detected.
Thus, most of the trends in different angiosperm clades (rates of gain greater than rates of loss), except for Solanum, were opposite to that of the angiosperms overall (rates of loss greater than rates of gain); all trends were inconsistently and marginally significant.
We tested the possibility that bias in choosing the clades of an-giosperms might have led to conflicting results at different taxonomic levels by analysing three subsamples from the three-gene angiosperm phylogeny. All subsamples (409, 195 and 147 taxon data) showed significant, differentially unequal rate ratios with greater rates of losses of complex leaves than gains (Table 4).
Involvement of lobed leaves in transitions that occur at high rates (Tables 3, 5)
ML estimates of rate parameters under coding D show that transitions towards or from lobed leaves occur at relatively high rates, suggesting that lobed leaves are labile in evolution. Thus, most leaf forms evolve into unlobed leaves at very high rates, but not the reverse; dissected leaves tend to change to or from com-pound leaves and comcom-pound leaves tend to change to or from lobed leaves. The high rate of reversion to simple leaves under all two-state codings may be explained by the underlying high rates of transition to unlobed and lobed leaves from compound leaves and a moderate level of transition between compound and lobed leaves. Subsamples of the angiosperm dataset (eudicots, rosids, asterids), analysed separately (see the Discussion section), showed similar patterns as seen in all angiosperms.
To sum up, MP and ML analyses in combination show that: (1) stasis is the overriding pattern for all forms; (2) the numbers of changes do not directly translate into rates; (3) unlobed leaves tend to evolve from lobed or compound forms; (4) lobed leaves are most changeable and tend to evolve from compound forms and to unlobed or compound forms; (5) dissected leaves tend not to change; when they do, they switch to compound leaves and
Table 5 Inequality of rates of evolution in leaf form inferred from likeli-hood ratio (LR) tests, conducted for the angiosperm-wide (560 taxon) dataset under coding D
Coding scheme Restricted models I II III Four-state (D) 0 = u unlobed 1 = l lobed 2 = d dissected 3 = c compound All rates not equal
Rates from unlobed not equal to reversals
(reversals greater)
q01 = q10 q02 = q20 q03 = q30 q12 „ q21
The first column presents the coding scheme being tested and the follow-ing three columns present inferences from LR tests. The likelihoods of the data under models that restrict change in particular ways (columns I–III, see footnotes) are compared with the likelihood under the unrestricted model. Rejection of restricted models at a = 0.01, combined with esti-mated rate parameters*, leads to the inferences presented.
Restricted models tested: (I) all rates equal: q01 = q10 = q12 = q21 = q23 = q32 = q02 = q21 = q03 = q30 = q13 = q31; (II) rates between paired states equal: q01 = q10, q12 = q21, q20 = q02 and q03 = q30, tested together, one test, nine rate parameters; (III) rates between paired states equal, tested separately, four tests, 11 parameters each.
*Rate parameters estimated under unrestricted models (highest estimate in bold, inferred to be significantly higher than other rate parameters; rate parameters involving lobed leaves (state 1) italic): q01 = 8.93,
q10 = 215.27, q02 = 0.18, q20 = 0, q03 = 1.58, q30 = 14.46, q12 = 0.61, q21 = 0, q13 = 57.91, q31 = 24.47, q23 = 0.181, q32 = 4.09.
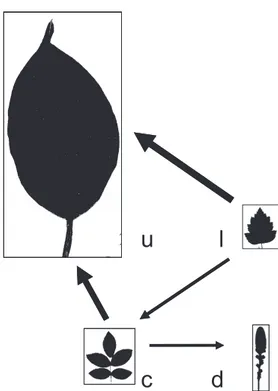
u l
c d
Fig. 3 Summary of trends in evolution of leaf form in angiosperms (560 taxon dataset) under coding scheme D. Relative sizes of leaf forms corre-spond to their relative frequencies; simple leaves are the most frequent. Arrows indicate the direction of the higher rate for each pairwise compari-son estimated under unrestricted models, supported by rejection of pair-wise equal rates under all coding schemes (Table 5). Thickest arrows represent significantly higher rates compared with the rate of transition in the opposite direction. Under coding scheme D, rates are relatively high from or to the lobed state, suggesting that this state is evolutionarily labile (see text for details). u, simple unlobed; l, simple lobed; d, dissected; c, compound.
back; and (6) compound leaves tend to switch back and forth from lobed forms. Similar results were obtained under additional codings (Notes S1, Tables S3–S5).
Relative frequency and distribution of character states (Fig. 4)
The number of simple leaves in the angiosperm dataset is high (428–490 operational taxonomic units depending on the cod-ing scheme used) compared with compound (64), dissected (10) and lobed (19) leaves. The asymmetry of rates (rate ratios „ 1) could be the consequence of the predominance of simple leaves. Our analyses show that, despite sharing the same underlying phylogenies and differing only in the identity of the species having particular character states, for codings A and B, the rate ratios (1 fi 0 : 0 fi 1) derived from shuffled data were > 1 (as in the original data); and the rate ratios derived from observed and shuffled data were not significantly corre-lated (Pearson’s product-moment correlation for coding A = 0.04, t97= 0.3919, P = 0.348; Pearson’s product-moment
correlation for coding B = 0.09, t97= 0.9117, P = 0.1821;
Fig. 4). Thus, the asymmetry of rates relates to the relative fre-quencies of character states generally, but particular patterns of asymmetry depend on the observed phylogenetic distribution of character states. We used the Mann–Whitney U-test to deter-mine whether the medians of rate ratios differed in the observed and shuffled data, and found significant differences (U for coding A = 9108, P < 2.2 · 10)16; U for coding B = 8335, P < 2.2 · 10)16; Fig. 4). We used a nonparametric test because distributions of the rate ratios resulting from the analy-sis of observed and shuffled data were not normal (Shapiro– Wilk normality test; Shapiro & Wilk, 1965; P £ 0.02144). Rates in the observed data were more asymmetric than in the shuffled data, suggesting that the extent of asymmetry was dependent on the distribution of character states. Our results were robust to polymorphisms in the dataset. Simulations to evaluate the effect of variably resolved polymorphisms revealed lower mean rate ratios and much larger spread in results from 1000 random binary resolutions of polymorphisms than from original estimates (U for coding A = 42702.5, P = 0.02405; U for coding B = 21176.5, P < 2.2 · 10)16; Fig. 4). Mean rate ratios from the observed data were always significantly higher than the null equal-rate rate ratios (one-sided U for coding A ‡ 7710, P £ 5.5 · 10)12; U for coding B ‡ 9207, P < 2.2 · 10)16). In sum, although extensively sampling polymorphism throughout the angiosperm phylogeny resulted in lower rate ratios (less asymmetry), these were still significantly higher than the rate ratios resulting from a null distribution of equal rates of change in both directions.
Rate ratios in observed and simulated data (Fig. 5)
The rate ratios estimated from data simulated using rate ratios esti-mated from the observed data as input parameters were significantly correlated with the rate ratios estimated directly from the data (Pearson’s product-moment correlation for coding A = 0.34, t98= 3.5637, one-sided P = 0.0003; Pearson’s
product-moment correlation for coding B = 0.22, t98= 2.2944, one-sided
P = 0.01195), but correlations were low, suggesting that input parameters only partially explain the processes that underlie the observations. Simulated data produced significantly higher rate ratios and a broader spread than observed data (Shapiro–Wilk normality test for observed and simulated rate ratios under coding A, P £ 0.036; one-sided U for coding A = 4162, P = 0.02036; Shapiro–Wilk normality test for observed and simu-lated rate ratios under coding B, P ‡ 0.06234; one-sided paired t-test of means for coding B, t99= ) 5.0531, P = 9.952 · 10)07;
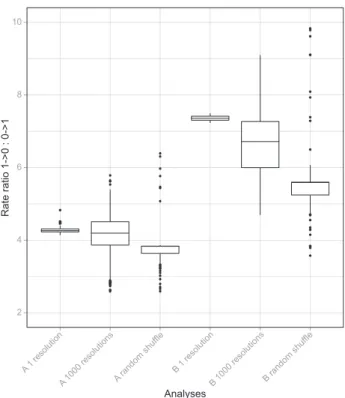
Fig. 5). The null distribution was strongly non-normal (Shapiro– Wilk normality test, P < 2.2 · 10)16; Fig. 5), and so we used non-parametric tests to determine whether the observed rate ratios were significantly higher than modelled under the null hypothesis of equal rates of change in both directions. Both coding methods had significantly higher rate ratios than the modelled null (one-sided U for coding A = 7566, P = 1.823 · 10)10; one-sided U for coding B = 9126, P < 2.2 · 10)16). Analyses Rate ratio 1->0 : 0->1 2 4 6 8 10 A 1 resolution
A 1000 resolutions A random shuf fle
B 1 resolution
B 1000 resolutions B random shuf fle
Fig. 4 Box plot of the distribution of rate ratios estimated from the data with one resolution of polymorphism (A1, B1) and 1000 alternative resolu-tions of polymorphism (A1000, B1000), and from randomly shuffled ter-minals (A Random, B Random) across 99 trees. Rate ratio estimates were obtained for each tree using at least 10 different fully binary character state combinations. Rate ratios from observed and shuffled data were not significantly correlated, indicating that the pattern of asymmetry depends on the distribution of character states across the phylogeny. Alternative resolutions of polymorphisms lead to a wider spread of rate ratios. Rate ratios from observed data were significantly greater than those resulting from a null distribution simulated with equal rates of change in both direc-tions (see text and Fig. 5).
Discussion
The ancestral angiosperm was inferred to have simple (unlobed or unlobed–lobed), but not complex, leaves under MP and ML. This finding is consistent with the fossil record and previous phy-logenetic studies (Hickey & Doyle, 1977; Cronquist, 1988; Doyle & Endress, 2000; Bharathan et al., 2002; Doyle, 2007). This does not rule out the possibility that the simple leaf in angiosperms was the result of a ‘reduction’ from complex leaves (see Sinha, 1997). ML estimates of ancestral states included some probability that the ancestral angiosperm had dissected leaves (C and additional). This unexpected outcome could result from the assumption of constant rates of change across the phylogeny and from the uncertainty associated with reconstructions under high rates of evolution (Schluter et al., 1997; Cunningham et al., 1998; Ekman et al., 2008; see the section entitled ‘Data and analysis-related factors’).
Our analyses of leaf form led to three major new findings: (1) stasis of leaf form predominates; (2) simple leaves revert from complex leaves at a statistically significantly higher rate than the reverse, suggesting that simple leaves are retained as a result of a low rate of change, a higher rate of reversals from complex leaves, or both; and (3) simple lobed leaves are involved in all transitions with high rates and have a strong tendency to become unlobed, suggesting that lobed forms represent a labile intermediate step in leaf evolution.
Stasis, character constraints and environmental factors Stasis, as detected in this study, could be a result of a lack of change, very slow rates of change, or both. Lack of change may be a result of either ‘character constraint’ (vs ‘organismal con-straints’) or stabilizing selection, or interactions between the two (Charlesworth et al., 1982; Estes & Arnold, 2007; Futuyma, 2010). Character constraints could be caused by several factors, two of which, the loss or absence of the appropriate genetic basis and the rarity of appropriate mutations, may not apply to leaf evolution. Minimally, the same genetic pathway (KNOX), with frequent mutations that turn the pathway on and off, may be involved in multiple evolutionary origins of complex leaves across angiosperms (Bharathan et al., 2002; Hay & Tsiantis, 2006). A third factor, genetic correlations, might constrain the evolution of complex leaves; for instance, KNOX proteins also regulate meristematic growth in various plant organs (reviewed in Hay & Tsiantis, 2010), and so mutations in knox genes may be con-strained as a result of pleiotropic effects. Such a constraint cannot be absolute, but could slow the appearance of new phenotypes.
Leaf physiognomic studies, used to estimate palaeoclimate, suggest that a high proportion of leaves with dissected margins in a community is related to low mean annual temperature and low precipitation; conversely, low dissection levels are related to warmer climates (Wolfe, 1995; Wiemann et al., 1998; Royer et al., 2005; Peppe et al., 2011). Our study includes taxa repre-senting all plant forms (herbs, shrubs, trees, lianas), and not just woody dicotyledonous plants, as is usual in leaf physiognomic studies (but see Peppe et al., 2011); moreover, the definitions of dissection do not exactly overlap, and so our results cannot be related directly to these studies. Nevertheless, it is possible that simple leaves during the early days of angiosperm evolution may have been maintained in prevailing warm climates, and that com-plexity may be related to locally decreasing temperatures (and precipitation). Further work using dated phylogenies and quanti-tative coding could allow a clearer perspective on these alternatives.
Gains, losses and developmental factors
The higher rate of reversals to simple leaves could indicate that it is developmentally easier for simple leaves to evolve from com-plex leaves than the opposite. Comparative studies suggest that complex mature leaves arise only from ‘complex’ (minutely toothed) primordia with KNOX expression, whereas simple mature leaves can arise from either complex primordia with KNOX expression or smooth primordia lacking KNOX expres-sion, leading to three leaf trajectories: complex–complex, complex–simple and simple–simple (Bharathan et al., 2002). However, there is no developmental genetic reason to believe that mutations from complex to simple primordia (loss of KNOX expression) or from complex to either simple leaf trajectory are ‘easier’ than mutations from either type of simple leaf to a com-plex leaf. Regardless of the details of the underlying mechanism, its generality or ease of change, angiosperms appear to have one way to initiate complex leaves, but at least two ways to initiate
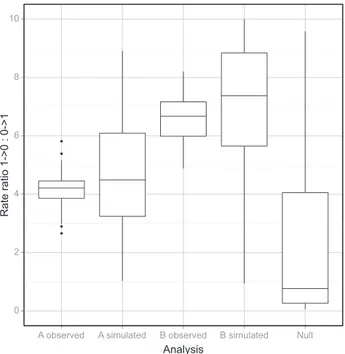
Analysis Rate ratio 1->0 : 0->1 0 2 4 6 8 10
A observed A simulated B observed B simulated Null
Fig. 5 Box plot of the distribution of rate ratios estimated from the data (observed), estimated from simulations of data with observed rate matrices as input (simulation) and simulations with equal rates of change in both direction as input (null). Observed and simulated rate ratios were greater than the null, thus showing that the maximum likelihood (ML) estimates reflect underlying asymmetrical rates of change. Simulated rate ratios were significantly higher than observed rate ratios, suggesting that the ML esti-mates are biased.
simple leaves. This could lead to simple leaves evolving more readily; theory predicts that, when there are more developmental paths leading to one state, the state with more paths will be visited more frequently in evolution, all else being equal (Wagner & Stadler, 2003). By virtue of having more developmental paths leading towards it, the simple leaf may exert an ‘intrinsic pull’. A combination of genetic constraints and intrinsic pull as a result of the asymmetry of developmental paths may be responsible for the high proportion of simple leaves in angiosperms and the unequal rates of change.
We show that evolutionary transitions among certain leaf forms happen more readily than among others, suggesting devel-opmental hypotheses for further study. Simple lobed leaves appear to be a labile, intermediate stage in evolution, being involved in transitions that occur at high or moderate rates, espe-cially from compound leaves. These patterns suggest that lobed leaves are likely to be initiated as complex primordia (with KNOX expression), as observed, for example, in Arabidopsis and Myriophyllum (Piazza et al., 2010; Bourque & Lacroix, 2011). Furthermore, in taxa in which lobed and unlobed leaves start as complex primordia, processes that allow them to develop into simple leaves are likely to be initiated later in lobed leaves than in unlobed leaves (e.g. Barkoulas et al., 2008). Comparative studies, for example, on palmately lobed and pinnately compound leaves in rosid taxa (Doyle, 2007) should reveal such differential devel-opmental processes. Evolutionary transitions between lobed or compound leaves and dissected leaves are less likely to occur, suggesting that the latter form a distinct class. It is possible that leaves, leaflets, lobes and serrations are distinct developmental genetic entities despite the fact that their development uses com-mon genetic components (Efroni et al., 2010; but see Kaplan, 2001; Blein et al., 2008). Similarly, investigations might add ‘dissection’ to this list, mindful that the distinction between ‘lobed’ and ‘dissected’ may be arbitrary in some cases in this study.
Data- and analysis-related factors
The slow rate of change in simple leaves could be a result of their higher frequency in the dataset. Under MP, the frequency of the rare state provides an upper limit to the number of times that state can be inferred to evolve. This tends to increase the cost of gains of the derived state and, therefore, to favour greater relative numbers of losses of the rare state and gain of the common state (Collins et al., 1994; Ree & Donoghue, 1998). Our finding that ML rate ratios were asymmetrical in both observed and shuffled character state data suggests that the unequal transition towards simple leaves may be partly a result of the high frequency of simple leaves in the dataset. However, this is not a complete explanation, because there was no correlation between the rate ratios obtained from observed and shuffled character states on the same topology, and the medians of rate ratios were higher in the observed than in shuffled data. Therefore, the particular distribu-tion of character states in angiosperms is the basis for an asymmetry of rates that is significantly greater than might be expected from the high frequency of simple leaves in the data.
Furthermore, the preponderance of simple leaves in the dataset does not result from artefacts in sampling. Using the numbers of species in sampled genera, assumed to be monophyletic (Mabberley, 1997), we estimated the number of species repre-sented in the angiosperm dataset with leaves that were simple unlobed (18 857), lobed (3485, including polymorphic species) and complex (6568). Even taking into account the uneven num-bers of species (1–900 per genus), the genera sampled were overwhelmingly simple leaved. The underlying causes for such a skewed character state distribution remain unidentified. In an analogous situation, compositional bias in molecular sequences, the relative roles of neutral mutational pressure and selection continue to be contentious (e.g. Wernegreen & Funk, 2004; Stoltzfus, 2006; Hildebrand et al., 2010). The question of how morphological character states attain skewed distributions requires deeper investigation. We conclude that our results are robust to the effects of the relative frequencies of the forms and uncertainties from taxon sampling and the alternative resolutions of polymorphisms.
Our simulations showed that the rate ratios obtained in the ML analyses were significantly different from those modelled under the null hypothesis of equal rates of gains and losses, sup-porting our conclusion that angiosperms are most likely to retain, and revert to, simple leaves. We also showed that ML estimates of rates were systematically biased and explained the observations only partially, because the recovered rate ratios were higher, more variable than and only weakly correlated with the input rate ratios. This systematic bias is expected to affect ancestral state reconstructions. The high rates of reversals assumed to hold across the angiosperm phylogeny could drive unexpected results, in which there is some probability that the ancestral angiosperm had dissected or compound leaves. Because observed and simu-lated rate ratios were corresimu-lated and both were significantly greater than the null rate ratios, we conclude that angiosperms have an overall bias towards simple leaves as a result of stasis and reversals. Nested angiosperm clades (here, Sapindales, Apiales, Papaveraceae, Fabaceae, Lepidium) may depart from this general pattern found across angiosperms.
Differences between patterns of evolution in angiosperms and nested clades
Our analyses uncovered an apparent paradox: angiosperms as a whole showed a strong tendency to retain or re-evolve simple leaves, but five of the six angiosperm clades studied showed inequalities in both directions that were either marginally or not significant. Given this variation among clades, one might expect angiosperms overall to show no significant inequalities in rates and to reflect only weak, clade-specific patterns. However, this was not the case, and this conflict between angiosperm-wide and taxonomically restricted analyses raises the possibility of biases in taxon sampling. Our estimates show that the 560 taxon sample reflects leaf form frequency in angiosperms in toto. Subsamples of angiosperms (409, 195 and 147 taxon datasets) showed evolu-tionary patterns similar to the 560 taxon dataset, suggesting that our results reveal an expectation for angiosperms that can be used
as a null model when examining the results from these and other clades.
In the present study, Solanum showed rates that were consis-tent with the angiosperm-wide pattern (in particular, the asterid clade), whereas Lepidium showed marginally significant unequal rates that were opposite to the angiosperm-wide pattern (in par-ticular, the rosid clade). A bias towards simple leaves in Solanum may be a result of the combination of factors postulated to operate across angiosperms, but more sampling in this large genus is required to test this hypothesis. Selected members of the Solanaceae showed both types of simple leaf trajectories (primor-dium–mature: simple–simple in Nicotiana tabacum (Nishimura et al., 1999) and complex–simple in eight species of Solanum (N. Sinha, unpublished)).
The evolutionary pattern in Lepidium (gains more than losses) points to factors that promote the origin and retention of com-plex leaves. This may be the case in the polyploid Austra-lian ⁄ New Zealand clade with a complicated ancestry (Dierschke et al., 2009). To greatly simplify, one subgroup (‘Californian ori-gin’) typically has complex leaves and occurs in arid ⁄ semi-arid regions, whereas the other (‘African ⁄ Californian origin’) typically has simple leaves and occurs in mesic regions (K. Mummenhoff, unpublished). This distribution pattern is consistent with emerg-ing physiognomic patterns in herbs (Peppe et al., 2011), suggest-ing the importance of environmental factors. Three leaf developmental trajectories are known in Lepidium, as seen across angiosperms: simple–simple (L. africanum), complex–simple (L. oleraceum) and complex–complex (L. hyssopifolium). How-ever, in Lepidium, any intrinsic developmental pull may be over-come by selective forces, a hypothesis that remains to be tested. Investigation of other, well-understood clades may reveal similar patterns (e.g. Pelargonium; Jones et al., 2009).
The choice of the six clades studied was dictated by the vari-ability in leaf form and the availvari-ability of well-supported phylog-enies. As such, they do not represent random samples (with respect to leaf form) of taxa within angiosperms; therefore, no combination of their evolutionary patterns could possibly repre-sent the evolutionary pattern for all angiosperms. Sampling needs to be expanded to more variable and more densely sampled clades to test the generality of the angiosperm-wide pattern and to explore further the effect of character state frequencies. In addi-tion, quantitative coding of leaf form could resolve some arbitrar-iness involved in assigning discrete states. In the meantime, a reasonable working hypothesis is that the angiosperm-wide pattern detected – a high frequency of simple leaves, lower rates of gain of complex leaves and higher rates of loss of simple leaves – reflects the integrated result of myriad factors acting at multiple levels – genetic developmental, organismal-physiological, phylo-genetic and environmental – and may represent a null expecta-tion when investigating the evoluexpecta-tion of leaf form within angiosperm groups.
Acknowledgements
We thank Stephen Downie, Sara Hoot and Chris Quinn for molecular datasets; Randy Evans, Toby Pennington and
Krzysztof Spalik for leaf morphological data; and Beatrice Grabowski, Jessica Gurevitch, James Doyle, Andreas Franzke, Ramona Walls and the phylogenetics discussion group at Stony Brook for discussions. We acknowledge funding from the National Science Foundation (NSF) (L.M.D. (DEB-0206336), L.B. (DEB-0316614), R.G. (DEB-0129376), M.L., N.S. and M.F.W. (DEB-0542958)), German Research Foundation (K.M.) and Fundac¸a˜o para a Cieˆncia e Tecnologia (A.L. (SFRH ⁄ BPD ⁄ 41391 ⁄ 2007)). We thank Kevin Boyce, James Doyle, Beatrice Grabowski, Susanne Renner, Mark Rausher and six anonymous reviewers for helpful critical comments on previ-ous versions of the manuscript. We appreciate the exceptionally thoughtful reviews of James Doyle and one anonymous reviewer.
References
Barkoulas M, Hay A, Kougioumoutzi E, Tsiantis M. 2008. A developmental framework for dissected leaf formation in the Arabidopsis relative Cardamine hirsuta. Nature Genetics 40: 1136–1141.
Bharathan G, Goliber TE, Moore C, Kessler S, Pham T, Sinha N. 2002. Homologies in leaf development inferred from KNOXI gene expression. Science 296: 1858–1860.
Blein T, Pulido A, Vialette-Guiraud A, Nikovics K, Morin H, Hay A, Johansen IE, Tsiantis M, Laufs P. 2008. A conserved molecular framework for compound leaf development. Science 322: 1835–1839.
Bohs L. 2005. Major clades in Solanum based on ndhF sequence data. In: Keating RC, Hollowell VC, Croat TB, eds. A Festschrift for William G. D’Arcy: the legacy of a taxonomist. Monographs in Systematic Botany from the Missouri Botanical Garden, Vol. 104. St. Louis, MO, USA: Missouri Botanical Garden Press, 27–49.
Bourque L, Lacroix C. 2011. Lobe-generating centres in the simple leaves of Myriophyllum aquaticum: evidence for KN1-like activity. Annals of Botany 107: 639–651.
Bowman JL, Bru¨ggemann H, Lee J-Y, Mummenhoff K. 1999. Evolutionary changes in floral structure within Lepidium L. (Brassicaceae). International Journal of Plant Sciences 160: 917–929.
Charlesworth B, Lande R, Slatkin M. 1982. A neo-Darwinian commentary on macroevolution. Evolution 36: 474–498.
Collins TM, Wimberger PH, Naylor GJP. 1994. Compositional bias, character-state bias, and character-character-state reconstruction using parsimony. Systematic Biology 4: 482–496.
Cronquist A. 1988. The evolution and classification of flowering plants. New York, NY, USA: The New York Botanical Garden.
Cunningham CW, Omland KE, Oakley TH. 1998. Reconstructing ancestral character states: a critical reappraisal. Trends in Ecology and Evolution 13: 361–366.
Dengler NG, Dengler RE, Kaplan DR. 1982. The mechanism of plication inception in palm leaves – histogenetic observations on the palmate leaf of Rhapis excelsa. Canadian Journal of Botany 60: 2999–3016.
Dierschke T, Manda´kova´ T, Lysak M, Mummenhoff K. 2009. A bicontinental origin of polyploid Australian ⁄ New Zealand Lepidium species (Brassicaceae): evidence from genomic in situ hybridization (GISH). Annals of Botany 104: 681–688.
Downie SR, Ramanath S, Katz-Downie DS, Llanas E. 1998. Molecular systematics of Apiaceae subfamily Apioideae: phylogenetic analyses of nuclear ribosomal DNA internal transcribed spacer and plastid rpoC1 intron sequences. American Journal of Botany 85: 563–591.
Doyle JA. 2007. Systematic value and evolution of leaf architecture across the angiosperms in light of molecular phylogenetic analyses. Courier Forschungsinstitut Senckenberg 258: 21–37.
Doyle JA, Endress PK. 2000. Morphological phylogenetic analysis of basal angiosperms: comparison and combination with molecular data. International Journal of Plant Science 161: S121–S153.
Eames AJ. 1961. Morphology of the angiosperms. New York, NY, USA: McGraw-Hill.
Efroni I, Eshed Y, Lifschitz E. 2010. Morphogenesis of simple and compound leaves: a critical review. The Plant Cell 22: 1019–1032.
Ekman S, Andersen HL, Wedin M. 2008. The limitations of ancestral state reconstruction and the evolution of the ascus in the Lecanorales (lichenized Ascomycota). Systematic Biology 57: 141–156.
Ellis B, Daly D, Hickey LJ, Johnson KR, Mitchell J, Wilf P, Wing SL. 2009. Manual of leaf architecture. Ithaca, NY, USA: Cornell University Press. Esau K. 1965. Plant anatomy. New York, NY, USA: John Wiley.
Estes S, Arnold SJ. 2007. Resolving the paradox of stasis: models with stabilizing selection explain evolutionary divergence on all timescales. American Naturalist 169: 227–244.
Futuyma DJ. 2010. Evolutionary constraints and ecological consequences. Evolution 64: 1865–1884.
Gadek PA, Fernando ES, Quinn CJ, Hoot SB, Terrazas T, Sheahan MC, Chase MW. 1996. Sapindales: molecular delimitation and infraordinal groups. American Journal of Botany 83: 802–811.
Givnish TJ. 1987. Comparative studies of leaf form – assessing the relative roles of selective pressures and phylogenetic constraints. New Phytologist 106: 131–160. Gleissberg S, Kadereit JW. 1999. Evolution of leaf morphogenesis: evidence
from developmental and phylogenetic data in Papaveraceae. International Journal of Plant Science 160: 787–794.
Gurevitch J, Schuepp PH. 1990. Boundary-layer properties of highly dissected leaves: an investigation using an electrochemical fluid tunnel. Plant, Cell & Environment 13: 783–792.
Hagemann W, Gleissberg S. 1996. Organogenetic capacity of leaves: the significance of marginal blastozones in angiosperms. Plant Systematics and Evolution 199: 121–152.
Harmon LJ, Weir JT, Brock CD, Glor RE, Challenger W. 2008. Geiger: investigating evolutionary radiations. Bioinformatics 24: 129–131.
Hay A, Tsiantis M. 2006. The genetic basis for differences in leaf form between Arabidopsis thaliana and its wild relative Cardamine hirsuta. Nature Genetics 38: 942–947.
Hay A, Tsiantis M. 2010. KNOX genes: versatile regulators of plant development and diversity. Development 137: 3153–3165.
Hickey LJ. 1973. Classification of the architecture of dicotyledonous leaves. American Journal of Botany 60: 17–33.
Hickey LJ, Doyle JA. 1977. Early Cretaceous fossil evidence for angiosperm evolution. Botanical Review43: 3–104.
Hildebrand F, Meyer A, Eyre-Walker A. 2010. Evidence of selection upon genomic GC content in bacteria. PloS Genetics. 6: Article Number: e1001107. doi: 10.1371/journal.pgen.1001107.
Hoot SB, Kadereit JW, Blattner FW, Jork KB, Schwarzbach AE, Crane PR. 1997. Data congruence and phylogeny of the Papaveraceae s.l. based on four datasets: atpB and rbcL sequences, trnK restriction sites, and morphological characters. Systematic Botany 22: 575–590.
Huelsenbeck JP, Ronquist F. 2001. MrBayes: Bayesian inference of phylogeny. Bioinformatics 17: 754–755.
Jones CS, Bakker FT, Schlichting CD, Nicotra AB. 2009. Leaf shape evolution in the South African genus Pelargonium L’ Her. (Geraniaceae). Evolution 63: 479–497.
Kaplan DR. 1975. Comparative developmental evaluation of the morphology of unifacial leaves in the monocotyledons. Botanisches Jahrbuecher fuer Systematik 95: 1–105.
Kaplan DR. 2001. Fundamental concepts of leaf morphology and morphogenesis: a contribution to the interpretation of molecular genetic mutants. International Journal of Plant Sciences 162: 465–474. Kaplan DR, Dengler NG, Dengler RE. 1982. The mechanism of plication
inception in palm leaves – problem and developmental morphology. Canadian Journal of Botany 60: 2939–2975.
Lacroix CR, Sattler R. 1994. Expression of shoot features in early leaf
development of Murraya paniculata (Rutaceae). Canadian Journal of Botany 72: 678–687.
Lee J-Y, Mummenhoff K, Bowman JL. 2002. Alloploidization and evolution of species with reduced floral structures in Lepidium L. (Brassicaceae). Proceedings of the National Academy of Sciences, USA 99: 16835–16840.
Mabberley DJ. 1997. The plant-book. A portable dictionary of plants, their classifications and uses, 2nd edn. Cambridge, UK: Cambridge University Press. Maddison D, Maddison W. 2005. MacClade 4.08. Sunderland, MA, USA:
Sinauer Associates.
Marks CO, Lechowicz MJ. 2006. Alternative designs and the evolution of functional diversity. American Naturalist 167: 55–66.
Mummenhoff K, Bru¨ggemann H, Bowman JL. 2001. Chloroplast DNA phylogeny and biogeography of Lepidium (Brassicaceae).American Journal of Botany 88: 2051–2063.
Mummenhoff K, Linder P, Friesen N, Bowman JL, Lee J-Y, Franzke A. 2004. Molecular evidence for bicontinental hybridogenous genomic constitution in Lepidium sensu stricto (Brassicaceae) species from Australia and New Zealand. American Journal of Botany 91: 254–261.
Niklas KJ. 1994. Morphological evolution through complex domains of fitness. Proceedings of the National Academy of Sciences, USA 91: 6772–6779. Nishimura A, Tamaoki M, Sato Y, Matsuoka M. 1999. The expression of
tobacco knotted1-type class1 homeobox genes correspond to regions predicted by the cytohistological zonation model. Plant Journal 18: 337–347.
Nobel PS. 1983. Biophysical plant physiology and ecology. San Francisco, CA, USA: W. H. Freeman.
Pagel M. 1994. Detecting correlated evolution on phylogenies: a general method for the comparative analysis of discrete characters. Proceedings of the Royal Society of London Series B, Biological Sciences 255: 37–45.
Pagel M. 1997. Inferring evolutionary processes from phylogenies. Zoologica Scripta 26: 331–348.
Pagel M, Meade A, Barker D. 2004. Bayesian estimation of ancestral character states on phylogenies. Systematic Biology 53: 673–684.
Paradis E, Claude J, Strimmer K. 2004. Ape: analyses of phylogenetics and evolution in r language. Bioinformatics 20: 289–290.
Peppe DJ, Royer DL, Cariglino B, Oliver SY, Newman S, Leight E, Enikolopov G, Fernandez-Burgos M, Herrera F, Adams JM et al. 2011. Sensitivity of leaf size and shape to climate: global patterns and paleoclimatic applications. New Phytologist 190: 724–739.
Piazza P, Bailey CD, Cartolano M, Krieger J, Cao J, Ossowski S, Schneeberger K, He F, de Meaux J, Hall N et al. 2010. Arabidopsis thaliana leaf form evolved via loss of KNOX expression in leaves in association with a selective sweep. Current Biology 20: 2223–2228.
Posada D, Crandall KA. 1998. Modeltest: testing the model of DNA substitution. Bioinformatics 14: 817–818.
R Development Core Team. 2010. R: a language and environment for statistical computing. Vienna, Austria: R Foundation for Statistical Computing. Rannala B, Yang Z. 1996. Probability distribution of molecular evolutionary
trees: a new method of phylogenetic inference. Journal of Molecular Evolution 43: 304–311.
Ree RH, Donoghue MJ. 1998. Step matrices and the interpretation of homoplasy. Systematic Biology 47: 582–588.
Royer DL, Wilf P, Janesko DA, Kowalski EA, Dilcher DL. 2005. Correlations of climate and plant ecology to leaf size and shape: potential proxies for the fossil record. American Journal of Botany 92: 1141–1151.
Sakamoto Y, Ishiguro M, Kitagawa G. 1986. Akaike information criterion statistics. Dordrecht, the Netherlands: D. Reidel.
Sanderson MJ. 1993. Reversibility in evolution: a maximum likelihood approach to character gain ⁄ loss bias in phylogenies. Evolution 47: 236–252.
Sattler R, Rutishauser R. 1997. The fundamental relevance of morphology and morphogenesis to plant research. Annals of Botany 80: 571–582.
Schluter D, Price T, Mooers AO, Ludwig D. 1997. Likelihood of ancestor states in adaptive radiation. Evolution 51: 1699–1711.
Shapiro SS, Wilk MB. 1965. An analysis of variance test for normality (complete samples). Biometrika 52: 591–611.
Sinha N. 1997. Simple and compound leaves: reduction or multiplication? Trends in Plant Science 2: 396–402.
Soltis DE, Soltis PS, Chase MW, Mort ME, Albach DC, Zanis M, Savolainen V, Hahn WH, Hoot SB, Fay M. 2000. Angiosperm phylogeny inferred from 18S rDNA, rbcL, and atpB sequences. Botanical Journal of the Linnaean Society 133: 381–461.
Soltis PS, Soltis DE, Chase MW. 1999. Angiosperm phylogeny inferred from multiple genes as a tool for comparative biology. Nature 402: 402–405.
Stoltzfus A. 2006. Mutation-biased adaptation in a protein NK model. Molecular Biology and Evolution 23: 1852–1862.
Swofford DL. 1998. PAUP: phylogenetic analysis using parsimony (*and other methods), Version 4.0d64 ed. Sunderland, MA, USA: Sinauer Associates, Inc. Publishers.
Vogel S. 1968. ‘‘Sun leaves’’ and ‘‘shade leaves’’: differences in convective heat dissipation. Ecology 49: 1203–1204.
Wagner GP, Stadler PF. 2003. Quasi-independence, homology and the unity of type: a topological theory of characters. Journal of Theoretical Biology 220: 505–527.
Wernegreen JJ, Funk DJ. 2004. Mutation exposed: a neutral explanation for extreme base composition of an endosymbiont genome. Journal of Molecular Evolution 59: 849–858.
Wiemann MC, Manchester SR, Dilcher DL, Hinojosa LF, Wheeler EA. 1998. Estimation of temperature and precipitation from morphological characters of dicotyledonous leaves. American Journal of Botany 85: 1796–1802.
Wojciechowski MF, Lavin M, Sanderson MJ. 2004. A phylogeny of legumes (Leguminosae) based on analysis of the plastid matK gene resolves many well-supported subclades within the family. American Journal of Botany 91: 1846– 1862.
Wolfe JA. 1995. Paleoclimatic estimates from Tertiary leaf assemblages. Annual Review of Earth and Planetary Sciences 23: 119–142.
Supporting Information
Additional supporting information may be found in the online version of this article.
Fig. S1 Phylogenetic tree of angiosperms (560 taxa) showing evo-lution of leaf form, coding D.
Fig. S2 Phylogenetic tree of Solanum showing evolution of leaf form, coding A.
Fig. S3 Phylogenetic tree (internal transcribed spacer (ITS) data) of Lepidium showing evolution of leaf form, coding A.
Fig. S4 Phylogenetic tree (chloroplast DNA (cpDNA) data) of Lepidium showing evolution of leaf form, coding A.
Fig. S5 Phylogenetic tree of Apiales showing evolution of leaf form, coding A.
Fig. S6 Phylogenetic tree of Sapindales showing evolution of leaf form, coding A.
Fig. S7 Phylogenetic tree of Papaveraceae showing evolution of leaf form, coding A.
Fig. S8 Phylogenetic tree of Fabaceae showing evolution of leaf form, coding C.
Table S1 List of 560 taxa and scored character states Table S2 Summary of unrestricted models
Table S3 Ancestral states, maximum likelihood (ML) analyses Table S4 Stasis and change, maximum parsimony (MP) analyses Table S5 Evolutionary rates, maximum likelihood (ML) analyses Notes S1 Additional coding schemes analysed.
Please note: Wiley-Blackwell are not responsible for the content or functionality of any supporting information supplied by the authors. Any queries (other than missing material) should be directed to the New Phytologist Central Office.