• Nenhum resultado encontrado

Effects of State Action on Health: a regionalized analysis of Brazil / Efeitos da ação do Estado na saúde: uma análise regionalizada do Brasil

N/A
N/A
Protected

Academic year: 2020

Share "Effects of State Action on Health: a regionalized analysis of Brazil / Efeitos da ação do Estado na saúde: uma análise regionalizada do Brasil"

Copied!
24
0
0

Texto

(1)

Braz. J. of Develop.,

Curitiba, v. 6, n. 10, p.77879-77902,oct. 2020. ISSN 2525-8761

Effects of State Action on Health: a regionalized analysis of Brazil

Efeitos da ação do Estado na saúde: uma análise regionalizada do Brasil

DOI:10.34117/bjdv6n10-279

Recebimento dos originais: 13/09/2020

Aceitação para publicação: 14/10/2020

Marina do Amaral Schenkel

Mestra em Políticas Públicas pela UFRGS

Instituição: Secretaria Estadual de Saúde do Rio Grande do Sul

Av. Borges de Medeiros, 1501. 6º andar, Porto Alegre, RS

E-mail: marina.827@hotmail.com

Soraya Maria Vargas Cortes

Doutora em Social Policy and Administration pela London School of Economics and Political

Science

Instituição: Universidade Federal do Rio Grande do Sul

Av. Bento Gonçalves, nº9500 - Prédio 43.311 - Sala 109 –Porto Alegre, RS.

E-mail: vargas.cortes@ufrgs.br

(2)

Braz. J. of Develop.,

Curitiba, v. 6, n. 10, p.77879-77902,oct. 2020. ISSN 2525-8761

ABSTRACT

This study investigates the effects of State action on health in Brazil, considering social determinants

of health. As a benchmark for population health outcomes, we adopted the Infant Mortality Rate

(IMR). The research method is quantitative, with a quasi-experimental design. It is an ecological

study using the 438 Brazilian health regions as unit of analysis. The data were collected from official

government sources. The main statistical technique adopted was multiple logistic regression

analysis. An outstanding aspect drawn from the results is that all the dimensions that measure state

action used in this study presented statistically significant effects in decreasing the chances of a

region being in a high IMR group, depending on the control variables included in the model. The

only variable that presented a significant effect, considering all other factors of control, was the

prenatal coverage indicator. Another important result was that the socioeconomic situation of the

region had a substantial and significant effect on all models tested when the highest income level

was compared to the lowest. Thus, for a possible reduction of health inequalities, the very

determinants of social inequalities should be taken into account in addition to determinant or

associated health factors. However, it should be noted that state action alone in the health area has

the potential to act in determining the health conditions of the circumscribed population in each

health region, even when considering the unequal distribution of socioeconomic factors in these

territories.

Keywords: Public Policy, Health Policy, Public Expenditures, Healthcare Disparities, Population

Health

RESUMO

Este estudo visa investigar os efeitos da ação do Estado na área da saúde no Brasil considerando os

seus determinantes sociais. A metodologia é de abordagem quantitativa com delineamento quase

experimental. É um estudo ecológico, sendo a unidade de análise a totalidade das 438 regiões de

saúde brasileiras. A técnica estatística principal adotada foi a análise de regressão logística múltipla.

Como indicador de resultado da saúde utilizou-se a Taxa de Mortalidade Infantil (TMI) e para

mensurar a ação do Estado indicadores do gasto público e da oferta e cobertura de ações e serviços

de saúde. Destaca-se dos resultados que todas as dimensões da ação do Estado apresentaram efeitos

estatisticamente significativos para diminuição das chances da região estar no grupo de TMI alta, a

depender das variáveis de controle. O único indicador da ação do Estado que apresentou efeito

significativo considerando todos os fatores de controle é a de Cobertura de pré-natal. Outro

importante resultado obtido é que a situação socioeconômica da região possui efeito substancial e

significativo em todos os modelos testados. Assim, para uma possível diminuição das desigualdades

em saúde além de atentar-se para os fatores determinantes ou associados à saúde, devem ser levados

em conta os próprios determinantes das desigualdades sociais. No entanto, ressalta-se que a ação do

Estado na área da saúde por si só apresenta potencialidade para agir na determinação da condição

de saúde da população circunscrita em cada região de saúde, mesmo considerando a distribuição

desigual dos fatores socioeconômicos nestes territórios.

Palavras-chave: Política Pública, Política de Saúde, Gastos em Saúde, Disparidades nos Níveis de

(3)

Braz. J. of Develop.,

Curitiba, v. 6, n. 10, p.77879-77902,oct. 2020. ISSN 2525-8761

1 INTRODUCTION

One of Brazil’s most striking characteristics is its high inequality in income distribution,

high poverty rate, and a recurring pattern of social exclusion (Medeiros 2005). The unequal

distribution of power and income between individuals and groups has an effect on the uneven

distribution of health and disease (Barata 2009; Girolamo and Martino, 2015).

In this context, the present study investigates the effects of State action on Brazil’s health

area, considering other social determinants of health. More specifically, the aim was to verify if

public health policies had an effect on the chances of a health region presenting a high Infant

Mortality Rate (IMR) or not, comparing these territories with different compositions, levels of

income and poverty, infrastructure and education. IMR has been widely used as an indicator of

health outcomes and is used in this study due to its sensitivity of alteration according to the health

determinants traditionally used.

According to Whitehead (1990), the perception of injustice in the definition of health

inequality becomes more evident in cases where the disadvantages cluster and produce cumulative

effects, resulting with some groups, already in vulnerable circumstances, presenting worse health

conditions than others (Whitehead 1990). Many studies have demonstrated, through indicators, how

inequalities arise in Brazil and around the world. In the global scenario, one can mention two

ecological studies that, when using the IMR as an indicator of health conditions, found there was a

strong association of this indicator with income level and income inequality. One of these studies

observed the states of the United States (Olsom et al 2010) while another looked at different regions

in Italy (Dallolio et al, 2012).

In Brazil, there are several studies on the subject that found varying degrees of inequality in

health, employing several methodologies of analysis. All of them invariably point to the association

of the economic level of the individual or territory with the health level. In general, the studies use

the per capita income in a region as an indicator of socioeconomic level (Fischer et al 2007, Noronha

and Andrade 2002, Dachs, 2002, Lima-Costa et al 2006), as well as GDP per capita (Fischer et al.

2007), and schooling (Fischer et al 2007, Noronha and Andrade 2002). Infant mortality rates are

used as a measurement of the health status of individuals and groups (Carvalho et al., 2006; Silva et

al., 2007), and there are those that use self-assessment measures (Dachs 2002, Lima et al., 2006),

morbidity measures (Noronha and Andrade 2002) and other mortality rates (Franca 2001,

Guimarães et al 2001). Some of the studies used individuals as a unit of analysis (Carvalho et al.,

2001) and through the usage of aggregated data, comparisons were made between intra-municipal

(4)

Braz. J. of Develop.,

Curitiba, v. 6, n. 10, p.77879-77902,oct. 2020. ISSN 2525-8761

municipal administrative regions (Guimarães 2001; Silva et al 1999), municipalities (Fischer et al

2007), states (Noronha and Andrade 2002) and Brazilian macro-regions (Dachs 2002).

Unlike the above mentioned studies, the present study includes the variable of the State

within the scope of the Unified Health System (UHS) in its analysis. The 1988 Federal Constitution

in Brazil established the improvement of the health of the Brazilian population, as well as universal

and equitable access to health goods and services, as a State duty. It was the responsibility of the

UHS to implement this plan, by creating a decentralized and comprehensive health system.

The initial efforts to organize the health system were anchored on the decentralization of

resources and functions to municipalities. Instead of a national health system (such as in Britain or

Cuba) or a provincial one (Canada), and under the influence of the municipalist movement, the

decentralized system instituted in Brazil transferred the main responsibility for the organization and

management of health services under their territorial jurisdiction to municipalities. Given the fact

that the country consists of 5,570 autonomous municipalities - and that the great majority of these

are small - the lack of inter-municipal articulation, as well as their disparate economic conditions,

led to both fragmentation and inequalities in the system (Abrucio 2006; Giovanella 2016).

The literature indicates that the municipalities alone cannot supply the health care needs of

its population. Basic health services must be widespread; while the more specialized must be

concentrated and centralized (Paim 2009). Health regions were created in 2011 taking into account

the need to better articulate the levels of complexity in the system (Albuquerque and Viana 2015,

Giovanella 2016, Santos and Campos 2015). The health regions are made up of a group of bordering

municipalities, considering cultural, economic and social identities, as well as shared

communication and transport infrastructure (Brazil 2011). Currently there are 438 health regions -

each of these is required to have its own plan for the supply of health goods and services, in which

the participation not only of State actors but also of other agents and institutions from the market

and civil society must be included (Albuquerque and Viana 2015).

Under the current UHS regulatory framework, each health region must be organized in order

to offer the services of (1) primary care; (2) urgency and emergency; (3) psychosocial care; (4)

specialized outpatient and hospital care; and (5) health surveillance (Brazil 2011). Regionalization

is still seen as an ongoing process, albeit in slow progression. Santos and Campos (2015) point out

that, in 2015, only half of the health regions offered 95% or more of the services the population

needs.

One of the objectives of the UHS is that the Brazilian State guarantee the provision of

comprehensive health care to the population. However, the country’s social inequalities in health

(5)

Braz. J. of Develop.,

Curitiba, v. 6, n. 10, p.77879-77902,oct. 2020. ISSN 2525-8761

are very high and historically pervasive. It is this scenario that the present article examines: if and

how public spending on health, as well as the supply and coverage of health services, affects the

health outcomes of the population.

2 METHODS

The design used in this research was quasi experimental, of an explanatory type, and the

approach was quantitative. It is an ecological study in that the unit of analysis is the health regions

of Brazil. The statistical analyses presented are based on the totality of the 438 health regions

throughout the country. Secondary data was retrieved from Brazilian government sources (IBGE

2010 and DATASUS 2012, 2013) for the operationalization of the analytical strategy. The database

used in this research, including the 438 observations, was built on the Stata version 13statistical

analysis software.

The dependent variable chosen to reflect health conditions is the IMR observed between

2013 and 2014, an indicator widely used in studies as a proxy of health outcomes in a given

population (Carvalho et al., 2006; Fischer et al 2007; Silva et al., 1999; Dallolio et al., 2012). To

reach the aims of the study, the IMR was transformed into a dichotomous variable from a relational

approach, comparing the levels of the health regions in Brazil, assuming value one if it is among the

25% highest and zero if it is among the 75% lowest.

Multiple logistic regression analysis was used to explore how each explanatory variable

affects the chances that the event occurs, controlling for the other factors added in the model (Long

and Freese 2001). The research sought to identify the effect of different forms of State action on the

health area (main independent variables) in determining whether a health region has a high IMR

compared to a low IMR (dependent variable), considering the other factors of the health regions

(control variables).

The main independent variables chosen were those that somehow measure State action in

the health area, and that could be related to the dependent variable (IMR). Bivariate analyzes of

logistic regression were performed with the variable IMR in its dummy form as dependent to define

which main independents should enter the models. Except for the population coverage estimated by

the Primary Health Care teams (p = 0.564), all other variables were statistically significant in the

univariate models (p <0.001). From these 3 groups of main variables, different models were

generated with more than one independent / explanatory variable (GUJARATI; PORTER, 2011).

The variables included in addition to the main ones were called control independent and were

(6)

Braz. J. of Develop.,

Curitiba, v. 6, n. 10, p.77879-77902,oct. 2020. ISSN 2525-8761

alternately adjusted in the multiple models to consider the various factors that can also influence the

chances of a region to have a high infant mortality rate.

Understanding that measures are theoretically superimposed on each other in State action in

the regions, and that, therefore, their effects are as well, these were grouped into three dimensions:

(1) Public spending on health per capita (2013) (based on the expenditures of the municipalities that

make up the region); (2) UHS supply: establishments with UHS services per thousand inhabitants

(2012); UHS physicians per thousand inhabitants (2012) and non-medical UHS health professionals

per thousand inhabitants (2012); and (3) UHS services: coverage estimated by the Primary Health

Care teams (2012) and the proportion of live births of mothers with seven or more prenatal

consultations (2012).

The control variables included in the models refer to factors that may contribute to

determining health outcomes among the population and the scenario of health inequalities in Brazil.

These are: (1) Quartile of average household income per capita (2010); (2) Percentage of people

living in households with access to water supply (2010); (3) Percentage of people living in

households with access to sanitary sewage (2010); (4) Number of municipalities in the region

(2017); (5) Demographic density (2010); (6) Brazilian macro-region (assuming value one if the

health region is in the North or Northeast, and zero if it is in the Midwest, South or Southeast); and

(7) Presence of capital municipality (assuming value one if the region has a state capital and zero if

it does not have one).

In order to include such variables, a multicollinearity test was performed: the pairs of

variables with a correlation value equal to or above 0.8 (Gujarati; Porter, 2011) were considered

highly correlated, and these variables were maintained. All data were collected from the 438 health

regions; the only case missing was that of the "Federal District" health region for the variable Public

spending on health.

With the results of the adjusted models, the following selection criteria on the general

adjustment of the estimated models were observed: 1) Specification error test (“linktest” in Stata):

the null hypothesis of the test is that the model has the function correctly specified and indicates

that there is no relevant variable omitted, therefore, the p value of the “hatsq” coefficient does not

it must be significant.

2) Model fit quality test: (a) “log likelihood chi-square (LR chi2)”, which indicates the

significance of the model as a whole, comparing with model only with intercept and (b) Hosmer

and Lemeshow test, which compares the predicted frequency of the observed, being the null

hypothesis that the model is well adjusted.

(7)

Braz. J. of Develop.,

Curitiba, v. 6, n. 10, p.77879-77902,oct. 2020. ISSN 2525-8761

Another test for the significance of the estimated parameters, considered by Long and Freese

(2001) to be a useful resource for regression models, is the Wald test, which allows testing whether

one or more coefficients of the last estimate are simultaneously equal to zero ( null hypothesis). It

can be used to test only one of the coefficients or even the maximum of independent variables for

each model. Therefore, it refers to the individual significance of a partial coefficient in a multiple

regression (GUJARATI; PORTER, 2011). For the models selected in this study, the estimated

parameters of the main independent variables were tested with the Wald test according to the

dimension block in which they were grouped. There were no substantial differences in significance

in relation to the measure already considered (Z test). The results are shown in the supplement

material.

The last consideration regarding the construction of the models to be presented relates to the

possible presence of influential observations. It is known that not every outlier case can be

considered an influential observation, since it depends on its effect on the estimated coefficients in

the model, identified in specific tests and in comparisons with changes in the coefficients presented

without the outlier (LONG; FREESE, 2001).

One measure used for this is Cook's Distance, which, in general, points to the effect of

removing the possible influential observation for all vectors of coefficients (LONG; FREESE,

2001). This measure was analyzed graphically available in the supplement material) for the

estimated models selected so far. As a criterion for deciding whether this measure was too large,

Cordeiro and Lima Neto (2004) apud Agranonik (2006), say that when the values are much lower

than one, the elimination of any observation of the model does not alter the results much. This was

the parameter adopted to analyze this item of the selected models (less than 1), not causing the

elimination of any observation.

Other tests were performed on the generated models (Pearson, Deviance and Studentized

standardized residuals graph and projection matrix) and it was decided to maintain the maximum

number of health regions to make inferences about the research problem. Since the research design

is based on the total number of regions in Brazil, therefore in a population and not in a sample, the

exclusion of some cases based on very strict criteria (and not consensual in the technical literature)

could result in configuring a non-sample representative of Brazil.

The models are presented in the tables in the Results section according to the type of main

independent variables.

(8)

Braz. J. of Develop.,

Curitiba, v. 6, n. 10, p.77879-77902,oct. 2020. ISSN 2525-8761

3 RESULTS

The first dimension of observation of the effects of State action on the health results of the

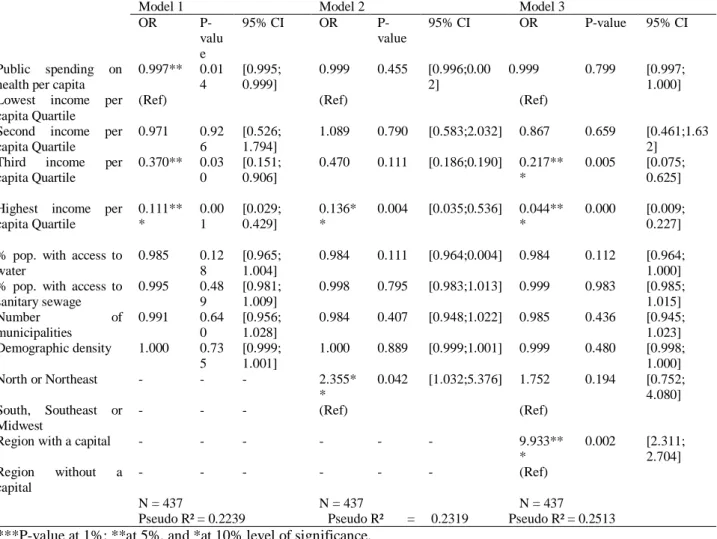
regions was Public spending on health per capita. The Odds Ratios of the binary logistic regressions

with this variable are presented in Table 1.

Table 1. Results in Odds Ratio of the effect of State action of the variable Public Health Spending per capita.

Model 1

Model 2

Model 3

OR

P-valu

e

95% CI

OR

P-value

95% CI

OR

P-value

95% CI

Public spending on

health per capita

0.997**

0.01

4

[0.995;

0.999]

0.999

0.455

[0.996;0.00

2]

0.999

0.799

[0.997;

1.000]

Lowest income per

capita Quartile

(Ref)

(Ref)

(Ref)

Second income per

capita Quartile

0.971

0.92

6

[0.526;

1.794]

1.089

0.790

[0.583;2.032]

0.867

0.659

[0.461;1.63

2]

Third

income

per

capita Quartile

0.370** 0.03

0

[0.151;

0.906]

0.470

0.111

[0.186;0.190]

0.217**

*

0.005

[0.075;

0.625]

Highest income per

capita Quartile

0.111**

*

0.00

1

[0.029;

0.429]

0.136*

*

0.004

[0.035;0.536]

0.044**

*

0.000 [0.009;

0.227]

% pop. with access to

water

0.985

0.12

8

[0.965;

1.004]

0.984

0.111

[0.964;0.004]

0.984

0.112

[0.964;

1.000]

% pop. with access to

sanitary sewage

0.995

0.48

9

[0.981;

1.009]

0.998

0.795

[0.983;1.013]

0.999

0.983 [0.985;

1.015]

Number

of

municipalities

0.991

0.64

0

[0.956;

1.028]

0.984

0.407

[0.948;1.022]

0.985

0.436

[0.945;

1.023]

Demographic density

1.000

0.73

5

[0.999;

1.001]

1.000 0.889

[0.999;1.001]

0.999

0.480

[0.998;

1.000]

North or Northeast

-

-

-

2.355*

*

0.042

[1.032;5.376]

1.752

0.194

[0.752;

4.080]

South, Southeast or

Midwest

-

-

-

(Ref)

(Ref)

Region with a capital

-

-

-

-

-

-

9.933**

*

0.002

[2.311;

2.704]

Region

without

a

capital

-

-

-

-

-

-

(Ref)

N = 437

N = 437

N = 437

Pseudo R² = 0.2239

Pseudo R² = 0.2319

Pseudo R² = 0.2513

***P-value at 1%; **at 5%, and *at 10% level of significance.

The models include an intercept term.

Source: Elaborated by the authors.

Table 1 presents three models with the variable Public spending on health per capita, each

one including more control variables. In Model 1, the variable Public spending on health has a

significant negative effect on the chances of the health region having a high IMR. For each Brazilian

Real spent on health per capita, the odds of a region being in the high IMR category decreased by

0.3% (OR = 0.997 and 95% CI 0.995 - 0.999), holding the remaining variables constant.

Model 1 was used to estimate the probability of the region having a high IMR with a

variation in the level of the Income Quartile and the level of Public spending on health per capita.

In order to do this, the percentiles were selected as the criterion for the spending level. A region was

(9)

Braz. J. of Develop.,

Curitiba, v. 6, n. 10, p.77879-77902,oct. 2020. ISSN 2525-8761

considered presenting low expenditure if it invested the 25th percentile value of the data set (R$

411.21 per inhabitant), while a region with high expenditure invested the value of the 75th percentile

(R$ 631.31 per inhabitant). Table 2 presents the probabilities of Quartile 1 and Quartile 4 regions

having a high IMR, with a variation in the level of public health spending and maintaining the other

control variables of Model 1 in average.

Table 2. Predicted probability of the region being in the high IMR category according to ideal types based on Model 1

of Table 1.

Public spending on health

Low (p25)

High (p75)

Lowest income per capita

Quartile

46%

30%

Highest income per capita

Quartile

9%

4%

* Keeping the following control variables constant in average: percentage of access to water, percentage of access to

sewage, number of municipalities and population density.

(p25 = R$ 411.21 and p75 = R$ 631.31).

Source: Author's elaboration.

Table 2 shows that the variation in public spending on health affects more substantially the

probability of the region being in the high IMR category among the poorest Quartile regions than

among the wealthiest Quartile. The probability of a high IMR for a region in Quartile 1 with low

health expenditure is 46%, while for a region in the same Quartile with high expenditure, the

probability is 30%. Among the wealthiest regions, the probability of having a high IMR is much

lower: 9% for those with low spending and 4% for those with high spending. This result suggests

that the increase in public spending on health has a greater effect on the health conditions in regions

with a lower income per capita.

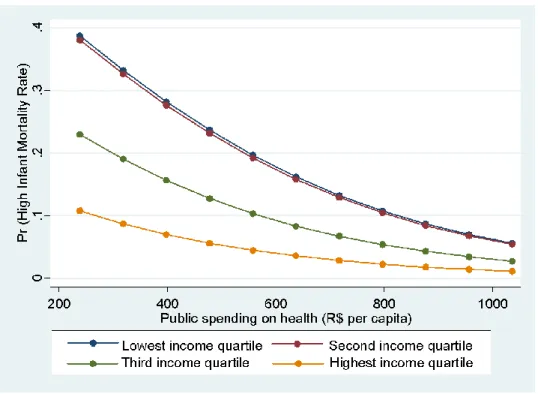
The graph in Figure 1 shows the probabilities of the region presenting a high IMR in each

income Quartile, depending on the Public spending on health per capita, according to the results of

Model 1 (Table 1) and keeping other control variables in the mean.

(10)

Braz. J. of Develop.,

Curitiba, v. 6, n. 10, p.77879-77902,oct. 2020. ISSN 2525-8761

Figure 1. Estimated probabilities of the regions being in the high IMR category based on Model 1* according to the

Income Quartile with the variation of public expenditure on health per inhabitant.

* Keeping the following control variables constant in average: percentage of access to water, percentage of access to

sewage, number of municipalities and population density.

Source: Elaborated by the authors.

Figure 1 shows that as public spending on health (horizontal axis) increases, the differences

between the predicted probabilities for a high IMR for each income Quartile (vertical axis) decreases

substantially. In a hypothetical scenario in which all health regions invested close to the highest

values of public health expenditure per capita (around R$ 1000), the probabilities would not be as

unequal as when they all invested close to the lowest values (around R$ 300), even if they are in

different income Quartiles. Figure 1 also shows that the difference between the probabilities of

Quartiles 3 and 4 (the wealthiest) are very small, regardless of the spending level. While the odds

of the poorest Quartiles present a considerable difference, they visibly decrease with the increase in

public spending on health.

Other studies comparing health spending and health outcomes show different trends. Ramos

and Angel (2010) analyzed the effect of public investments in health on the mortality of the elderly

in the state of Rio Grande do Sul, Brazil. As a result, the indicators that characterize socioeconomic

differences in the state were considered stronger determinants in the mortality of the elderly than

public spending. Castro et al (2015) sought to investigate the UHS expenditure and its effect in the

reduction of inequalities in the municipalities and in planning regions in the same state. The authors

(11)

Braz. J. of Develop.,

Curitiba, v. 6, n. 10, p.77879-77902,oct. 2020. ISSN 2525-8761

pointed out that public spending on health alone did not result in direct improvements in welfare

and did not decrease inequalities between regions.

The authors point out that a possible reason for these results includes the fact that

organization of the health system is hierarchical; thus, when counting municipal expenditure alone,

distorted per capita expenditure information is obtained, since larger municipalities serve the

population of several municipalities (Castro et al 2015; Ramos and Angel, 2010).

Pelegrini and Castro (2012) identify the existence of a significant correlation between life

expectancy and the level of public spending on health, using data from 179 countries. The study

suggests that the increase in health spending has a positive (non-linear) impact on the average life

expectancy of the population. The results of Model 1 (Table 1) are in line with the positive trend

found in Pelegrini and Castro (2012).

However, it should be noted that in Models 2 and 3, to which more control variables were

fitted than in Model 1 (Table 1), the variable Public spending on health per capita does not present

a significant effect in determining the region having a high IMR or not. In these models, the factors

that have the greatest influence on the health outcomes of the population of the region are related to

the average household income per capita of the region, the location in the Brazilian macro-regions,

and the presence of a state capital. In order to further investigate the analysis of State action on the

health area, the same models of Table 1 (Model 1, Model 2 and Model 3) were adjusted, but those

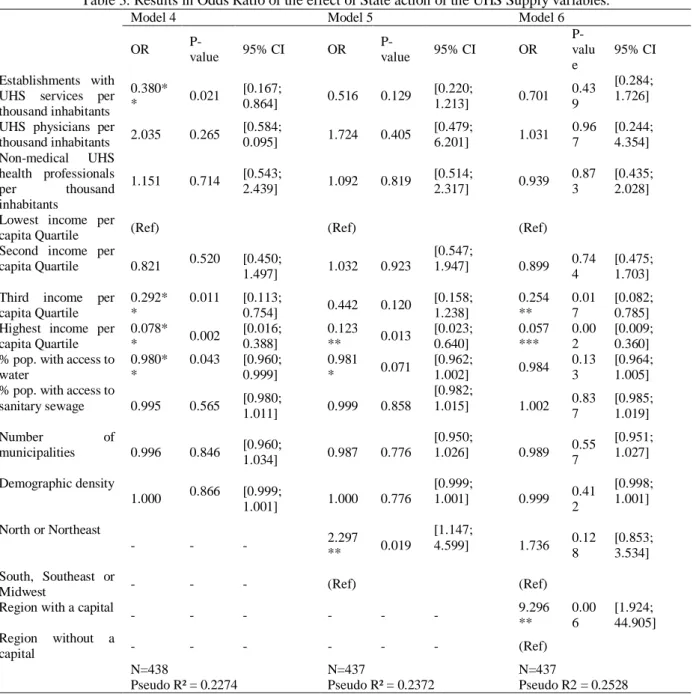
of UHS Supply were included as main variables. The Odds Ratio of these binary logistic regression

models can be seen in Table 3.

(12)

Braz. J. of Develop.,

Curitiba, v. 6, n. 10, p.77879-77902,oct. 2020. ISSN 2525-8761

Table 3. Results in Odds Ratio of the effect of State action of the UHS Supply variables.

Model 4

Model 5

Model 6

OR

P-value

95% CI

OR

P-value

95% CI

OR

P-valu

e

95% CI

Establishments with

UHS services per

thousand inhabitants

0.380*

*

0.021

[0.167;

0.864]

0.516

0.129

[0.220;

1.213]

0.701

0.43

9

[0.284;

1.726]

UHS physicians per

thousand inhabitants

2.035

0.265

[0.584;

0.095]

1.724

0.405

[0.479;

6.201]

1.031

0.96

7

[0.244;

4.354]

Non-medical

UHS

health professionals

per

thousand

inhabitants

1.151

0.714

[0.543;

2.439]

1.092

0.819

[0.514;

2.317]

0.939

0.87

3

[0.435;

2.028]

Lowest income per

capita Quartile

(Ref)

(Ref)

(Ref)

Second income per

capita Quartile

0.821

0.520

[0.450;

1.497]

1.032

0.923

[0.547;

1.947]

0.899

0.74

4

[0.475;

1.703]

Third income per

capita Quartile

0.292*

*

0.011

[0.113;

0.754]

0.442

0.120

[0.158;

1.238]

0.254

**

0.01

7

[0.082;

0.785]

Highest income per

capita Quartile

0.078*

*

0.002

[0.016;

0.388]

0.123

**

0.013

[0.023;

0.640]

0.057

***

0.00

2

[0.009;

0.360]

% pop. with access to

water

0.980*

*

0.043

[0.960;

0.999]

0.981

*

0.071

[0.962;

1.002]

0.984

0.13

3

[0.964;

1.005]

% pop. with access to

sanitary sewage

0.995

0.565

[0.980;

1.011]

0.999

0.858

[0.982;

1.015]

1.002

0.83

7

[0.985;

1.019]

Number

of

municipalities

0.996

0.846

[0.960;

1.034]

0.987

0.776

[0.950;

1.026]

0.989

0.55

7

[0.951;

1.027]

Demographic density

1.000

0.866

[0.999;

1.001]

1.000

0.776

[0.999;

1.001]

0.999

0.41

2

[0.998;

1.001]

North or Northeast

-

-

-

2.297

**

0.019

[1.147;

4.599]

1.736

0.12

8

[0.853;

3.534]

South, Southeast or

Midwest

-

-

-

(Ref)

(Ref)

Region with a capital

-

-

-

-

-

-

9.296

**

0.00

6

[1.924;

44.905]

Region without a

capital

-

-

-

-

-

-

(Ref)

N=438

N=437

N=437

Pseudo R² = 0.2274

Pseudo R² = 0.2372

Pseudo R2 = 0.2528

***P-value at 1%; **at 5%, and *at 10% level of significance.

The models include an intercept term.

Source: Elaborated by the authors.

It should be noted that the only significant variable regarding State action in the UHS Supply

Dimension (Table 3) is that of UHS Establishments per thousand inhabitants, in Model 4. For each

health establishment per thousand inhabitants, the chances of a region presenting a high IMR

decreases 62% (OR 0.38 and 95% CI 0.167 - 0.864), holding other variables constant (Model 4 in

Table 3). This trend suggests the same findings on public spending on health in Model 1 (Table 1).

It is observed that the variables regarding the presence of physicians and other health professionals

per thousand inhabitants do not have significant effects in any of the models estimated to explain

the determination of a high IMR.

(13)

Braz. J. of Develop.,

Curitiba, v. 6, n. 10, p.77879-77902,oct. 2020. ISSN 2525-8761

Finally, the State action dimension in health was tested with some indicators of services

offered by the UHS that could have effects on infant mortality: Estimated coverage of Primary Care

and Percentage of live births of mothers with seven or more prenatal consultations. The Odds Ratio

results of the models with this set of variables can be observed in Table 4.

Table 4. Results in Odds Ratio of the effect of the State action of the UHS Goods and Services variables.

Model 7

Model 8

Model 9

OR

P-value

95% CI

OR

P-value

95% CI

OR

P-value

95% CI

Coverage

of

Primary

Health

Care

0.999

0.949

[0.981;

1.018]

1.000

0.992

[0.981;

1.019]

0.999

0.918

[0.980;

1.018]

Proportion of live

births of mothers

with seven or more

prenatal

consultations

0.949**

*

0.000

[0.930;

0.970]

0.953

***

0.000

[0.932;

0.975]

0.958**

*

0.000

[0.936;

0.980]

Lowest income per

capita Quartile

(Ref)

(Ref)

(Ref)

Second income per

capita Quartile

0.873

0.673

[0.463;

1.644]

0.953

0.887

[0.489;

1.856]

0.799

0.513

[0.407;

1.567]

Third income per

capita Quartile

0.326**

0.016

[0.132;

0.810]

0.385

*

0.060

[0.142;

1.043]

0.206**

0.006

[0.068;

0.629]

Highest income per

capita Quartile

0.101**

0.002

[0.025;

0.417]

0.120

**

0.005

[0.028;

0.519]

0.046**

*

0.000

[0.008;

0.257]

% pop. with access

to water

0.988

0.276

[0.988;

1.019]

0.988

0.273

[0.968;

1.009]

0.989

0.296

[0.968;

1.010]

% pop. with access

to sanitary sewage

1.003

0.685

[0.988;

1.019]

1.004

0.617

[0.988;

1.020]

1.005

0.556

[0.989;

1.021]

Number

of

municipalities

0.992

0.666

[0.954;

1.031]

0.988

0.559

[0.950;

1.028]

0.990

0.610

[0.952;

1.030]

Demographic

density

1.000

0.943

[0.999;

1.001]

1.000

0.966

[0.999;

1.001]

0.999

0.450

[0.998;

1.001]

North or Northeast

-

-

-

1.365

0.417

[0.644;

2.892]

1.015

0.970

[0.468;

2.19]

South, Southeast or

Midwest

-

-

-

(Ref)

(Ref)

Region

with

a

capital

-

-

-

-

-

-

6.982**

0.010

[1.597;

30.530]

Region without a

capital

-

-

-

-

-

-

N = 438

N = 437

N = 437

Pseudo R² = 0.2680

Pseudo R² = 0.2685

Pseudo R² = 0.2819

***P-value at 1%; **at 5%, and *at 10% level of significance.

The models include an intercept term.

Source: Elaborated by the authors.

It is observed that the variable Coverage estimated by the Primary Health Care teams does

not have a significant effect in determining the chances of the region having a high IMR. However,

the variable Proportion of live births of mothers with seven or more prenatal care consultations has

a significant effect on the dependent in the three adjusted models, regardless of the control factors

inserted.

(14)

Braz. J. of Develop.,

Curitiba, v. 6, n. 10, p.77879-77902,oct. 2020. ISSN 2525-8761

It should be emphasized that, when its distribution across the national territory is analyzed,

Primary Health Care is highlighted in the literature as one of the forms of care that most favored the

regions and population segments with higher health needs (Viana and Silva 2017; Ugá et al. 2003).

According to Viana and Silva (2017), this is due to the expansion of the Family Health Strategy in

the second half of the 1990s, which first took place in small municipalities in the Northeast region.

Mesa-Lago (2007) points out that the expansion of the Family Health Strategy, focused on poor

municipalities, is one of the most favorable mechanisms towards equity in the UHS. This can be

inferred as a possible reason for not having a significant effect in determining high infant mortality

rates, precisely because the highest coverage can be found in regions with the lowest per capita

income and poorest localities, where there is also less public expenditure in general.

Model 9 in Table 4, which contains all included control variables (saturated model), presents

the highest Pseudo R² among all models analyzed in the study (0.28). The main variable of Prenatal

Coverage has a significant effect: each added percentage of live births whose mothers had the

minimum number of UHS consultations in a region decreases the chance of the region having a high

IMR by 4.2% (OR 0.958 and 95% CI 0.936 - 0.980), keeping other factors constant.

Though expected, it should be highlighted that this result suggests that greater prenatal

coverage, even in regions with lower levels of per capita income, is a State action in health which

presents a statistically significant effect in reducing the chances of a high rate of childhood deaths.

This model was used to estimate the probabilities of presenting a high IMR considering regions at

opposite income levels (Quartile 1 and Quartile 4), with varying levels of prenatal coverage; the

results are shown in Table 4. As a criterion for prenatal coverage level, one-off values were used:

the 25th percentile (51.94%) corresponds to a region with a low coverage of women who attended

seven or more visits, and the 75th percentile (75.06%) to a high coverage.

Table 5. Probability predicted of the health region being in the high IMR category according to ideal types according to

Model 7 * of Table 14.

Proportion of live births of mothers with seven or

more prenatal consultations

Low (p25)

High(p75)

Lowest

income

per

capita Quartile

55%

31%

Highest

income

per

capita Quartile

5%

2%

* Maintaining in average the following factors: Primary Health Care coverage, % pop. with access to water, % pop.

with access to sanitary sewage, Number of municipalities, Demographic density, Macro-region and presence of capital.

(p25 = 51.94% and P75 = 75.06%).

Source: Elaborated by the authors.

(15)

Braz. J. of Develop.,

Curitiba, v. 6, n. 10, p.77879-77902,oct. 2020. ISSN 2525-8761

Table 5 shows that, regardless of the prenatal coverage level, the probabilities are much

lower for regions of the highest income Quartile than for those of the lowest income Quartile.

However, it should be pointed out that in the group of poorer regions, those with high prenatal

coverage were less likely (31%) to be in the high IMR category than those in the first Quartile (55%

probability) keeping other factors at an average level. In the group of the wealthiest regions, those

with low coverage had a 5% probability of having a high IMR, which with high coverage, decreased

to 2%, controlling for other variables. The variable Proportion of live births of mothers with seven

or more prenatal consultations is the only variable of State action that has a significant effect, even

when considering all other determinants of health included in this study.

As for the controlling variables, those with significant and substantial effects on the

determination of a high IMR should be highlighted, controlling for the three dimensions of State

action in the health area here analyzed. One can observe that the regions in the highest income per

capita Quartile are generally less likely to have a high IMR when compared to those in the lowest

Quartile, regardless of the other variables adjusted in the models.

In Model 1 (Table 1), the chances of a region of the 3rd Quartile of having a high IMR is

reduced by 63% when compared to that of a region of the lower income Quartile (OR = 0.370 and

95% CI 0.151; 0.906); whereas the chances of being in the high IMR category of a region in the

highest income Quartile compared to those in a lower Quartile region (OR = 0.111 and 95% CI

0.029 - 0.429) decreased by 89%, maintaining public spending on health and other factors

controlled. A similar behavior is observed in Table 3 when analyzing the supply dimension of the

UHS. The chancesof a region in the 3rd Quartile of having a high IMR (OR 0.292 and 95% CI 0.113

- 0.754)decreased by 70%, and in the 4th Quartile by 92% (OR 0.078 and 95% CI 0.016 - 0.388),

in relation to a region of the lowest income Quartile, controlling for the other variables in Model 4.

The same trend was found in the results with health services. Model 9 (Table 4) estimates that

keeping Primary Health Care and Prenatal Coverage and other variables constant, the regions in

Quartile 3 decreased their odds of being in the high IMR category by 79% (OR 0.206 and 95% CI

0.068 - 0.629) when compared to those in the poorest Quartile, while the chances of those in the

wealthiest Quartile of having a high IMR decreased by 95% (OR 0.046 and 95% CI 0.008 - 0.257).

The explanatory potential of income levels in determining the population’s health conditions

is in alignment with results found in other studies on the social determinants of health (WHO 2008;

Shaw et al 2006). In this case, the health regions of the two richest income groups (Quartile 3 and

4) have a substantially lower chance of being in the group of regions with a high IMR than the

poorest Quartile regions. On the other hand, the difference in the chances of having a high IMR

(16)

Braz. J. of Develop.,

Curitiba, v. 6, n. 10, p.77879-77902,oct. 2020. ISSN 2525-8761

between the 2nd Quartile and those of the 1st Quartile of income was not significant in any of the

estimated models.

As for the effect of the variable Presence of capital city in the health region, the opposite of

what was expected was found to a substantial and significant degree. A region with a state capital

is 6 to 9 times more likely to be classified as having a high IMR than a region without a capital.

Model 3 (Table 1) indicates that the chances health regions that include a Brazilian state capital of

having a high IMR increased by 890% (OR 9.93 and 95% CI 2.311 - 42.704) in comparison to those

without a state capital, keeping all control factors constant. Likewise, Model 9 (Table 4) estimates

that the chance of an IMR category increase in regions with a capital is 598.2% (OR 6,982 and 95%

CI 1,597 - 30,530) when compared to those without a capital, maintaining other variables constant.

This suggests that the result should be tested further by using other statistical models. However,

provisional interpretation may be possible: there are places with such precarious living conditions

in the metropolitan areas of capitals that this could be the cause of such an increase in the IMR.

The effect of the variable Brazilian macro-region presented the expected result, but only in

some of the adjusted models. In Model 2, when analyzing the public health spending dimension

(Table 1), it is observed that the odds of a high IMR of a health region located in the North or

Northeast of the country is increased by 136% (OR 2.36 and 95% CI 1.032 - 5.376) when compared

to those of the South, Southeast or Midwest, keeping other variables constant. In Model 5 of Table

3, considering the supply dimension of the UHS, it is estimated that the chances of the health regions

located in the North or Northeast of being among those with a high IMR were increased by 129%

(OR 2,297 and 95% 1,147 - 4,599), compared to the regions in the rest of Brazil, keeping other

variables constant. A possible explanation for this effect can be attributed to the fact that the North

and Northeast macro-regions have the highest levels of poverty in Brazil, in comparison to the others

(Gacituá-Marió and Woolcock 2005).

Regarding housing conditions, the variable people residing in households with access to

water supply had a significant effect in determining the region's chances of having a high IMR only

in the models with the UHS supply dimension. Model 4, in Table 3, estimates that for every 1% of

people living in households with access to water supply in the region, the chances of having a high

IMR decreases by 2% (OR 0.980 and 95% CI 0.960 - 0.999), keeping other variables constant.

4 CONCLUSION

Social inequalities, both in income and health, are to some extent present in all societies.

Health conditions are not dissociated from other aspects of social life. Literature on the subject

(17)

Braz. J. of Develop.,

Curitiba, v. 6, n. 10, p.77879-77902,oct. 2020. ISSN 2525-8761

points out that health inequalities are linked to political and economic decisions at the national and

international levels, as well as issues such as globalization, economic growth and others (Coburn

and Coburn 2014). Thus, State choices in how to distribute resources in terms of the different areas

of public policies, as well as among regions in the national territory, influence the population’s

quality of life. In analyzing how the State can address such health inequalities, it also examines the

effects caused by its actions, as well as indications as to the types of policies that can be adopted.

It should be noted that the indicator used to measure the socioeconomic situation of the

(Quartile of income per capita) region has a substantial and significant effect on all the models

tested. This corroborates the notion that the effect of a low-income level on the population’s health

status cannot be ignored and has been a prominent issue in the literature on social inequalities in

health (Oslon et al 2010; Dallolio et al. 2012). Furthermore, the distribution of other public services

also tends to be unfavorable to the poorest regions:the population living in these regions is often

deprived of material resources, such as access to infrastructure and adequate housing conditions,

resulting in the tendency to present higher levels of childhood deaths.

We can thus reflect on a cumulative effect of inequalities; in general, lower income regions

also have fewer public health services. Therefore, the levels of health inequalities are identified as

resulting from the socioeconomic inequality between territories, but also from the inequality

regarding the health system’s provision of goods and services.

At the same time, it should be emphasized that all dimensions of State action used in this

study somehow had statistically significant effects to decrease the chances of a region being in a

high IMR group. The only variable that has an effect, considering all the study’s control factors, is

UHS prenatal coverage, which has a more direct connection with Infant Mortality. This begs the

conclusion that the State has the potential to act in determining the health conditions of the

circumscribed population in each health region, regardless of the unequal distribution of

socioeconomic factors among these territories.

If the goal of the UHS is to reduce inequalities in health, in addition to a minimally equitable

provision of goods and services in all territories, the Brazilian State must act beyond the scope of

health in order to improve the living conditions of the population in the poorest territories, which

necessarily implies focusing on income distribution in Brazil. Thus, in addition to looking at the

determinants associated with health inequities, an improvement in reducing health inequalities

would only be possible by tackling the very determinants of social inequalities (Coburn and Coburn,

2014). Nevertheless, state action in the area of health alone shows important effects on the

population's living conditions.

(18)

Braz. J. of Develop.,

Curitiba, v. 6, n. 10, p.77879-77902,oct. 2020. ISSN 2525-8761

REFERENCES

Abrucio, L.2006. Para além da descentralização: os desafios da coordenação federativa no Brasil.

In: Fleury, Sonia (org). Democracia, descentralização e desenvolvimento: Brasil e Espanha. Rio

de Janeiro: FGV.

Agranonik, Marilyn. Técnicas de Diagnóstico Aplicadas ao Modelo de Regressão Logística. [s. l.].

Trabalho de conclusão de graduação. Universidade Federal do Rio Grande do Sul. Instituto de

Matemática.

Curso

de

Estatística:

Bacharelado.

2006.

Disponível

em:

<http://www.lume.ufrgs.br/handle/10183/128182>. Acesso em 16 de jan. de 2018.

Albuquerque, M, Viana, A. 2015. Perspectivas de região e redes na política de saúde

brasileira. Saúde debate, Rio de Janeiro, v.39, n. spe, p. 28-38.

http://dx.doi.org/10.5935/0103-1104.2015S005390.

Barata, R. 2009. Como e por que as desigualdades sociais fazem mal à saúde [online]. Rio de

Janeiro: Editora FIOCRUZ. Temas em Saúde collection. 120 p. ISBN 978-85-7541-391-3.

AvailablefromSciELO Books

Brasil, Decreto 7508 de 28 de junho de 2011. 2011. Regulamenta a Lei no 8.080, de 19 de setembro

de 1990, para dispor sobre a organização do Sistema Único de Saúde - SUS, o planejamento da

saúde, a assistência à saúde e a articulação interfederativa, e dá outras providências. Diário Oficial

da União.

Carvalho, R et al. 2015.Desigualdades em saúde: condições de vida e mortalidade infantil em região

do nordeste do Brasil. Rev. Saúde Pública, São Paulo , v. 49, 5

Coburn, D, Coburn, E. 2014. Saúde e Desigualdades em Saúde em um Mundo Globalizado

Neoliberal. In: Aspetos Econômicos da Equidade em Saúde. Rio de Janeiro: Editora Fiocruz.

Dachs, J. 2002. Determinantes das desigualdades na auto-avaliação do estado de saúde no Brasil:

análise dos dados da PNAD/1998. Ciência&SaúdeColetiva, 7(4): 641-657

Dallolio, S. et al. Socio-economic factors associated with infant mortality in Italy: an ecological

study. 11, [s. l.], v. 45, p. 1–5, 2012.

Fischer et al. 2007. A mortalidade infantil no Brasil: série histórica entre 1994-2004 e associação

com indicadores socioeconômicos em municípios de médio e grande porte. Medicina (Ribeirão

Preto).40:559

Giovanella,

L.

2016.

Regionalização

deve

diminuir

desigualdades.

http://www.resbr.net.br/regionalizacao-deve-diminuir-desigualdades.WK70j9LyjIU. Acessado em

23 Fev. 2017

Gacitúa-Marió, Woolcock, M. 2005. Uma avaliação da exclusão social e da mobilidade no Brasil.

In: ______, organizadores. Exclusão social e mobilidade no Brasil. Brasília, DF: IPEA, Banco

Mundial; p. 15- 43

(19)

Braz. J. of Develop.,

Curitiba, v. 6, n. 10, p.77879-77902,oct. 2020. ISSN 2525-8761

Giroalmo, C.; Martino, A. 2015. Desigualdades em Saúde: ideias para uma reflexão teórica. In:

Merhy, E.; Stefanini, A.; Martino, A. Problematizando Epistemologias na Saúde Coletiva: Saberes

da Cooperação Brasil e Itália. Porto Alegre : Rede UNIDA; Bolonha: CSI-Unibo. 17-37.

Gujarati, D. N.; Porter, D. C. 2011. Econometria Básica. 5nd. ed. [s.l.]: AMGH Editora Ltda.

Guimarães, Z et al. 2001. Declínio e desigualdades sociais na mortalidade infantil por diarréia. Rev.

Soc. Bras. Med. Trop., Uberaba, v.34, n. 5, p. 473-478.

Long, J, Freese, J. 2001. R EGRESSION M ODELS FOR C ATEGORICAL D EPENDENT V

ARIABLES USING S TATA. [s.l.] : Stata Press.

Lima-Costa et al A. 2006. A. Evolução das desigualdades sociais em saúde entre idosos e adultos

brasileiros: um estudo baseado na Pesquisa Nacional por Amostra de Domicílios (Pnad 1998, 2003).

Ciência & Saúde Coletiva, 11(4): 941-950.

Medeiros, M. O que faz os ricos ricos: o outro lado da desigualdade brasileira. São Paulo: Editora

Hucitec, 2005. 300 p.

Mesa-Lago, C. 1992. O sistema de saúde brasileiro: seu impacto na pobreza e na desigualdade.

ABACO. Revista de Cultura y CienciasSociales, [s. l.], v. 41, n. 1992, p. 115–131.

Noronha, K, Andrade, M. 2002. ‘Desigualdades sociais em saúde: evidências empíricas sobre o caso

brasileiro’, Revista Econômica do Nordeste 32(Especial), 877–897.

Olson et al. 2010. Impact of Income and Income Inequality on Infant Health Outcomes in the

United States. Pediatrics, [s. l.], v. 126, n. 6, p. 1165–1173.

Castro, et al. 2015. Saúde, Desenvolvimento Econômico e Desigualdade nos Municípios do Rio

Grande do Sul: um Estudo sobre Gasto Público e Idese. Análise Econômica,,ano 33, n. 64, p. 7-26.

Pelegrini, Castro. 2012. J. D. Expectativa de Vida e Gastos públicos em saúde. Revista Análise

Econômica - E-ISSN: 2176-5456.

Paim, J.S.2009. O que é o SUS. Rio de Janeiro: Fiocruz.

Ramos, M, Angel, J.. 2010. Os investimentos públicos em saúde e a mortalidade dos idosos no sul

do Brasil: uma análise regionalizada. Redes, v. 15, n. 1, p. 89-103.

Santos, L, Campos, G. 2015. SUS Brasil: a região de saúde como caminho. Saúde Sociedade.v.24,

n.2, p.438-446.

Shaw, M. et al. 2006. Poverty, social exclusion, and minorities. In: MARMOT, M.; WILKINSON,

R., Ed(s).Social Determinants of Health. Oxford University Press.

Silva, L. M. et al. 1999. Desigualdades na mortalidade, espaço e estratos sociais. Rev. Saúde

(20)

Braz. J. of Develop.,

Curitiba, v. 6, n. 10, p.77879-77902,oct. 2020. ISSN 2525-8761

Ugá, Maria Alícia, et al. 2003. Descentralização e alocação de recursos no âmbito do Sistema Único

de Saúde (SUS). Ciência&SaúdeColetiva. v. 8. n. 2. p. 417-437.

Viana; Silva, H., Saúde e Desenvolvimento no Brasil : Argumentos para promover a cidadania em

tempos difíceis. planejamento e políticas públicas, [s. l.], v. n. 49.

Whitehead M. 1990.The concepts and principles of equity and health. Copenhagen.

Whitehead, M. 1990.The concepts and principles of equity and health. Copenhagen

WHO. 2008. Commission on Social Determinants of Health. Closing the gap in a generation,

Geneva: World Health Organization.

Imagem

Table 1. Results in Odds Ratio of the effect of State action of the variable Public Health Spending per capita
Figure 1. Estimated probabilities of the regions being in the high IMR category based on Model 1* according to the  Income Quartile with the variation of public expenditure on health per inhabitant
Table 3. Results in Odds Ratio of the effect of State action of the UHS Supply variables
Table 4. Results in Odds Ratio of the effect of the State action of the UHS Goods and Services variables

Referências

Documentos relacionados

Assim, o objetivo deste estudo foi comparar a epidemiologia espaço-temporal da mortalidade por DTA na 16ª Regional de Saúde/RS, no estado do Rio Grande do Sul e no Brasil,

É preciso lembrar que a ausência de sintomas típicos não exclui o diagnóstico da DRGE, uma vez que outras manifestações relacionadas com o refluxo gastroesofágico têm sido

Devido ao condicionamento estrutural da camada de carvão Barro Branco nesta área, pode-se constatar que bocas de mina que serão tamponadas constituem exutórios para as águas

2.4 Reunião às 17h30: Carlos Borges da Silva Junior, Marilyn Mafra Klamt, Charlene Bezerra dos Santos, Daniele Souza Freitas Pacheco e Isabel Maria

f) 1 (um) Centro de Reabilitação – CER tipo II, com especialidade em reabilitação física e auditiva no município de Fortaleza. g) 1 (um) Centro de Reabilitação – CER tipo

No quadro SELECIONE UMA EMPRESA, será listado os estabelecimentos matriz e filiais se houver, ao selecionar a entidade, deve preencher os campos: ESTOQUE INICIAL, ESTOQUE

em cor de amizade e jardim. Meus amigos estão construindo um mundo aéreo para mim. Mãos tão frágeis levantam muros, corpos voantes transportam ruas, todos num silêncio conjunto

Tomando como fundamento as conclusões até aqui realizadas, insta retomar a problemática central da presente pesquisa que, partindo da hipótese de que os Conselhos