Sensitivity analysis of the AquaCrop parameters
for rainfed corn in the South of Brazil
Luiz Carlos Pittol Martini(1)
(1)Universidade Federal de Santa Catarina, Departamento de Engenharia Rural, Rodovia Admar Gonzaga, no 1.346, CEP 88034-000 Florianópolis, SC, Brazil. E-mail: luiz.martini@ufsc.br
Abstract – The objective of this work was to perform a sensitivity analysis of the main input parameters required for the AquaCrop water balance model, using biomass and grain yield data of a rainfed-simulated corn crop, obtained along the climate data series of 1987–2016 in the South of Brazil. The levels of soil-water stress and the depths of maximum effective rooting were the input parameters that most affected the biomass and grain yields simulated by the model, followed by the crop coefficient, water-use efficiency, soil water storage capacity, and contribution of groundwater to water availability in the root zone. The parameters crop cycle duration, plant density, pattern of soil-water extraction, and field surface practices showed little or no impact on the final results. AquaCrop is a robust water balance model, with small or moderate general sensitivity to variations of the main input parameter values, which makes it applicable to situations with field data limitations.
Index terms: calibration, crop model, drought, simulation, soil-water balance, soil-water stress.
Análise de sensibilidade de parâmetros do AquaCrop
para milho de sequeiro no Sul do Brasil
Resumo – O objetivo deste trabalho foi realizar uma análise de sensibilidade para os principais parâmetros de entrada requeridos pelo modelo de balanço hídrico AquaCrop, por meio de dados de produtividade de biomassa e de grãos de milho de sequeiro obtidos ao longo da série temporal de dados meteorológicos de 1987–2016 no Sul do Brasil. Verificou-se que os níveis de estresse hídrico do solo e a máxima profundidade efetiva do sistema radicular são os parâmetros de entrada que mais afetaram as produções de biomassa e grãos simuladas pelo modelo, seguidos pelo coeficiente de cultura, pela eficiência de uso da água, pela capacidade de armazenamento de água no solo e pela contribuição da água subterrânea para disponibilidade de água na zona radicular. Os parâmetros duração do ciclo, densidade de plantas, padrão de extração de água do solo pelo sistema radicular e práticas de manejo da superfície do terreno mostraram impactos pequenos ou nulos nos resultados finais. O AquaCrop é um modelo de balanço hídrico robusto, com sensibilidade geral de pequena a moderada às variações nos valores dos principais parâmetros de entrada, o que o torna aplicável a situações de carência de dados de campo.
Termos para indexação: calibração, modelo de cultivo, seca, simulação, balanço hídrico do solo, estresse hídrico do solo.
Introduction
Soil-water balance is an important tool for the management of rainfed and irrigated crops that has been receiving quantitative and qualitative improvements. Older soil-water balance models are based on simple accounting methods to assess the inflow and outflow of water in the soil-plant-atmosphere system. In these models, a portion of the rain infiltrates the soil, the plants absorb the water stored in the root zone, and the moisture is released back into the atmosphere through transpiration. In the simplest form, like the
Thornthwaite-Mather’s classical model (Thornthwaite & Mather, 1955), a soil-water balance is assessed by few input-output variables in a mass conservation equation, and the plant factors are barely considered. Subsequent improvements in classical models added plant parameters, but the plant phenology was synthesized in a single coefficient (Kc) obtained experimentally (Nolz, 2016).
More recent physical models to evaluate soil-water balance are based on the interaction between
plant growth, or development, and water usage − a
the soil. AquaCrop (Raes et al., 2017) and DSSAT (decision-support system for agrotechnology transfer) (Hoogenboom et al., 2015) are physical model examples that include plant physiology, soil properties, crop management, and climate data. These models consider the plant physiology processes affected by water stress, such as plant canopy expansion and senescence, stomatal conductance, and harvest index. In addition, AquaCrop and DSSAT consider the effects of critical temperatures, soil fertility, salinity, and atmospheric CO2 concentration on the plant growth
and development.
AquaCrop has a user-friendly modular interface that assists in the climate, soil, phenology, plant, and crop management data input (Raes et al., 2017). Moreover, its interface allows of the setting of several built-in functions that are necessary to simulate soil and plant changes due to water availability throughout the crop cycle. Climate, soil, plant and crop management data allow of the integration of water balance to a plant growth model and, thus, several scenarios can be created to simulate the effects of the soil-water availability on crop biomass and grain yield. In addition, climatological data series can be input in the AquaCrop to assess impacts of climate change on crop production, and identify frequencies of crop losses due to water stress.
However, models such as AquaCrop require calibrated regional data sets for reasonable results. Therefore, several studies have been applying and testing the AquaCrop model around the world in recent years (Salemi et al., 2011; Mabhaudhi et al., 2014; Toumi et al., 2016). Some of these works have been carried out in Brazil. Minella et al. (2014) assessed the limitations and potential uses of this model for prediction of crop failure events; Alencar (2014) performed a parameterization and validation study for sugarcane; and Battisti et al. (2017) carried out a comparative study with similar models. According to these studies, parameterization is essential for the applications of soil-water balance models in field conditions. Therefore, the use of simulations to evaluate the AquaCrop parameters can assist in choosing the input values for further field calibration and validation studies, and can guide research efforts towards components with greater impact on the results (Stricevic et al., 2011; Nyakudya & Stroosnijder, 2014). Furthermore, in multidimensional problems, such as
the soil-water balance, the quality of physical models are dependent on the accuracy of the input values, and on suitable parameter selection criteria (Benke et al., 2008; Hamel & Guswa, 2015).
The objective of this work was to perform a sensitivity analysis of the main input parameters required for the AquaCrop water balance model, using biomass and grain yield data of a rainfed-simulated corn crop, obtained along the climate data series of 1987–2016 in the South of Brazil.
Materials and Methods
The study was carried out using the AquaCrop Standard Windows Programme, version 6.0 (Raes et al., 2017). The concepts and underlying principles of the model were described by Steduto et al. (2009), and its technical description was described by Raes et al. (2009).
Concórdia, a municipality of Santa Catarina, Brazil, was the selected site for the application and analysis of the model input parameters, and a rainfed-corn crop was used as a test-crop because of its regional economic importance, since the Concórdia microregion is responsible for 6.5% of the total corn grain production of this state (Boletim…, 2017).
Reference parameters were taken from the conservative values presented by Hsiao et al. (2009) for corn crop, and input in the AquaCrop program (Raes et al., 2017). AquaCrop default values for main parameters, and ranges used in the sensitivity analysis simulations, are presented (Table 1). The settings of minor parameters were maintained in accordance with the default options, in order to achieve comparable results on all simulations.
The crop canopy development was adjusted by the growing degree-day method, with base temperature of 8.0°C and upper temperature of 30.0°C. September 1
was the sowing date used in all simulations because it is the beginning of the corn planting season in Concórdia SC. Crop response to soil salinity and fertility was not considered in this study.
The soil used in the AquaCrop multiple run projects was a Rhodic Kandiudox (Nitossolo Vermelho distroférrico) based on the characterization by Baldissera et al. (1997), as following described for the main AquaCrop needs. Horizon 1: top silt clay soil layer of 0.60 m; 22% permanent wilting point (PWP); 34% field capacity (FC); 57% saturation; 200 mm per day saturated hydraulic conductivity (Ko); 0% gravel
Table 1. Reference parameterization in the AquaCrop 6.0 software for maize, and parameter ranges used for sensitivity analysis simulations.
Parameter AquaCrop reference Parameter range Plant parameter
Soil water stress factors - Canopy expansion - Stomatal closure - Early canopy - senescence Aeration stress
- Effect on the harvest index during flowering
- Sensitive to water stress - Tolerant to water stress
- Moderately tolerant to water stress - Moderately tolerant to waterlogging - Sensitive to water stress
- Water stress response:
All factors set in each of the soil water stress levels provided in the software.
- Individual factor relative effect:
Each individual factor set in to maximum sensitivity to water stress, and the other factors set in to moderately tolerant to water stress.
Root deepening - Very deep rooted crops
- Maximum effective rooting depth of 2.30 m
- Maximum effective rooting depth of 0.60 m (shallow-medium rooted)
- Rooting depth range from 20 to 60 cm in 5 cm increments
Water extraction pattern in the effective root zone
- Upper ¼ : 40% - Second ¼ : 30% - Third ¼ : 20% - Bottom ¼ : 10%
- patterns from upper to bottom layers:
- 40-30-20-10 (default); 35-28-20-10; 30-27-23-20; 25-25-25-25; 20-23-27-30
Growing cycle (degree-day)
I. Emergence: 80 II. Max. canopy: 705 III. Flowering: 880 IV. Senescence: 1.400 V. Maturity: 1.700
- Degree-day length from I-V stages: - Normal: 78/630/970/1550/1860 Early: 72/555/890/1500/1800 Extra-early: 60/450/770/1160/1470 Ultra-early: 46/355/570/800/1110
Crop coefficient - Kc = 1.05 - Kc ranged from 0.80 to 1.25 in 0.05 increments Crop water productivity - WP = 33.7 g m-2 - WP ranged from 26 to 40 g m-2.mm-1 in 2 g m-2.mm-1
increments Soil parameter
Water holding capacity - Total available water (TAW) featured by user
- TAW ranged from 70 to 150 mm m-1 in 10 mm m-1
increments Capillary raise - Depth groundwater table below soil
surface featured by user
- Depth groundwater ranged from 0.5 to 5.0 m in 0.5 m increments
Crop and field management
Plant density - 75,000 plants ha-1 - Plant densities of 40, 50, 55, 62.5, 70 and 75,000 plants
ha-1 Effects of field surface practices on runoff - Changes in curve-number (CN) value
featured by user
- no effects (CN=65); reduced 10, 20, and 30% (CN 58, 52, and 45); increased 10, 20, and 30% (CN 72, 78 and 85)
Mulches - Percent of soil cover by mulches featured by user
mass; and no restrictive soil layer. Horizon 2: bottom silt clay soil layer of 0.60 m; 24% permanent wilting point (PWP); 37% field capacity (FC); 60% saturation; 150 mm per day saturated hydraulic conductivity (Ko); 0% gravel mass; no restrictive soil layer.
Soil surface characteristics: surface runoff curve number (CN) 61 for proper field management, determined by a routine program based on the Ko of the Horizon 1; 0.04 m evaporating-soil surface layer, with 9 mm readily evaporable water.
The following conditions were considered to run the simulations: initial soil-water content at field capacity; no stress in the initial crop development and production; 0.10 m (minimum default level) initial rooting depth; and perfect weed management. The initial field management practices (crop type, treatment, and hydrologic conditions) that affect the surface runoff was also considered, increasing the CN computed by Ko in 7%; therefore, the referential CN was about 65 in the simulations, with no effects of field practices on the runoff.
Only the water stress effect on harvest index (HI) during flowering (failure of pollination) was tested in the present work. The water stress effect on HI before flowering and during grain formation was set as being of small level in all running tests.
The reference parameterization was set (Table 1) for the AquaCrop parameter sensitivity analysis, and the effect of each parameter on the results was quantified by two model outputs, which are the relative aboveground biomass production (Brelative) and
the reference harvest index (grain yield calculated by Brelative × HIo) (Steduto et al., 2009). The relative
aboveground biomass production is the ratio between the actual biomass production from the model and the potential biomass production under nonstressed conditions. The reference harvest index is a specific cultivar parameter, obtained from the ratio between the yield mass and the total aboveground biomass that will be reached at maturity under nonstressed conditions. A 50% HI was used in all simulations.
Statistical analysis of the mean relative biomass and grain yield obtained in the simulations were carried out, considering each parameter input value, or option, as a treatment, and each year of the time series as a replicate. The means were compared by the nonparametric Kruskal-Wallis analysis (Campos, 1983) by ranks and median test, and multiple comparisons of mean ranks
for all groups, due to the high amplitude of the standard deviations of the treatments. The hypothesis Ho (no significant differences among the treatments) was rejected when the p-value was lower than 5%.
Results and Discussion
Simulation results of the AquaCrop from the main input plant parameters used in the present work are expressed as mean values of corn relative biomass and grain yield, computed from the 1987-2016 time series (Table2). The first and second rows in this table show the results of the plant- and soil-water stress parameters. AquaCrop divides the corn-water stress into five main factors: canopy expansion, stomatal closure, early canopy senescence, aeration stress due to waterlogging, and effect on the harvest index (HI), before and during flowering (failure of pollination), and during grain formation stages. Each of these factors can be set from extremely sensitive to extremely tolerant level. Except for aeration stress factor, which takes into account the percentage of soil volume free from water, the sensitivity, or tolerance, to water stress modify in other factors the upper or lower-soil-water depletion fraction (p). Fraction “p” is a typical way used in several soil-water balance models to indicate the point at which soil-water can reach before causing plant-water stress (Ranatunga, 2008). The first row of Table2 shows that there were significant differences in the simulated, relative biomass in corn and grain yield, when the five plant- and soil-water stress factors were set to the same level. According to the results, the mean relative biomass (82%) and grain yield (8.24 Mg ha-1) were about 3-fold higher at extremely tolerant
level for water stress than at extremely sensitive level (30% and 2.74 Mg ha-1, respectively). However, extreme
conditions for all factors are unrealistic expectations only used to show the possible range values between all favorable and all unfavorable conditions. Additionally, commercial corn production should use a combination of sensitivity and tolerance to water stress factors that allows achieving high yields with some safety against drought events (Araus et al., 2012).
sensitive parameters, and none had total failures using tolerant, or extremely tolerant parameters. A high number (10) of failures were also obtained using moderately sensitive parameters, indicating that this option is also unrealistic with the climatic conditions of southern Brazil. For instance, Bergamaschi et al. (2006) obtained corn yields in nonirrigated plots of up to 85% lower than in irrigated ones, in a long-term experiment (1993-2003), and no total yield loss was found, even in the driest years. Moreover, researches with irrigated corn (Payero et al., 2009; Popova et al., 2006) indicate a limitation by soil-water depletion
similar to the Aquacrop tolerant and extremely tolerant options, for corn stages with higher-water demand. The Aquacrop simulation with plant parameters set to corn reference parameterization (Table1), and middle-class values for soil and crop management, showed no total failure of corn yield in the period from 1987 to 2016. Thus, the corn reference parameterization in AquaCrop defaults seems to be adequate for places without calibrated field data, as indicated by Stricevic et al. (2011).
The relative effect to each of the five plant soil-water stress factors (canopy expansion, stomatal
Table 2. Plant parameter effects on maize mean relative biomass (%) and grain yield (Mg ha-1 [in brackets]) obtained by
AquaCrop simulations applied to the 1987-2016 time series, in Concórdia SC, Brazil. Equal lowercase (relative biomass) and uppercase (grain yield) letters indicate no significant differences by Kruskal-Wallys test (α<0.05).
Parameters Factors, types or ranges
Five plant-soil-water stress factors set to the same level
Extremely sensitive Sensitive Moderately sensitive Moderately tolerant Tolerant Extremely tolerant
30b [2.74B] 42b [3.84B] 56ab [5.21AB] 77a [7.61A] 80a [8.20A] 82a [8.24A]
Relative effect to each of the five
plant-soil-water stress factors
Canopy expansion
Stomatal closure
Early canopy senescence
Aeration stress
Effect on Harvest Index
during flowering
51a [4.68A] 53a [5.58A] 30a [2.60A] 56a [5.21A] 56a [5.21A]
Root deepening 20 cm 25 cm 30 cm 35 cm 40 cm 45 cm 50 cm 55 cm 60 cm
26c 37c 50bc 68ab 76ab 78a 81a 84a 86a
[2.03C] [3.42C] [4.63BC] [6.83AB] [7.82AB] [8.31A] [8.79A] [9.12A] [9.36A]
Water extraction pattern in the effective root zone
40-30-20-10 35-28-22-15 30-27-23-20 25-25-25-25 20-23-27-30
78a [8.31A] 79a [8.39A] 79a [8.41A] 79a [8.44A] 80a [8.49A]
Growing cycle Normal Early Extra-early Ultra-early
77b [10.51A] 78b [10.61A] 83ab [9.49A] 89a [7.96B]
Crop coefficient 0.80 0.85 0.90 0.95 1.00 1.05 1.10 1.15 1.20 1.25
88a 87ab 85ab 84ab 82ab 80ab 78ab 77ab 75ab 73b
[7.06B] [7.34AB] [7.58AB] [7.81AB] [8.01AB] [8.18AB] [8.31AB] [8.32A] [8.42A] [8.54A]
Crop water productivity 26 g m-2 mm 28 g m-2 mm 30 g m-2 mm 32 g m-2 mm 34 g m-2 mm 36 g m-2 mm 38 g m-2 mm 40 g m-2 mm
78a 78a 78a 78a 78a 78a 78a 78a
[7.21D] [7.76CD] [8.31BCD] [8.85ABCD] [9.40ABC] [9.94AB] [10.48A] [11.02A]
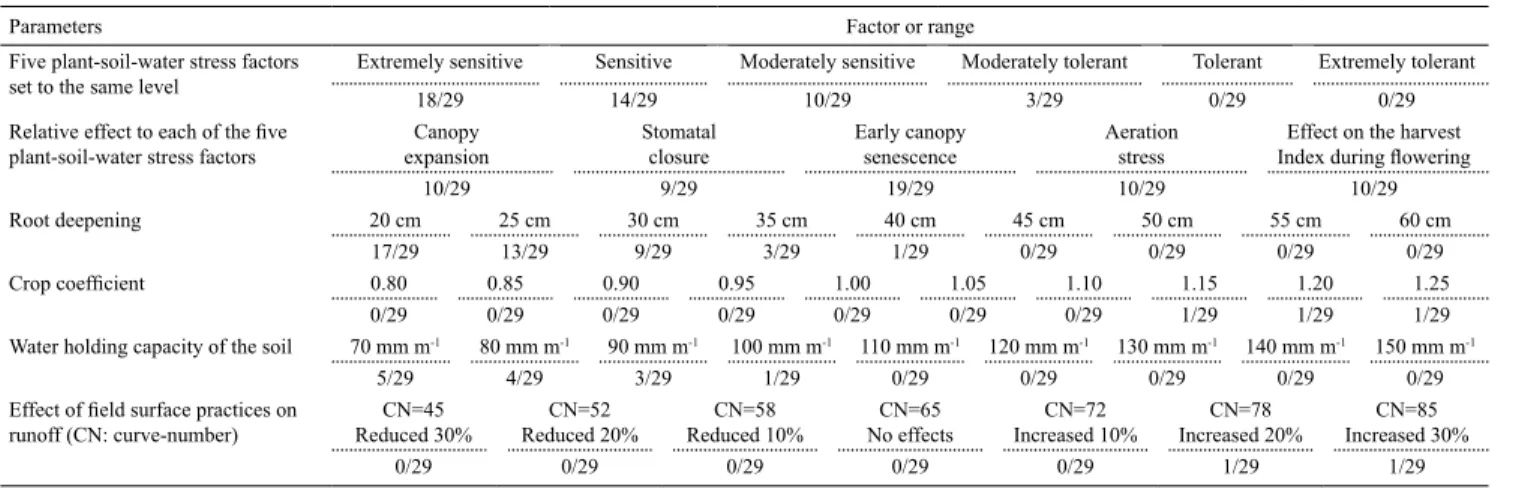
Table 3. Number of years with total failure of maize yield, during the 1987-2016 climate data series, according to the AquaCrop sensitivity analysis performed for some plant, soil, and crop management parameters, in Concórdia, SC, Brazil.
Parameters Factor or range
Five plant-soil-water stress factors set to the same level
Extremely sensitive Sensitive Moderately sensitive Moderately tolerant Tolerant Extremely tolerant
18/29 14/29 10/29 3/29 0/29 0/29
Relative effect to each of the five
plant-soil-water stress factors
Canopy expansion
Stomatal closure
Early canopy senescence
Aeration stress
Effect on the harvest
Index during flowering
10/29 9/29 19/29 10/29 10/29
Root deepening 20 cm 25 cm 30 cm 35 cm 40 cm 45 cm 50 cm 55 cm 60 cm
17/29 13/29 9/29 3/29 1/29 0/29 0/29 0/29 0/29
Water holding capacity of the soil 70 mm m-1 80 mm m-1 90 mm m-1 100 mm m-1 110 mm m-1 120 mm m-1 130 mm m-1 140 mm m-1 150 mm m-1
5/29 4/29 3/29 1/29 0/29 0/29 0/29 0/29 0/29
Effect of field surface practices on
runoff (CN: curve-number)
CN=45 Reduced 30%
CN=52 Reduced 20%
CN=58 Reduced 10%
CN=65 No effects
CN=72 Increased 10%
CN=78 Increased 20%
CN=85 Increased 30%
0/29 0/29 0/29 0/29 0/29 1/29 1/29
Crop coefficient 0.80 0.85 0.90 0.95 1.00 1.05 1.10 1.15 1.20 1.25
closure, early canopy senescence, aerations stress and effect on harvest index during flowering) is showed in the second row of Table2. The simulations were performed by adjusting an individual factor at maximum sensitivity, while keeping the others at moderately sensitive levels. For instance, canopy expansion was set up as extremely sensitive, while the other factors were kept as moderately sensitive, and biomass and grain yield decreased respectively 9 and 10%, in comparison to the option in which all factors were set up as moderately sensitive (first row of Table2). Although the corn relative biomass and grain yield have shown no significant differences among the different stress factor combinations, there were many cases of crop failures in all combinations, mainly for the early canopy senescence factor (Table 3), which showed 19 crop failures in 29 years of simulation. This indicates that any of the plant stress factors set to extremely sensitive is able to cause crop failure, but the early canopy senescence has great effects on the crop. In this case, the early canopy senescence set up as extremely sensitive produced 50% less grain than when all five plant- and soil-water stress factors were adjusted as moderately sensitive (2.60 Mg ha-1 against
56 Mg ha-1). George et al. (2013) obtained a higher
HI in irrigated than in nonirrigated corn crops, and confirmed the positive relationship between biomass and grain yield; this result reinforces the canopy effect on corn productivity.
The next plant parameter in with significant effects on corn relative biomass and grain yield was the root deepening, which determines the effective root zone (Table 2). The results showed that both relative biomass and grain yield had a high increase for a root depth from 20 to 40 cm, and a low-increase rate from this layer (Figure 1 A). In contrast with the Aquacrop reference parameterization (Table 1), a maximum depth of 60 cm for a shallow-medium rooting was used in the present work, but the water stress effects were significant only at depths lower than 45 cm. This result is in accordance with the root distribution pattern of
corn described by Fan et al. (2016) − 50% of the root
mass is concentrated at the first 15 cm of the soil, and 95% are distributed up to 90 cm depth.
Although a reduction of the plant water stress by the water uptake in deeper layers was expected, changes in the water extraction pattern in the effective root zone did not significantly affect the corn relative
biomass or grain yield. In other words, the increase of water uptake from the soil deeper layers caused no significant effects on simulated biomass or grain yield. However, some works indicate that rainfed corn uptakes proportionally more water from deeper layers than well-watered corn plants (Djaman & Irmak, 2012).
The sensitivity analysis for the plant parameters growing cycle, crop coefficient, and crop water productivity showed significant but elusive effects on the corn relative biomass and grain yield simulated by AquaCrop (Table 2). As to growing cycle, corn with very short cycle (ultra-early) had higher-relative biomass than corn cultivars with longer cycles
early to normal), but lower-grain yield. Corn cultivars with short cycles had less water stress in the long-term simulation; thus, its relative biomass was close to the biomass potential production that could be obtained without water stress. However, corn grain yield increased as the cycle extended because AquaCrop computes the total biomass and grain yield based on the amount of water used by the crop over the cycle, that is, the final corn yield is directly related to the total amount of water used by the plants throughout the cycle. For the same reason, there was a negative correlation between crop coefficient (Kc) and relative biomass, and a positive correlation between Kc and grain yield (Table 2, penultimate row). The relative biomass or grain yield found in each tested Kc were
not significantly different from the Kc of 1.05 − a
reference parameter to corn in the AquaCrop default (Table1). In turn, the grain yield increased in a constant rate over the crop water productivity scale used due to the increasing water use efficiency of plants (Table2), but this factor in Aquacrop is a cultivar attribute that no longer depends on crop management, or climatic variables (Steduto et al., 2009).
The sensitivity analysis of the soil (water holding capacity and water table depth), and crop management (plant density, effect of field surface practices on runoff and mulches) parameters is showed in Table4. Variations in the soil water holding capacity affected the corn relative biomass and grain yield because of either increases or decreases in total water available throughout the cycle. Increased soil-water storage
Plant density 40.000 ha-1 45.000 ha-1 50.000 ha-1 55.000 ha-1 62.500 ha-1 70.000 ha-1 75.000 ha-1
78a [8.16A] 78a [8.18A] 78a [8.23A] 78a [8.26A] 78a [8.31A] 78a [8.31A] 78a [8.37A]
Effect of field surface practices
on runoff (CN: curve-number)
CN=45 Reduced 30%
CN=52 Reduced 20%
CN=58 Reduced 10%
CN=65 No effects
CN=72 Increased 10%
CN=78 Increased 20%
CN=85 Increased 30%
79a [8.41A] 79a [8.39A] 79a [8.36A] 78a [8.31AB] 77ab [8.18AB] 75ab [7.77AB] 64b [6.21B]
Table 4. Soil and crop management effects on maize mean relative biomass (%) and grain yield (Mg ha-1 [in brackets])
obtained by AquaCrop simulations, applied to the 1987-2016 time series, in Concórdia SC, Brazil. Equal lowercase (relative biomass) and uppercase (grain yield) letters indicate no significant differences by the Kruskal-Wallys test (α<0.05).
Parameter Range
Water holding capacity of the soil 70 mm m-1 80 mm m-1 90 mm m-1 100 mm m-1 110 mm m-1 120 mm m-1 130 mm m-1 140 mm m-1 150 mm m-1
58b 64ab 68ab 75ab 77ab 78ab 80a 81a 82a
[5.32C] [6.15BC] [6.75BC] [7.67BC] [8.06BC] [8.31BC] [8.62AB] [8.78AB] [8.93A]
Mulches None (0%) Sparse (25%) About half (50%) Significant (75%) Complete (100%)
77a [8.15A] 78a [8.31A] 81a [8.69A] 82a [8.90A] 84a [9.07A]
Water table depth effect on capillary raise
0.5 m 1.0 m 1.5 m 2.0 m 2.5 m 3.0 m 3.5 m 4.0 m 4.5 m 5.0 m
59c 100a 100a 100a 93b 89b 89b 88b 78bc 78bc
[6.37C] [10.93A] [10.94A] [10.92A] [10.36AB] [9.91B] [9.84B] [9.78B] [8.31BC] [8.31BC]
caused a gradually increasing of the mean relative biomass (Figure1 B) and grain yield, but large changes in the water storage capacity of the soil are required to cause significant effects. However, this is a positive characteristic because the AquaCrop model does not require precise data about soil properties, and it is applicable to places where soil data are often lacking. The effects of the shallow water table on corn relative biomass and grain yield were significant; however, this parameter should be considered only in situations in which the water table variations are known (Florio et al., 2014).
Changes of the crop management parameters caused no expressive effects on corn relative biomass, or grain yield, except when the CN factor was set to very high (around 85) (Table4). In this case, the high CN values indicated that the field surfaces practices increased the runoff and, consequently, decreased the water infiltration, and reduced the water storage in the soil. Likewise, the mulch cover did not cause significant effects on both corn relative biomass and grain yield (Table4).
agronomic performance of corn (Araus et al., 2012). The plant parameters root deepening and Kc caused significant effects, but only on extreme levels as those
of very shallow soil condition (< 45 cm), or Kc values
too far from the reference value (Kc = 1.05) (Table1). The increase of water holding capacity of the soil had positive effects on corn biomass and grain yield, as well as the depth of the water table, with levels near to those of the root zone. Since these factors can vary greatly from location to location, proper soil data are necessary for coherent results. In turn, changes of crop management parameters resulted in no significant effects on the corn biomass and grain yield. Therefore, AquaCrop should be used with caution, when the purpose is to evaluate land and crop management practices.
Conclusions
1. AquaCrop is more sensitive to plant factors that are related to the corn sensitivity or tolerance to soil-water stress, especially the early canopy senescence.
2. AquaCrop presents sensitivity to root deepening and water holding capacity of the soil, but significant changes in long-term means of corn biomass, or grain yield, only occur when extreme values of these parameters are used in the simulations.
3. The presence of groundwater table in shallow depth below the root zone causes positive effects on capillary raise and soil-water content, indicating that this variable should only be considered if proper water table depth data are available for the study location.
4. AquaCrop shows small or no sensitivity to soil and crop management parameters, indicating that this model is not adequate to evaluate land and crop management effects on the soil-water balance.
5. AquaCrop is a soil-water balance model that can be used reliably in southern Brazil to simulate long-term soil-water stress effects on corn biomass and grain yield, requiring a few settings for the default plant and soil parameters.
References
ALENCAR, L.P. de. Parametrização e validação do modelo
AquaCrop para a cultura da cana-de-açúcar. 2014. 117p. Tese
(Doutorado) - Universidade Federal de Viçosa, Viçosa.
ALLEN, R.G.; PEREIRA, L.S.; RAES, D.; SMITH, M. Crop
evapotranspiration: guidelines for computing crop water
requirements. Rome: FAO, 2006. 300p. (FAO. Irrigation and Drainage Paper, n.56).
ARAUS, J.L.; SERRET, M.D.; EDMEADES, G.O. Phenotyping corn for adaptation to drought. Frontiers in Physiology, v.3, art.305, 2012.
BALDISSERA, I.T.; VEIGA, M. da; TESTA, V.M.; BACIC, I.L.Z. Caracterização físico-hídrica de seis solos minerais não hidromórficos de Santa Catarina submetidos a diferentes
sistemas de manejo. Florianópolis: EPAGRI, 1997. 55p. (EPAGRI.
Boletim técnico, 93).
BATTISTI, R.; SENTELHAS, P.C.; BOOTE, K.J. Inter-comparison of performance of soybean crop simulation models and their ensemble in southern Brazil. Field Crop Res, v.200, p.28-37, 2017. DOI: 10.1016/j.fcr.2016.10.004.
BENKE, K.K.; LOWELL, K.E.; HAMILTON, A.J. Parameter uncertainty, sensitivity analysis and prediction error in a water-balance hydrological model. Mathematical and
Computer Modelling, v.47, p.1134-1149, 2008. DOI: 10.1016/j.
mcm.2007.05.017.
BERGAMASCHI, H.; DALMAGO, G.A.; COMIRAN, F.; BERGONCI, J.I.; MÜLLER, A.G.; FRANÇA, S.; SANTOS, A.O.; RADIN, B.; BIANCHI, C.A.M.; PEREIRA, P.G. Deficit hídrico e produtividade na cultura do milho. Pesquisa
Agropecuária Brasileira, v.41, p.243-249, 2006. DOI: 10.1590/
S0100-204X2006000200008.
BOLETIM AGROPECUÁRIO. Florianópolis: EPAGRI/ICEPA, n.46, 2017. 49p.
CAMPOS, H. de. Estatística experimental não-paramétrica. 4.ed. Piracicaba: ESALQ, 1983. 349p.
DJAMAN, K.; IRMAK, S. Soil water extraction patterns and crop, irrigation, and evapotranspiration water use efficiency of corn under full and limited irrigation and rainfed settings.
Transactions of the ASABE, v.55, p.1223-1238, 2012. DOI:
10.13031/2013.42262.
EMBRAPA SUÍNOS E AVES. Dados agrometeorológicos.
Available at: <http://www.cnpsa.embrapa.br/meteor/>. Accessed
on: Feb. 10 2017.
FAN, J.; MCCONKEY, B.; WANG, H.; JANZEN, H. Root distribution by depth for temperate agricultural crops. Field
Crops Research, v.189, p.68-74, 2016.
FAO. Food and Agriculture Organization of the United Nations.
ETo calculator . Rome. Available at: < http://www.fao.org/land-water/databases-and-software/eto-calculator/en/>. Accessed on:
Mar. 10 2017.
FLORIO, E.L.; MERCAU, J.L.; JOBBÁGY, E.G.; NOSETTO, M.D. Interactive effects of water-table depth, rainfall variation, and sowing date on corn production in the Western Pampas.
Agricultural Water Management, v.146, p.75-83, 2014. DOI:
10.1016/j.agwat.2014.07.022.
HAMEL, P.; GUSWA, A.J. Uncertainty analysis of a spatially explicit annual water-balance model: case study of the Cape Fear basin, North Carolina. Hydrology and Earth System Science, v.19, p.839-853, 2015. DOI: 10.5194/hess-19-839-2015.
HOOGENBOOM, G.; JONES, J.W.; WILKENS, P.W.; PORTER, C.H.; BOOTE, K.J.; HUNT, L.A.; SINGH, U.; LIZASO, J.I.; WHITE, J.W.; URYASEV, O.; OGOSHI, R.; KOO, J.; SHELIA, V.; TSUJI, G.Y. Decision support system for agrotechnology
transfer (DSSAT) Version 4.6. Prosser: DSSAT Foundation,
2015. Available at: <http://dssat.net>. Accessed on: Feb. 3 2017.
HSIAO, T.C.; HENG, L.; STEDUTO, P.; ROJAS-LARA, B.; RAES, D.; FERERES, E. AquaCrop – the FAO crop model to simulate yield response to water: III. Parameterization and testing for corn. Agronomy Journal, v.101, p.448-459, 2009. DOI: 10.2134/agronj2008.0218s.
MABHAUDHI, T.; MODI, A.T.; BELETSE, Y.G. Parameterisation and evaluation of the FAO-AquaCrop model for a South African taro (Colocasia esculenta L. Schott) landrace. Agricultural and
Forest Meteorology, v.192-193, p.132-139, 2014. DOI: 10.1016/j.
agrformet.2014.03.013.
MINELLA, A.M.; REGINA, C.S.A.; JAVIER, T. Modelos de produtividade agrícola aplicados à agricultura de sequeiro: limitações e vantagens para avaliação de colapso de safras.
ACSA– Agropecuária Científica no Semiárido, v.10, p.41-48,
2014. DOI: 10.30969/acsa.v10i4.461.
NOLZ, R. A review on the quantification of soil water balance components as a basis for agricultural water management with a focus on weighing lysimeters and soil water sensors. Journal
of Land Management, Food and Environment, v.67, p.133-144,
2016. DOI: 10.1515/boku-2016-0012.
NYAKUDYA, I.W.; STROOSNIJDER, L. Effect of rooting depth, plant density and planting date on corn (Zea mays L.) yield and water use efficiency in semi-arid Zimbabwe: modeling with AquaCrop. Agricultural Water Management, v.146, p.280-296, 2014. DOI: 10.1016/j.agwat.2014.08.024.
PAYERO, J.O.; TARKALSON, D.D.; IRMAK, S.; DAVISON, D.; PETERSEN, J.L. Effect of timing of a deficit-irrigation allocation on corn evapotranspiration, yield, water use efficiency and dry mass. Agricultural Water Management, v.96, p.1387-1397, 2009. DOI: 10.1016/j.agwat.2009.03.022.
POPOVA, Z.; ENEVA, S.; PEREIRA, L.S. Model validation, crop coefficients and yield response factors for corn irrigation scheduling based on long-term experiments. Biosystems Engineering, v.95, p.139-149, 2006. DOI: 10.1016/j.biosystemseng.2006.05.013. RAES, D.; STEDUTO, P.; HSIAO, T.C.; FERERES, E. AquaCrop – the FAO crop model to simulate yield response to water: II. Main algorithms and software description. Agronomy Journal, v.101, p.438-447, 2009. DOI: 10.2134/agronj2008.0140s.
RAES, D.; STEDUTO, P.; HSIAO, T.C.; FERERES, E. AquaCrop
version 6.0 reference manual. Rome: FAO, 2017. Available
at: <http://www.fao.org/land-water/databases-and-software/
aquacrop/en/>. Accessed on: June 26 2017.
RANATUNGA, K.; NATION, E.R.; BARRAT, D.G. Review of soil water models and their applications in Australia.
Environmental Modelling & Software, v.23, p.1182-1206, 2008.
DOI: 10.1016/j.envsoft.2008.02.003.
SALEMI, H.; SOOM, M.A.M.; LEE, T.S.; MOUSAVI, S.F.; GANJI, A.; KAMILYUSOFF, M. Application of AquaCrop model in deficit irrigation management of Winter wheat in arid region.
African Journal of Agricultural Research, v.610, p.2204-2215,
2011. DOI: 10.5897/AJAR10.1009.
STEDUTO, P.; HSIAO, T.C.; RAES, D.; FERERES, E. AquaCrop – the FAO crop model to simulate yield response to water: I. Concepts and underlying principles. Agronomy Journal, v.101, p.426-437, 2009. DOI: 10.2134/agronj2008.0139s.
STRICEVIC, R.; COSIC, M.; DJUROVIC, N.; PEJIC, B.; MAKSIMOVIC, L. Assessment of the FAO AquaCrop model in simulation of rainfed and supplementally irrigated corn, sugar beet and sunflower. Agricultural Water Management, v.98, p.1615-1621, 2011. DOI: 10.1016/j.agwat.2011.05.011.
THORNTHWAITE, C.W.; MATHER, J.R. The water balance. Centerton: Drexel Institute of Technology, Laboratory of Climatology, 1955. 104p. (Publications in Climatology, v.8).
TOUMI, J.; ER-RAKI, S.; EZZAHAR, J.; KHABBA, S.; JARLAN; L.; CHEHBOUNI, A. Performance assessment of AquaCrop model for estimating evapotranspiration, soil water content and grain yield of winter wheat in Tensift Al Haouz (Morocco): application to irrigation management. Agricultural
Water Management, v.163, p.219-235, 2016. DOI: 10.1016/j.
agwat.2015.09.007.


![Table 4. Soil and crop management effects on maize mean relative biomass (%) and grain yield (Mg ha -1 [in brackets]) obtained by AquaCrop simulations, applied to the 1987-2016 time series, in Concórdia SC, Brazil](https://thumb-eu.123doks.com/thumbv2/123dok_br/16021987.693334/7.914.86.838.836.1065/management-effects-relative-brackets-obtained-aquacrop-simulations-concórdia.webp)
