TREE AGE AS ADJUSTMENT FACTOR TO NDVI
1Elias Fernando Berra2*, Denise Cybis Fontana3 and Tatiana Mora Kuplich4
1 Received on 13.11.2014accepted for publication on 03.05.2017.
2 Universidade Federal do Rio Grande do Sul, Centro Estadual de Pesquisas em Sensoriamento Remoto e Meteorologia, Porto Alegre, Rio Grande do Sul, Brasil. E-mail: <[email protected]>.
3 Universidade Federal do Rio Grande do Sul, Departamento de Plantas Forrageiras e Agrometeorologia, Porto Alegre, Rio Grande do Sul, Brasil. E-mail: <[email protected]>.
4 Instituto Nacional de Pesquisas Espaciais, Doutorado em Geografia Física, Santa Maria, Rio Grande do Sul, Brasil . E-mail: [email protected].
*Corresponding author.
ABSTRACT – This study aimed to increase satellite-derived Normalized Difference Vegetation Index (NDVI) sensitivity to biophysical parameters changes with aid of a forest age-based adjustment factor.This factor is defined as a ratio between stand age and age of rotation, which value multiplied by Landsat-5/TM-derived NDVI generated the so-called adjusted index NDVI_a. Soil Adjusted Vegetation Index (SAVI) was also calculated. The relationship between these vegetation indices (VI) with Eucalyptus and Pinus stands’ wood volume was investigated. The adjustment factor caused an increase in NDVI dynamic range values, since older stands tended to be assigned with highest NDVI values, while younger ones tended to be forced to assume lower NDVI values. As a result, direct and significant relationship between NDVI_a and wood volume could be maintained for wider ranges of wood volume. However, it was observed that NDVI_a was only statistically superior to NDVI and SAVI when a detailed age dataset is available. It is conclude that, the stand age has potential to improve NDVI sensitivity to biophysical parameters allowing that quantitative estimates could be made since young to adult stands.
Keywords: vegetation index, spectral saturation, wood volume.
IDADE DAS ÁRVORES COMO FATOR DE AJUSTE AO NDVI
RESUMO –Este estudo teve por objetivo aumentar a sensibilidade do NDVI, derivado de imagem de satélite, às variações de parâmetros biofísicos através do uso de um fator de ajuste baseado na idade da floresta. Este fator é definido como a razão entre a idade do povoamento e a idade de rotação, cujo valor multiplicado pelo NDVI (derivado de imagens Landsat-5/TM) gerou um índice ajustado chamado NDVI_a. SAVI também foi calculado. A relação entre estes índices de vegetação com volume de madeira de Eucalyptus e Pinus foi investigada. O fator de ajuste fez com que ocorresse um aumento no intervalo dinâmico do NDVI, uma vez que povoamentos mais velhos tenderam a assumir os valores mais altos do NDVI, enquanto nos povoamentos mais novos o NDVI tendeu a assumir valores mais baixos. Desta maneira, relações diretas e significativas entre NDVI_a e volume de madeira puderam ser mantidas em intervalos mais amplos de volume de madeira. Contudo, se observou que NDVI_a só foi estatisticamente superior ao NDVI e SAVI quando se dispunha de dados com valores de idade detalhados. Conclui-se que, a idade do povoamento florestal tem potencial para melhorar a sensibilidade do NDVI aos parâmetros biofísicos permitindo que estimativas possam ser feitas desde povoamentos novos até povoamentos adultos.
1. INTRODUCTION
Planted forests represent the main wood supply source for production chains of important industries such as pulp and paper, reconstituted panels, furniture, charcoal metallurgy, energy and solid wood products (Câmara Setorial de Silvicultura, 2009), which boost the generation of goods, taxes, employment and incomes (Abraf, 2011), reducing pressure over native forest remaining (Rezende et al., 2013). However, all these benefits rely upon a well-managed plantation capable of producing high quality trees at the end of rotation. For this, it is essential to have information about both quality and quantity of forest stands throughout all rotation cycle, which is traditionally made with aid of sampled data collected during forest inventories. Alternatively, satellite images have being used to obtain indirect estimates of forest biophysical parameters (Ardo, 1992; Carreiras et al., 2006; Ghahramany et al., 2012). Quantitative assessment of vegetation using remote sensing techniques has been commonly done through the use of the so-called vegetation indices (VIs) (Ponzoni and Shimabukuro, 1998). However, their performances have constraints and many efforts have been done in developing new VIs aiming to optimize them for applications such as vegetation monitoring and biophysical parameters estimates (Huete et al., 2002). The first VI was proposed by (Jordan, 1969) being a ratio between the spectral reflectances at 0.800 µm (infrared) and 0.675 µm (red) wavelengths. Later, Rouse Jr et al. (1974) normalized this ratio, creating the NDVI (Normalized Difference Vegetation Index), Equation 1, which became one of the most used VI worldwide (Boyd and Danson, 2005). Numerous NDVI modifications were tried (Bolfe, 2010) aimed at developing new VIs less sensitive to soil, atmosphere and lighting geometries influences (Huete, 1988).
EQ.1
Where:
IVP= Spectral reflectance in the near infrared band;
V= Spectral reflectance in the red band. The Soil Adjusted Vegetation Index (SAVI), proposed by (Huete, 1988), stands out amongst these variations for achieving, for the first time, to optimize the vegetation response in situations of low canopy cover, where the soil contributes to the final spectral response. Dueto its pioneering and functionality, NDVI and SAVI are commonly applied in forest quantitative analyzes (Ponzoni and Shimabukuro, 1998; Xavier, 1998; Bolfe et al., 2012; Ghahramany et al., 2012; Mouissa and Fournier, 2013) and have also provided the basis for the development of many other VIs. Bolfe (2010) lists 26 VIs created since 1974 until 1998, but hundreds of VIs can potentially be formulated with different spectral bands combinations (Meng et al., 2007).
Despite the wide variety of available VIs, they have a common limitation. Even if one tests different VIs in order to investigate which one best performs within a study area (Foody et al. 2003), there will be critical values from which VIs become insensitive to the amount of vegetation (Foody et al. 2003). Studies show that VIs do not accompany increasing in biophysical parameters over relatively higher Leaf Area Index (LAI) (LAI > 2) and saturate (Huete, 1988; Baret and Guyot, 1991; Rondeaux et al., 1996; Sousa, 1997; Turner et al., 1999; Huete et al., 2002; Bolfe et al., 2012). This causes a reduced dynamic range of VI values, compared to biophysical data range (Danson, 1987; De Wulf et al., 1990; Orue, 2002), a fact that strongly limits the expected VI pattern in relation to the amount of vegetation and its estimate.
This problem motivates studies aiming at improving VIs response so that one could potentially monitor the amount of vegetation through larger ranges of biophysical values , which is critical for improving VIs (Huete et al., 2002). In a forestry context, this issue is particularly important as detailed maps of adult trees reaching the planting rotation end (cutting age) are necessary (Puhr and Donoghue, 2000) and due to the high economic value associated ( Câmara Setorial de Silvicultura, 2009; Abraf, 2011).
Studies indicate trees’ age being positively correlated with other tree’s biophysical parameters such as height, diameter at breast height (dbh), biomass and wood volume (Scolforo, 1992; Danson and Curran, 1993; Puhr and Donoghue, 2000; Sanquetta et al., 2013), and it is easy to obtain, at least in commercial forests. Therefore, by means of adjusted allometric equations, age can be accurately used to estimate forest productivity throughout all its development cycle (Scolforo, 1992; Sanquetta et al., 2013).
scheme usually covers less than 3% of the planted area (Trotter et al., 1997) and therefore lack the spatial character of alternative estimates, such as those using VIs from satellite images as independent variables (Ardo, 1992; Carreiras et al., 2006; Berra et al., 2012; Ghahramany et al., 2012). On the other hand, VIs have a reduced dynamic range and are not able to sense the continuing increase of biophysical parameters values throughout plants’ development life cycle and saturate (Franklin, 1986; Danson and Curran, 1993).
This study tested a new method aiming to combine the intrinsic spatial characteristic of satellite images with the strong relationship between age and other forest biophysical parameters in order to increase VIs sensitivity for detecting increasing in vegetation amounts. Specifically, the NDVI is adjusted in order to better monitor changes in wood volume.
2. METHODS 2.1 Study area
This study used forest biophysical data from Pinus (Pinus elliottii Engelm.) and Eucalyptus (Eucalyptus
spp.) stands planted in areas geographically separated, Figure 1, consequently allowing the methodology to be tested in different areas and species.
The Pinus plantations occupy a narrow strip within a geological zone called Planície Costeira, southeast
of the Brazilian state of Rio Grande do Sul (Figure 1). The climate of the region, according to Koppen-Geiger’s classification system is humid subtropical, Cfa type. The average air temperature is 23.1°C in summer and 13.4°C in winter, with an annual precipitation of 1,155 mm (Cemetrs, 2011). The relief is rather plan all along, rising only a few meters above sea level (Weber et al., 2004); with a psament soil type (Embrapa, 1990).
Eucalyptus plantations are located east of the Brazilian state of Espírito Santo (Figure 1). The climate of the region, according to Koppen-Geiger’s classification system is tropical humid (Aw) with thermal means that vary from 20 to 25°C. The average annual rainfall is 1,375 mm (Xavier, 1998). The soils in the study area are classified as red-yellow oxisol (IBGE, 2001).
2.2 Field data and satellite images
For Pinus, forest inventory data were collected during September and October 2010 in young plantations aged between 5 and 8 years old. For reference, adult trees are considered those around 15 years old. The inventory was systematic with allocation of one sampling unit (SU) every 6 hectares. Each SU had a fixed area of 420 m2. The GPS Garmim Etrex Legend® was used
for locating the UA, from which coordinates were taken at its center. Diameter at breast height (dbh) and total tree height were measured from within each SU. These measurements were used to estimate wood volume in m³/ha (further details in Berra (2013)). A total of 111 SUs were surveyed.
Spectral data over the Pinus area were extracted from one image acquired by sensor TM, satellite Landsat 5, orbit/point 221/83 on September 7, 2010. Initially, image’s original digital numbers were converted to surface reflectance using the module FLAASH (Fast Line-of-sight Atmospheric Analysis of Spectral Hypercubes) available in software Envi. Afterwards, the reflectance images were georeferenced based on ground control points surveyed with a GPS Garmim Etrex Legend®. Finally, pixels intersecting with SUs coordinates were selected, from which both red and near infrared spectral reflectance values were extracted in order to calculate NDVI and SAVI (soil correction factor L = 0.75).
The Eucalyptus data set were compiled from Xavier (1998)’s PhD thesis. Since the original data base of this work was not available, all the Eucalyptus-related
Figure 1 – Study areas location.
data were copied from the appendices of Xavier (1998)’s thesis. It should be noted that Xavier (1998) used a different atmospheric correction method (see below), processing which we were not able to change due to the impossibility to access the original data set. Nevertheless, graphical inspections of surface reflectance curves (from all the Landsat bands) sampled from natural targets (vegetation and soil) (from both sites) revealed coherent measurements being retrieved, i.e., it was observed a spectral behavior (‘spectral signature’) in accordance with the expected for these targets (Ponzoni, 2001).
Eucalyptus data were inventoried through winter of 1997 within stands which ages ranged from 1 to 6.5 years. The Eucalyptus, by having a faster growth than Pinus, reaches adulthood around six years in Brazil, often with harvest cutting occurring around 7 years old. Therefore, this inventory collected data since young to early adulthood life phases. Five clones of Eucalyptus (CL1, CL2, CL3, CL4 and CL5) were sampled from within 130 stands. Only one SU was installed per stand. In each SU were measured the dbh of 30 trees and the height of 2 trees. Complete description of this inventory can be seen in Xavier (1998).
The spectral data over the Eucalyptus area was obtained from a TM/Landsat 5 image, orbit/point 215/ 74A, acquired on June 6, 1997. The image was georeferenced from control points identified on digital maps. Afterwards, image’s digital numbers were converted to surface reflectance, following correction of the atmospheric effects according to Chavez (1988); this was done in LEGAL environment, within the software SPRING, and the parameters used for it can be found in Xavier (1998). Red and near infrared reflectance values were extracted (at stand level) and used for calculating NDVI and SAVI (with an L factor = 0.75). Xavier (1998) investigated the relationship between these VIs with dbh and height from all 5 clones and concluded that species CL1, CL2, CL3 and CL4 could be considerate as just one data set, for statistics purposes. Therefore, from Xavier (1998)‘s work were compiled the values of NDVI, SAVI, dbh and height related to clones CL1, CL2, CL3 and CL4, which summed up 69 SUs. Dbh and height measurements were used to estimate wood volume in m3/ha.
After both Eucalyptus and Pinus data set were sorted out, the adjustment of NDVI by tree’s age was
carried out generating a new index named as NDVI_a, Equation 2. The hypotheses formulated is: as stand’s age (a) starts at 0 years (plantation) and naturally increases until the harvest final cutting or Age of Rotation (AR), age could be used as an adjustment factor (weight factor) for NDVI, in such manner that NDVI_a values would increase gradually and continuously with increases in forest biophysical parameters values. Therefore, it is expected that the adjustment by age could improve the NDVI signal over a forest cover.
EQ.2
Where NDVI_a = NDVI adjusted by stand’s age,
NDVI = Normalized Difference Vegetation Index, a = stand’s age (it varies from 0 to AR); AR = Age of Rotation (age of final cutting or maximum age available, having a fixed value). Since “AR” is a constant, the main purpose to divide “a” by “AR” is to keep NDVI_a within the same NDVI scale.
For Pinus the AR was 8 years (maximum age available) and for Eucalyptus, AR was 6.33 years (maximum age available). Therefore, three vegetation indices were calculated: NDVI, SAVI (which adjusts NDVI by the influence of the soil) and NDVI_a (which adjusts NDVI by the influence of the age).
2.3 Data Analysis
Initially, the relationship between wood volume and VIs (NDVI, SAVI and NDVI_a) were analyzed with the aid of scatter plots, from which regression curves were tested
to fit the pairs of data. T h e
significance of the differences due to different VIs being used as independent variables to explain variations in wood volume was tested by the Z statistic (Xavier, 1998; Montgomery et al., 2006). The differences were considered significant when Z > |1.96|, at 95% confidence level.
To visualize the effects of factor “a/AR” on original NDVI values, the differences between NDVI and NDVI_a were calculated, which values were plotted in graphs taken into account its relation with wood volume. Finally, it was analyzed how the factor “a/AR” affects original NDVI histograms.
3. RESULTS
over the Pinus and Eucalyptus stands. It is observed that a 4 years age range resulted in an amplitude of 196.6 m3/ha in Pinus wood volume values. A 5.08 years
age range for Eucalyptus resulted in an amplitude of 371.41 m3/ha. Regarding age, the greatest variability
comes from Eucalyptus’ SUs.
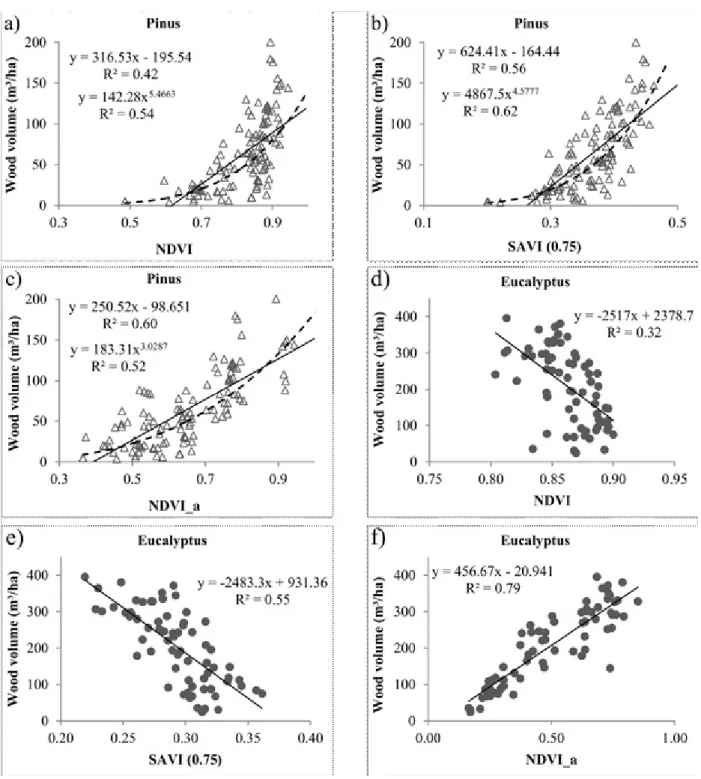
The analysis of biophysical variables against spectral ones starts with pairs of data coming from NDVI and Pinus wood volume, Figure 2a. Due to the curvilinear relationship observed, the power equation showed greater R2 than the linear one. When using
SAVI, the R2 of the linear equation increased from 0.42
to 0.56; as for the potency, the R² increased from 0.54 (Figure 2a) to 0.62 (Figure 2b). The curvilinear behavior observed in NDVI (Figure 2a) and SAVI (Figure 2b) shows a tendency to saturation at higher values of these indices, which are associated with stands of higher wood volumes. It must be stressed that this stand has not yet reached adulthood and therefore trees will continue to grow, might be reaching around 500 m3/
ha.
In addition to NDVI and SAVI this work proposed the index NDVI_a (Figure 2c). A decrease in the non-linear trend is observed resulting in higher R2 values
coming from linear equations than from power ones, contrary to NDVI and SAVI. However, despite SAVI (R2 = 0.62) and NDVI_a (R2 = 0.60) presenting higher
R2 than NDVI (R2 = 0.54), the differences among the
linear correlation coefficients (r) were not significant at 95 % of confidence level (Z < 1.96).
Figure 2d-f shows scatter plots between vegetation indices and Eucalyptus’ wood volume. It is observed that SAVI (Figure 2e) explains better variability in volume than NDVI (Figure 3a). The differences in the linear associations between NDVI and SAVI were statistically different, at a confidence level of 95% (Z = 2.30). It is noted that, unlike what happened in Pinus stand, there was no curvilinear behavior and there were inverse relationships between NDVI and SAVI with wood volume. When NDVI was adjusted by stand age through factor “a/AR” (NDVI_a) (Figure 2f), the relationship with wood
volume was direct and there was an increase in the linear association; the R2 value increased up from 0.32
(NDVI) to 0.79 (NDVI_a), and differences in linear associations between these VIs were statistically different at 95% of confidence (Z = 5.70). Between NDVI_a and SAVI there was also statistical differences (Z = 3.40), at 95% of confidence.
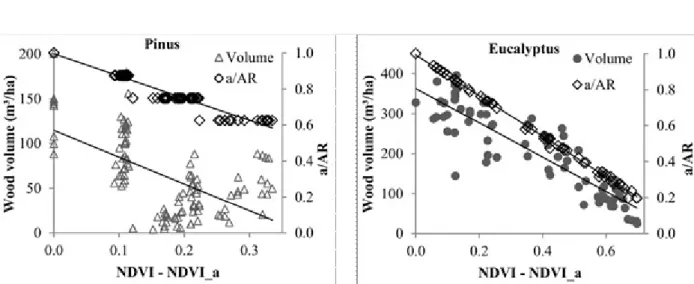
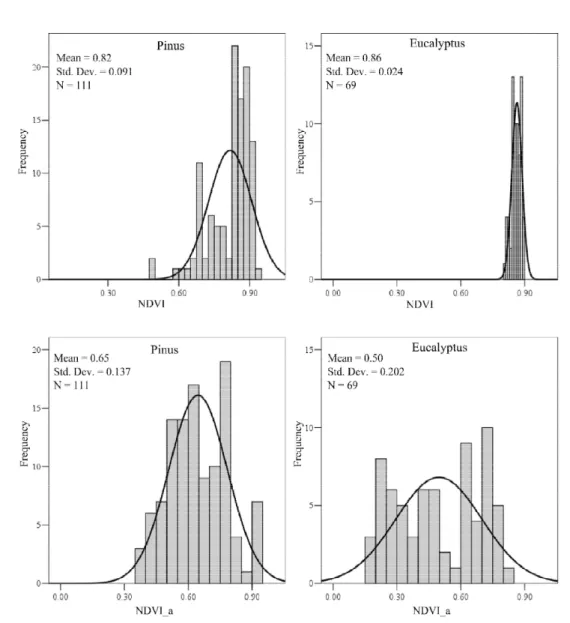
Therefore, Figure 2’s graphs showed that using “a/AR” to adjust NDVI (NDVI_a) improves the linear relationship with wood volume. Graphs of differences (NDVI - NDVI_a), Figure 3, and its respective histograms, Figure 4, illustrate how “a/AR” adjusts NDVI data. For Pinus there were 4 values of “a/AR” (corresponding to 4 age values), while for Eucalyptus there were 34 values of “a/AR” (34 age values), Figure 3. As it was assumed that “AR” was the age from oldest stands (8 years for Pinus and 6.33 years for Eucalyptus), in these the “a/AR” factor was equal to 1, resulting in values of NDVI equal to NDVI_a, i.e., with zero difference. As “a/AR” factor values decreases (due to decreasing ages) it changes more intensely the original NDVI values and, consequently, increasing differences between NDVI and NDVI_a (Figure 3). The result is a reallocation of frequencies as NDVI_a has lower minimal values than NDVI, increasing the dynamic range and shifting the normal probability curve to the left, which is related to a decrease in the average and increase in the standard deviation (Figure 4).
4. DISCUSSION
Results observed in Figure 2a and Figure 2b suggest influence from soil (background class) in the Pinus canopy’s spectral response, as SAVI take into account soil effects and NDVI does not (Huete, 1988, 1989; Baret and Guyot, 1991; Mcdonald et al., 1998; Xavier, 1998). The better SAVI sensitivity can be explained by the fact that Pinus stands were young and consequently in most SUs surveyed had not occurred total canopy closure (which takes place from around 7-8 years old). Therefore, the spectral radiance when reaching the stand interacts with the canopy and also
Average Standard Deviation Minimum Maximum CV (%)
Pinus Age (years) 6.30 0.90 5.00 8.00 14.29
Volume (m³/ha) 63.20 44.70 3.70 200.30 70.73
Eucalyptus Age (years) 3.68 1.54 1.25 6.33 41.85
Table 1 – Descriptive analysis from data inventoried within Pinus and Eucalyptus stands.
Figure 2 – Relationship between vegetation indices (NDVI, SAVI and NDVI_a) and wood volume for Pinus (a-c) and Eucalyptus (d-f) stands. The dashed line represents data adjustment by power equations.
with the background (due to canopy gaps), affecting the final spectral response received by the orbital sensor (Franklin, 1986; Huete, 1988). SAVI also performed better than NDVI on Eucalyptus stands (Figure 2e), which can be also due to soil influence (Xavier, 1998).
It was noticed that while in Pinus stands NDVI and SAVI relationships with wood volume were direct (Figure 2a,b), in Eucalyptus they were inverse (Figure 2d,e). The fundamental difference between these trees species is that Eucalyptus has a faster growth rate, which total canopy closure might occur between 2-3 years old, whereas in Pinus it might occur between 7-8 years old. In fact, it was observed that until around 2.5 years, the relationship between Eucalyptus wood volume with NDVI and SAVI were direct. From this age onward until around 3.5 years, increasing in wood volume did not increase nor diminish NDVI and SAVI values, resulting in a non-significant relationship, indicating the saturation of these indices. However, as data from 3.5 years onward (until 6.33 years) were added, it has been observed that NDVI and SAVI values tended to decrease. Therefore, when analyzing the wood volume data set across all available ages range (1.25 to 6.33 years), i.e., when grouping together all data, an inverse relationship prevailed. This behavior is not generally expected when VIs are associated with forest biophysical variables (Tucker, 1979; Peterson et al., 1986; Mcdonald et al., 1998; Salvador and Pons, 1998; Foody et al., 2003; Gonçalves et al., 2010; Berra et al.,
2012), however, it can happen after the total closure of the canopy and due to forest aging (Franklin, 1986; Ardo, 1992; Danson and Curran, 1993; Puhr and Donoghue, 2000).
Alternatively to NDVI and SAVI, a new index was proposed (NDVI_a), which uses the factor “a/AR” to adjust NDVI. From Figure 2c,f it can be seen that “a/ AR” increases NDVI amplitude values before it reaches the saturation limit, which is around 0.9 (Figure 2a,d), as is also observed by other authors (Mcdonald et al., 1998; Huete et al., 2002). The factor “a/AR” causes higher NDVI values to have a tendency to be associated with older stands, at same time also forcing the decrease of NDVI values in younger stands. Consequently, more VI values are allocated far from the VI maximum limit (saturation value), resulting in a greater dispersion between 0 and the saturation limit value (Figure 4). As a result, NDVI_a could keep up with the increase in the biophysical variable, so that the relationship was direct (such as it is observed between age and other
biophysical variables), even for Eucalyptus (Figure 2f),
which biophysical data ranged from young stands up to adult ones and in most SUs had occurred the canopy closure. Therefore, if for Eucalyptus’ NDVI and SAVI the kind of relationship with wood volume varied according to the stand aging (and consequently the degree of canopy closure), which can be direct, indirect or non-significant; for NDVI_a the relationships were direct and significant throughout all plant development cycle.
Figure 3 – Differences between NDVI and NDVI_a in the relationship with wood volume from Eucalyptus and Pinus stands. “a/AR” is the factor adjusting NDVI, which generates NDVI_a.
These results suggest that by enlarging the dynamic range of a VI, as occurred with NDVI_a, the possibility for either monitoring or estimating with higher accuracy wider range of biophysical parameters values increases. This approach could help reduce difficulties in estimating yield from forest plantations using remote sensing data due to wide ranges of forest biophysical parameters values associated with a reduced dynamic range of either spectral reflectance or VIs (Danson, 1987; De Wulf et al., 1990; Orue, 2002). The ability to maximize
sensitivity to biophysical parameters, preferably in a linear manner, is an important criteria when evaluating a VI performance (Ponzoni (2001). Furthermore, both reduction in saturation effects and improvement of linearity would increase precision achieved in biophysical parameters estimates from VIs (Huete et al., 2002).
Finally, it is noted that as more detailed and large the forest age data set, more specific tend to be the adjustments for NDVI values corresponding to a given stand. Over Eucalyptus area there were more numbers
Figure 4 – Effect of the stand age-based adjustment factor on NDVI frequencies values within Eucalyptus and Pinus stands. NDVI_a represents the adjusted index.
of “a/AR” factors (34), compared to Pinus (4), so that the 69 NDVI values calculated within Eucalyptus stands could be adjusted using 34 “a/AR” factors, whereas in Pinus the 111 NDVI values were adjusted by only 4 “a/AR” factors, Figure 3, achieving performance similar to SAVI (Figure 2). Therefore, it was found that the higher the variability in age data (Table 1), the better the adjustment of the index.
5. CONCLUSIONS
The use of stand’s tree age as an adjustment factor to NDVI increases its dynamic range, enabling the new index (NDVI_a) to keep the sensitivity to increases in biophysical parameters values, even after the canopy closure of the forest plantations. In fact, it was shown that the adjustment by age was worth to be applied only when the VI data were saturated.
Over young stands of Pinus, from which image’s spectral response was mostly not saturated, NDVI_a did not return significant differences when compared to both NDVI and SAVI, suggesting that in situations of open canopy the spectral information by itself is sufficient to monitor the amount of vegetation. On the other hand, the performance of NDVI_a was superior to both NDVI and SAVI to predict wood volume variations over the Eucalyptus stands, areas which the VI signals were significantly saturated.
6. REFERENCES
Abraf. Anuário Estatístico da Abraf 2011- Ano base 2010. Brasilia, D.F.: 2011. 130p.
Ardo J. Volume quantification of coniferous forest compartments using spectral radiance recorded by Landsat Thematic Mapper. International Journal of Remote Sensing. 1992;13:1779-86.
Baret F, Guyot G. Potential and limits of
vegetation índices for LAI and APAR assessment. Remote Sensing of Environment. 1991;35(2-3):161-73.
Berra EF. Avaliação e comparação de imagens Liss-III/Resourcesat-1 E TM/Landsat 5 para estimar volume de madeira de um plantio de pinus Elliottii [dissertação]. Porto Alegre: Universidade Federal do Rio Grande do Sul; 2013.
Berra E.F., C. Brandelero, R.S. Pereira, E. Sebem, L.C. de Godoy Goergen, A.C.P. Benedetti, and D.B. Lippert. Estimativa do volume total de madeira em espécies de eucalipto a partir de imagens de satélite Landsat. Ciência Florestal. 2012;22:853-64.
Bolfe ÉL. Desenvolvimento de uma metodologia para a estimativa de biomassa e de carbono em sistemas agroflorestais por meio de imagens orbitais [tese]. Campinas: Universidade Estadual de Campinas; 2010.
Bolfe ÉL.,M.Batistella, and M.C. Ferreira. Correlação de variáveis espectrais e estoque de carbono da biomassa aérea de sistemas
agroflorestais. Pesquisa Agropecuária Brasileira. 2012;47:1261-9.
Boyd DS, Danson FM. Satellite remote sensing of forest resources: three decades of research development. Progress in Physical Geography. 2005;29: 1-26.
Carreiras J.,J. Pereira, and J.S. Pereira. Estimation of tree canopy cover in evergreen oak woodlands using remote sensing. Forest Ecology and Management. 2006;223:45-53.
CEMETRS. Atlas climático do Rio Grande do Sul. Centro Estadual de Meteorologia. Fundação Estadual de Pesquisa Agropecuária, Embrapa Clima Temperado e Embrapa Trigo. 2011. [acessado em: 5 março 2012]. Disponível em: http://www.cemet.rs.gov.br/area/7/
Atlas_Clim%C3%A1tico
Chavez PS. An improved dark-object subtraction technique for atmospheric scattering correction of multispectral data. Remote Sensing of
Environment. 1988;24:459-79.
Danson FM. Preliminary evaluation of the relationships between SPOT-1 HRV data and forest stand parameters. International Journal of Remote Sensing. 1987;8:1571-5.
Danson FM, Curran PJ. Factors affecting the remotely sensed response of coniferous forest plantations. Remote Sensing of Environment.
De Wulf,R.R.,R.E. Goossens,B.P. de Roover, and F.C. Borry. Extraction of forest stand parameters from panchromatic and multispectral SPOT-1 data. International Journal of Remote Sensing.
1990;11:1571-88.
Empresa Brasileira de Pesquisa Agropecuária -Embrapa. Levantamento de reconhecimento dos solos do Estado do Rio Grande do Sul. Rio de Janeiro: 1990. 431p.
Foody G.M., D.S. Boyd, and M.E.J Cutler. Predictive relations of tropical forest biomass from Landsat TM data and their transferability between regions. Remote Sensing of Environment.
2003;85:463-74.
Franklin J. Thematic mapper analysis of coniferous forest structure and composition. International Journal of Remote Sensing.
1986;7:1287-301.
Ghahramany L., P. Fatehi, and H. Ghazanfari. Estimation of Basal Area in West Oak Forests of Iran Using Remote Sensing Imagery. International Journal of Geosciences. 2012;3:398-403.
Gonçalves F.G,. M. Yatskov, J.R.d. Santos, R.N. Treuhaft, and B.E. Law. Relating LANDSAT ETM+ and forest inventory data for mapping
successional stages in a tropical wet
forestRelacionando LANDSAT ETM+ e dados de inventário florestal para mapeamento estádios sucessionais em uma floresta tropical úmida. Ambiencia. 2010;6:166-74.
Huete A., K. Didan, T. Miura, E.P. Rodriguez, X. Gao, and L.G. Ferreira. Overview of the radiometric and biophysical performance of the MODIS vegetation indices. Remote Sensing of Environment. 2002;83:195-213.
Huete AR. A soil-adjusted vegetation index (SAVI). Remote Sensing of Environment. 1988;25:295-309.
Huete AR. Soil influences in remotely sensed vegetation-canopy spectra. New York:Wiley; 1989. p.107-41. (Wiley series in remote sensing)
Instituto Brasileiro de Geografia e Estatística -IBGE Mapa de Solos do Brasil (Escala
1:5.000.000). Rio de Janeiro: IBGE; 2001. v.821.
Jordan CF. Derivation of leaf-area index from quality of light on the forest floor. Ecology. 1969;50(4):663-6
Mcdonald A.J., F.M Gemmell, and P.E. Lewis. Investigation of the utility of spectral vegetation indices for determining information on coniferous forests. Remote Sensing of Environment.
1998;66:250-72.
Meng Q., C.J. Cieszewski, M. Madden, and B. Borders. A linear mixed-effects model of biomass and volume of trees using Landsat ETM+ images. Forest Ecology and Management. 2007;244:93-101.
Montgomery D.C., E.A. Peck, and G.G. Vining. Introduction to linear regression analysis. 4th.ed.
New York: Wiley-Interscience; c2006. v.821.
Mouissa H, Fournier RA. Mapping stand volumes of< i> Pinus halepensis</i> Mill in a semi-arid region using satellite imagery of the Sénalba Chergui forest in north-central Algeria. Journal of Arid Environments.2013;92:63-75.
Orue NE. Estimativa de volume de povoamentos de Pinus spp. utilizando dados do satélite Landsat [dissertação] Curitiba: Universidade Federal do Paraná; 2002.
Peterson D.L., W.E. Westman, N.J. Stephenson, V.G. Ambrosia, J.A. Brass, and M.A. Spanner. Analysis of forest structure using thematic mapper simulator data. IEEE Transactions on Geoscience and Remote Sensing. 1986;GE-24(1):113-21.
Ponzoni FJ. Comportamento espectral da vegetação. In: Meneses PR, Madeira Netto JS. Sensoriamento remoto: reflectância de alvos naturais. Brasília, DF: UNB; 2001. p.157-99.
Ponzoni FJ, Shimabukuro YE. Relação entre índices de vegetação (NDVI e SAVI) e parâmetros biométricos de plantios de Eucalyptus sp. Revista Árvore. 1998;22:337-66.
Rezende J.B., J.R Pereira, and D. de Oliveira Botelho. Expansão da cultura do eucalipto nos municípios mineiros e gestão territorial. Cerne. 2013;19:1-7.
Rondeaux G., M. Steven, and F. Baret.
Optimization of soil-adjusted vegetation indices. Remote Sensing of Environment. 1996;55:95-107.
Rouse Jr J.W., R.H. Hass, J.A. Schell, and D.W. Deering. Monitoring vegetation systems in the Great Plains with ERTS. NASA special publication,
v.351, p. 309, 1974. In: Proceedings Earth Resources Technology Satellite-1 Symposium, 3. Washington, D.C.: NASA. Goddart Space Flight Center; 1974. v.1. p.309-17. (NASA SP-351).
Salvador R, Pons X. On the applicability of Landsat TM images to Mediterranean forest inventories. Forest Ecology and Management.
1998;104:193-208.
Sanquetta C.R., J.A. Ubialli, C.P. Azevedo, L.M.B. Rossi, and A.P. Dalla Corte. Modelagem para prognose precoce do número de árvores e área basal por classe diamétrica para Tectona grandis. Naturalia. 2013;34.
Scolforo JRS. Curvas de índice de sítio para Pinus caribaea var. hondurensis. Revista do IPEF.
1992;45:40-7.
Câmara Setorial de Silvicultura. Agenda Estratégica do Setor de Florestas Plantadas. Brasilia, DF: Câmara Setorial de Silvicultura; 2009.
Sousa CLD. Uso de índice e de imagens-proporção para avaliar a quantidade de madeira em povoamentos de Pinus spp. São José dos Campos: Instituto Nacional de Pesquisas Espaciais, 1997
Trotter C.M., J.R. Dymond, and C.J. Goulding. Estimation of timber volume in a coniferous plantation forest using Landsat TM. International Journal of Remote Sensing. 1997;18:2209-23
Tucker CJ. Red and photographic infrared linear combinations for monitoring vegetation. Remote Sensing of Environment. 1970;8:127-50.
Turner D.P., W.B. Cohen, R.E. Kennedy, K.S. Fassnacht, and J.M. Briggs. Relationships between leaf area index and Landsat TM spectral vegetation indices across three temperate zone sites. Remote Sensing of Environment. 1999;70:52-68.
Weber E., Hasenack, H., Ferreira. C.J.S. Adaptação do modelo digital de elevação do SRTM para o sistema de referência oficial brasileiro e recorte por unidade da federação. porto Alegre: UFRGS -IB - Centro de Ecologia. [acessado em: 10 março, 2013] Disponível em: http://www.ecologia.ufrgs.br/ labgeo/.