M
ESTRADO
Marketing
T
RABALHO
F
INAL DE
M
ESTRADO
DISSERTATION
PASSENGER
PERCEPTION OF
SERVICE
QUALITY OF
CHINESE
AIRLINES AND THE IMPACT ON INTENTION TO RECOMMEND
ZHAO MENGYUAN
M
ESTRADO
E
M
M
ARKETING
T
RABALHO
F
INAL DE
M
ESTRADO
DISSERTATION
PASSENGER
PERCEPTION OF
SERVICE
QUALITY OF
CHINESE
AIRLINES AND THE IMPACT ON INTENTION TO RECOMMEND
ZHAO MENGYUAN
S
UPERVISORS
:
P
ROF
.
M
ARIA
M
ARGARIDA DE
M
ELO
C
OELHO
D
UARTE
P
ROF
.
A
NA
M
ARGARIDA
M
ENDES
C
AMELO
O
LIVEIRA
B
ROCHADO
i
Acknowledgements
I would like to express my depth gratitude to my supervisor, professor Margarida Duarte, who has given me so much useful advises not only on my dissertation but also on my career and life, and I would like to express my sincere gratitude to my supervisor of data analysis, professor Ana Brochado, for her professional orientation and her patience.
I want to thank all my professors for imparting knowledge and language skills to me, and I would like to thank all my classmates for their selfless help.
I am sincerely grateful to my family, who give me a steady support both spirital and financial, without their support I could not have done my study.
I also would like to thank my friend, Yifei Xu, who gave me technical help in data acquisition, and all my friends for supporting me in complementing my dissertation.
ii
Abstract
Service quality is crucial for satisfaction and repurchase intention. As the competition has increased strongly in the Chinese airline market, it is important for Chinese airlines to understand passenger perception of service quality, in order to satisfy their needs and to develop loyalty.
The main objective of this dissertation is to analyse passenger perception of service quality through online ratings and reviews, identifying the determinant service attributes of overall rating and of the intention to recommendation.
The data were gathered from the website of Skytrax, 2035 passenger evaluations of four Chinese airlines. The ratings of service attributes (seat comfort, food and beverages, cabin crew service, ground service, inflight entertainment, value for money) were included in the multiple linear regression model and logistic regression analyses, for the purpose of investigating their impact on passengers’ overall perception and intention to recommend. The results of this investigation revealed that, in first place, the six service attributes are all statistically significant in terms of solo and couple leisure travellers’ overall quality perception, “Inflight entertainment” is non-significant for family leisure passengers and business passengers. For family leisure passengers, “food and beverages” service quality is also not significant. Secondly, “value for money” is the most important attribute for all types of travellers in both overall service quality perception and passengers’ intention to recommend, while, “inflight entertainment” has the least impact. Third, the significant determinants of recommendation vary with traveller type. Finally, content analysis revealed eleven mind themes (“flight,” “food,” “crew,” “service,” “experience,” “seat,” “boarding,” “airline,” “airport,” “check” and “return”) of passengers’ reviews related to their overall experience.
iii
Resumo
A qualidade do serviço é uma parte crucial para a satisfação e para intenção de recompra. Como a concorrência aumentou fortemente para as companhias aéreas chinesas, é importante compreender as avaliações feita pelos passageiros da qualidade do serviço, a fim de satisfazer as necessidade dos clientes e desenvolver lealdade.
O principal objetivo desta dissertação é analisar a percepção de qualidade do serviço na ótica dos passageiros com recurso a classificações e análises on-line e identificar os atributos determinantes da avaliação global.
Os dados foram coletados das avaliações e classificações de companhias aéreas no site de Skytrax, 2035 itens de avaliações de passageiros da Air China, China Eastern Airlines, Hainan Airlines e China Southern Airlines foram selecionados, além das classificações dos atributos de serviço (conforto do assento, alimentos e bebidas , serviço da tripulação de cabine, serviço em terra, entretenimento a bordo, valor do dinheiro despendido) foram incluídos nas análises de regressão linear múltipla e de regressão logística, com o objetivo de investigar o seu impacto na percepção geral dos passageiros e na intenção de recomendar.
Os resultados desta investigação revelaram que, em primeiro lugar, que os seis atributos de serviço são estatisticamente significativos em termos de percepção geral da qualidade dos viajantes individuais e casais em lazer. Contudo, o entretenimento a bordo não é significativo para os passageiros em lazer e negócios. Além disso, para passageiros em lazer em família, a qualidade do serviço de alimentação e bebidas também não é significativa. Em segundo lugar, “valor ao dinheiro” é o atributo mais importante para todos os tipos de viajantes, tanto na percepção geral da qualidade do serviço quanto na intenção dos passageiros de recomendar, enquanto o “entretenimento a bordo” tem o menor impacto. Terceiro, os determinantes significativos da recomendação variam de acordo com o tipo de viajante. Por fim, a análise de conteúdo revelou onze temas mentais (“voo,” “comida,” “tripulação,” “serviço,” “experiência,” “assento,” “embarque,” “companhia aérea,” “aeroporto,” “check” e “ retorno ”) das avaliações dos passageiros relacionadas à com a sua experiência geral.
Palavras-chave: Qualidade de serviço; E-WOM; Intenção de recomendação; Companhias
iv
Index
Acknowledgements ... i Abstract ... ii Resumo ... iii CHAPTER 1 – INTRODUCTION ... 1CHAPTER 2 – LITERATURE REVIEW ... 2
2.1 Service Quality in The Airline Industry ... 2
2.1.1 Definition of Service Quality ... 2
2.1.2 Measurement of Airline Service Quality ... 3
2.1.3 Airline Service Quality Attributes ... 4
2.2 The Chinese Airline Market ... 5
2.3 Electronic Word-Of-Mouth and Intention to Recommend in the Airline Industry ... 6
CHAPTER 3 – DATA COLLECTION AND METHODOLOGY ... 7
3.1 Data Collection and description ... 7
3.2 Methods ... 9
CHAPTER 4 – RESULTS AND ANALYSIS ... 10
4.1 General description ... 10
4.2 Determinants of overall service quality perception ... 13
4.3 Determinants of recommendation ... 14
4.4 Content analysis of passenger reviews ... 15
4.4.1 Theme of “flight”... 18 4.4.2 Theme of “food” ... 18 4.4.3 Theme of “crew” ... 19 4.4.4 Theme of “service” ... 19 4.4.5 Theme of “experience” ... 20 4.4.6 Theme of “seat” ... 20 4.4.7 Theme of “boarding” ... 21 4.4.8 Theme of “airline” ... 21 4.4.9 Theme of “airport” ... 22 4.4.10 Theme of “check” ... 23 4.4.11 Theme of “return” ... 23
v
CHAPTER 5 – CONCLUSIONS, LIMITATIONS AND SUGGESTION
s
FOR FUTURE RESEARCH .. 245.1 Conclusions ... 24
5.2 Implications ...25
5.3 limitations and suggestions for future research ...25
REFERENCES ... 27
APPENDICES ... 32
Appendix 1. Questionnaire of airline service quality in Skytrax ... 32
Appendix 2. Descriptive Statistics for Categorical Variables ... 34
Appendix 3. Statistics for review writers ... 37
Appendix 4. ANOVA test of traveller type on overall rating ...40
Appendix 5. Multiple linear regression model summary by traveller type ... 40
Appendix 6. ANOVA test of multiple linear regression by traveller type ... 41
Appendix 7. Coefficients of multiple linear regression by traveller type ... 43
Appendix 8. Omnibus test of model coefficients of logistic regression by traveller type ... 45
Appendix 9. Logistic regression model summary by traveller type ... 45
Appendix 10. Coefficients of logistic regression by traveller type ... 46
1
CHAPTER 1 – INTRODUCTION
With the development of aeronautic technology and aviation security, air transport became an indispensable part of daily life. Passengers made 4.1 billion trips with scheduled airlines in 2017, an increase of 7.2% compared with the previous year. Moreover, the Asia-Pacific market, led by China, is the region with the strongest growth (10.7%) in passengers transport (ICAO,2018). It is expected that China will be the world’s largest aviation market by 2025 (IATA, 2018). On the other hand, competition is also intense. The four largest airline groups (China National Aviation Holding Group, China Southern Air Holding Group, China Eastern Air Holding Group, and Hainan Airlines Group) represented more than 85% of the total turnover in 2018 (CAAC, 2019). Further, the rapid development of high-speed railway has great impact on short-haul routes, and the domestic competition has increased intensely.
It has been reported that passenger perception of service quality of an airline plays an important role in perceived value (Chen, 2019), satisfaction (Chow, 2014; Jiang & Zhang, 2016) and loyalty (Farooq et al, 2018). Satisfaction is the key factor impacting behavioural intentions, which includes the intention to recommend (Finn, Wang & Frank, 2009). Furthermore, consumer-generated reviews are vital to companies in terms of understanding customer evaluations of products or service and their performance in face of their competition (Clow & Baack, 2018).
Therefore, in order to improve passenger satisfaction and recommendation, it is imperative that for Chinese airlines to understand passenger perception of service quality which help to identify and meet passenger needs. Moreover, although some studies have investigated Chinese airline service quality (Chow, 2015; Jiang & Zhang, 2016; Chen, Li & Liu, 2019), no research evaluated these issues through online ratings, electronic word of mouth, and intention to recommend of Chinese airlines.
This dissertation aims to: (1) analyse the passenger perception of service quality using online ratings and reviews, and (2) identify the determinant service attributes of overall perception and recommendation. Both qualitative and quantitative approaches were used in the research. In the qualitative analysis, passenger reviews in Skytrax of top four Chinese airlines (Air China, China Southern Airlines, China Eastern Airlines, Hainan Airlines) were analysed. In the quantitative analysis, multiple linear regression and logistic regression were used to investigate the impact of service attributes on “overall perception” and “intention to recommend.”
2
This dissertation is organized in five chapters, including this introductory chapter. The next chapter is the review of previous studies in the research topic. The third chapter presents data collection and methodology. On the fourth, data is analysed, and the results are discussed. The final chapter draws conclusions and presents the limitations of this study and suggestions for future research.
CHAPTER 2 – LITERATURE REVIEW
The review of previous research is organized in three parts. First, the construct of airline service quality is described, as well as the definition of service quality, measurement and attributes of airline service quality. Second, the Chinese airlines market is described. Last, electronic word-of-mouth and intention to recommend the airline are addressed.
2.1 Service quality in the airline industry
A large and increasing number of studies on airlines’ service quality pays particular attention to identifying and measuring service quality attributes (Chang & Yeh, 2002; Chou, Liu, Huang, Yih & Han, 2011; Bogicevic, Bujisic & Bilgihan, 2017; Gupta, 2018; Korfiatis, Stamolampros & Kourouthanassis, 2019), and the relationship with customer satisfaction, repurchase intention and loyalty (Anderson, Pearo & Widener, 2008; Chow, 2014; Chow, 2015; Jiang & Zhang, 2016; Farooq, Salam, Fayolle, Jaafar & Ayupp, 2018; Chen & Liu, 2019). Additionally, several studies have analysed customer perception of service quality (Jeeradist, Thawesaengskulthai & Sangsuwan, 2016; Borchado, Oliveira & Oliveira, 2019).
2.1.1 Definition of service quality
Due to the intangibility of services and the involvement of consumers, the quality of services is difficult to define and to measure compared with tangible products (Lovelock & Wirtz, 2016). Lovelock and Wirtz (2016) defined service quality as “the user’s perspective as consistently meeting or exceeding customer expectation (p. 551).”
It is important that service companies keep or increase their service quality, because the customer perceived quality determines companies’ long-term interests (Doyle & Stern, 2006), besides, low quality leads to competitive disadvantage and customer churn (Lovelock & Wirtz, 2016).
A large amount of research investigates the relationship between airline service quality and satisfaction and repurchase intention. In their analysis of Chinese airlines, Chow (2014)
3
demonstrated that service quality has a positive effect on satisfaction. Similarly, Jiang and Zhang (2016) found that service quality significantly influences passenger satisfaction which positively impacts leisure travellers’ loyalty, while it does not have a significant effect on business travellers. Chen and Liu (2019) analysed service quality and perceived value and found that airline service quality can be a significant and positive factor on repurchase intention.
There is evidence to suggest the relationship between airline service quality and branding. Chen et al. (2019) argue that airline service quality positively enhances the relationship between customer perceived value and brand awareness, which contribute to customer-based brand equity. Jeeradist et al. (2016) point out that service quality plays a vital role in brand image. Similarly, Dirsehan and Kurtulus (2018) developed a conceptual model of an airline brand and found that service quality positively influences brand image.
2.1.2 Measurement of airline service quality
Lovelock and Wirtz (2016) identified (1) soft measures of service quality which are obtained by interviews or questionnaires to understand customer perceptions and beliefs, and (2) hard measures which analyse by counting, timing or auditing service characteristics and components, as the two major broad categories of service quality measurement.
The most extensive method in the evaluation of service quality is the Service Quality (SERVQUAL) model (Parasuraman et al, 1985). SERVQUAL measures service quality through five dimensions, namely: reliability, assurance, tangibility, empathy and responsiveness (Parasuraman et al., 1985). Foster (2017) stated the advantages of SERVQUAL as standard, valid, reliable, parsimonious, and easy to interpret measure of service quality. In the SERVQUAL survey, customer expectation and perception are measured, which is helpful in examining the service gaps (Foster, 2017).
In the case of measurement of airline service quality, different methods have been created and adopted by different researchers. A considerable number of studies evaluate airline service quality using the SERVQUAL model (Chang & Yeh, 2002; Chou et al., 2011; Basfirinci & Mitra, 2015; Jeeradist et al., 2016; Li, Yu, Pei, Zhao & Tian, 2017; Gupta, 2018), while the AIRQUAL model is also adopted by some researchers (Ali, Dey & Filieri, 2015; Farooq et.al, 2018).
The AIRQUAL scale (Nadiri, Hussain, Ekiz & Erdogan, 2008) specifically measures airline service quality with 43 items scale. This scale has eight dimensions: “airline tangibles, terminal
4
tangibles, personnel, empathy, image, customer satisfaction, repurchase intention and word-of-mouth communication.”
Besides, Bogicevic et al. (2017) and Brochado et al. (2019) selected and measured service quality by analysing passengers’ electronic word-of-mouth. Additionally, Chow (2014, 2015) examined passenger satisfaction with complaints collected by Civil Aviation Administration of China (CAAC) and Laming and Mason (2014) used the Airs@t survey of International Air Transport Association (IATA).
2.1.3 Airline service quality attributes
Lovelock and Wirtz (2016) define determinant attributes as “those that actually determine buyers’ choices between competing alternatives” (p. 99). Doyle and Stern (2006) in their book identified ten service quality determinants: “reliability, access, credibility, security, knowledge, responsiveness, competence, courtesy, communication, and tangibles” (p. 356). As for the airline industry, Lovelock and Wirtz (2016) suggest that the attributes could be “the convenience of time, availability and privilege related to loyalty, inflight service quality, and reservation service simplicity” (p. 99). However, the determinant attributes of airline service may vary with the purpose and objects of each investigation.
Pearo and Widener (2008) considered airline service as involving six attributes: “interaction, aircraft, personal space, food, flight, and timeliness.” The interaction attribute represents the interaction with personnel in the whole journey includeding service attitude and wait time in check-in, efficiency in boarding, the information provided and responsiveness of onboard service and the appropriateness of baggage delivery. Aircraft attributes involve cleanliness, conditions and general appearance of the aircraft and cabin. Personal space includes seating space and arm and legroom. Food attribute assesses the quantity and quality of in-flight food. The timeliness describes the punctuality of departure and arrival. Flight attributes involve noise and air quality in flight and the flight smoothness.
Jiang and Zhang (2016) identified three factors of airline service, which are (1) “in-flight entertainment, Frequent Flyer Program (FFP) and airline response to flight delay and passenger complaints,” (2) “departure and arrival experiences, in-flight comfort and cabin crew professionalism” which involves in-flight food and beverage, and (3) “flight selection and ticket purchase experience.”
Gupta’s research (2018) of the Indian airline industry considered seven main attributes based on the SERVQUAL model: “tangibility; reliability, security, and safety; responsiveness;
5
assurance; effective communication and employees’ service; ticket pricing and airline image and additional features.” Further, the author points out that the attributes of tangibility, reliability, security, and safety, and ticket pricing are the most important attributes, which means that the catering quality is an indispensable measuring element in the measurement of airline service quality.
Farooq et al (2018) indicate five dimensions of service quality i.e. “airline tangibles; terminal tangibles; personnel services; empathy and image” are significant and positive factors of service quality and satisfaction. They suggest that to improve service quality, airlines should pay special attention to personnel services and image.
Li et al. (2017) analysed specifically in-flight service quality and proposed five criteria and eighteen sub-criteria. According to SERVQUAL survey, the attributes are employees namely cabin crew service, facilities included seats, entertainment and catering quality, flight schedule and information, support service namely travel-related service, and physical environment included air, thermal and sound comfort.
Furthermore, Chow (2014) analysed Chinese passengers’ complaints and identified factors influencing complaint and dissatisfaction as “on-time performance, baggage mishandling problems, weather conditions, and individual characteristics.” In addition, in another study of this field, Chow (2015) found that improvement of actual on-time performance benefits passenger satisfaction, while increasing expected on-time performance decreases satisfaction.
2.2 The Chinese airline market
In recent years, there has been an increasing number of studies investigating Chinese airline industry (Wang, Fan, Fu & Zhou, 2014; Jiang & Zhang, 2016; Chen, Chen & Wei, 2017; Li et al., 2017; Zhang, Johnson, Zhao & Nash, 2019), since the Asian-Pacific market, led by China, has the strongest growth in 2017 (ICAO, 2018). However, few studies focus on service quality in the context of Chinese airlines (Chow, 2015; Jiang & Zhang, 2016; Chen, Li & Liu, 2019). According to the Civil Aviation Administration of China (2019), in 2018 there were in total 60 airline companies in China Mainland. The majority of Chinese airlines were state-holdings, particularly the “big three” in which central government directly controls the companies, China Aviation Holding1, China Eastern Air Holding Group2 and China Southern Air Holding
1
China National Aviation Holding Group includes Air China, Air China Cargo, Shenzhen Airlines, Shandong Airlines, Kunming Airlines, Tibet Airlines, Air China Inner Mongolia, Dalian Airlines and Beijing Airlines.
2
6
Group3 hold more than seven in ten of total turnover in 2018. The largest private airline
company is Hainan Airlines Group4, which represented approximately 16 per cent of total
turnover in 2018. The ownership of airlines influences financial performance as a U-shaped curve, which means that airlines with mixed ownership perform worse in financial indicators (Chen et al., 2017).
Wang et al. (2014) benchmarked the three major Chinese airlines, Air China, China Eastern Airlines and China Southern Airlines, with international leading brands in terms of productivity and profitability. Their study revealed that Chinese airlines put high yield and low price in domestic routes. For this reason, the profitability was high. Meanwhile, Chinese airlines still fell behind international leaders in both productivity and profitability.
The research of Jiang and Zhang (2016) found that passengers of Hainan Airlines are more satisfied with the ticket price and service quality, particularly the in-flight service, which leads to higher re-fly intention and loyalty compared with Air China, China Eastern Airlines and China Southern Airlines.
Moreover, the rapid development of high-speed railway has a great impact on the airline industry in China. Zhang et al. (2019) found that the inter-model competition of railway and air transport prompts airlines to reduce prices and route frequency.
2.3 Electronic word-of-mouth and intention to recommend in the airline industry
Solomon (2018) defines word-of-mouth as “product information that individuals transmit to other individuals” (p. 422), which customers consider more reliable than formal marketing information. WOM is a crucial factor in the purchasing decision, especially when buying for the first time or in expensive purchases (Mckincey, 2010). Positive WOM affects positively customers’ buying decision. Meanwhile, negative comments have greater influence than positive comments (Solomon, 2018). Kim et al. (2018) proved that homophily, tie-strength between website and customer are essential factors for credibility, which determines WOM and consumers’ purchase decision.
China United Airlines, China Eastern Airlines Jiangsu Limited, China Eastern Airlines Wuhan Limited and China Eastern Airlines Yunnan Limited.
3
China Southern Air Holding Group includes China Southern Airlines, Xiamen Airlines, China Southern Airlines Henan Airlines, Guizhou Airlines, Shantou Airlines, Chongqing Airlines, Hebei Airlines, Zhuhai Airlines and Jiangxi Airlines.
4
Hainan Airlines Group includes Hainan Airlines, Beijing Capital Airlines, Tianjin Airlines, Suparna Airlines, China Xinhua Airlines, Lucky Air, China West Air, Air Changan, Fuzhou Airlines, Urumqi Air, Guangxi Beibu Gulf Airlines, Air Guilin and Grand China Air.
7
Therefore, consumer-generated reviews are vital to companies in terms of understanding customer evaluations of products or service and their performance in face of competition (Clow & Baack, 2018), and for marketers, dealing with negative reviews is complicated and more important than positive comments (Laczniak, DeCarlo & Ramaswami, 2001). Moreover, social listening contributes to brand image and brand advocacy which can enhance consumer endorsement and brand equity (Clow & Baack, 2018).
Abubaker, Ilkan, Al-Tal and Eluwoled (2017) investigated the medical tourism industry and found that eWOM significantly influences the revisit intention. In the airline industry, previous research has indicated that service quality, perceived value and satisfaction significantly and positively influence passengers’ WOM (Nikookar, Rahrovy, Razi & Ghassemi, 2015).
As mobile connectivity penetrates in the consumer community, the decision-making process becomes more social. Consumers pay more attention to seeking advice and product reviews (Kotler & Setiawan, 2017). Consequently, positive word-of-mouth and intention to recommend become even more important in the digital age.
Meanwhile, a large number of studies address the intention to recommend construct. Finn, Wang and Frank (2009) developed a model to analyse e-services consumer’s intention to recommend moderating online customer satisfaction. They found that satisfaction is the essential factor of behavioural intentions, which includes the intention to recommend, and they found that overall satisfaction positively influences consumers’ intention to recommend on e-services, such as airline ticket selling. Hosany and Prayag (2015) found that customers who evaluated tourism service with positive emotions such as happy, content, pleasant and surprise are more likely to recommend the brand. Further, Nikookar et al. (2015) indicated that WOM of airlines positively impacts referral intention.
CHAPTER 3 - DATA COLLECTION AND METHODOLOGY
3.1 Data collection and description
The data were gathered from the website of Skytrax (www.airlinequality.com), the professional organization in passengers’ opinion survey of service quality in the civil air industry. The airlines reviews and rating website allows passengers to evaluate their trips for more than 490 airline brands. The reviewer should present their autonym and evidence of flight, but the reviewers’ information can be hidden as optional.
8
For the purpose of analysing airlines of China Continent, passenger evaluations of the flagship brands of the “big four” airline groups i.e. Air China, China Eastern Airlines, China Southern Airlines and Hainan Airlines were selected, since the largest four aviation groups represented approximately 86 per cents of total transport turnover in 2018 (CAAC, 2019).
All airline reviews are in English and ranging between 150 to 3500 characters. Passengers evaluate their trip with an overall rating from 1 to 10. They also assess seven service attributes: (1) value for money; (2) ground service; (3) seat comfort; (4) cabin staff service; (5) food and beverages; (6) inflight entertainment and (7) cabin WiFi and connectivity, on a scale from 1 to 5. In addition, the last three attributes are not mandatory to fill out. Moreover, the airline brand, trip date, route information, cabin class and traveller type are required, while the aircraft type, intention to recommend and trip photos are optional to fill out.
The initial database had 3332 passenger reviews and trip information of the four Chinese airline brands. Data were extracted from the website using Python on the 21st of April 2019.
After removing cases with missing values, the valid data consisted of 2035 cases (quantitative and qualitative feedback provided by 2035 airline passengers).
In view of the large volume of missing values, the variable of the author name, aircraft type and cabin WiFi connectivity were excluded from the analysis. The database of this study consists of eighteen variables (1) Airline Brands (Air China, China Eastern Airlines, Hainan Airlines and China Southern Airlines), (2) Overall Rating (from 1 to 10), (3) Review Title, (4) Author’s Living Country, (5) Review Published Date, (6) Review Content, (7) Type of Traveller (Solo Leisure, Couple Leisure, Family Leisure and Business), (8) Cabin Class Type (Economy Class, Premium Economy, Business Class and First Class), (9) Route Type (China Continent Domestic, International/Regional), (10) Flight Type (Direct and Indirect), (11) Flight Date, (12) Seat Comfort (from 1 to 5), (13) Cabin Staff Service (from 1 to 5), (14) Food and Beverages (from 1 to 5), (15) Inflight Entertainment (from 1 to 5), (16) Ground Service (from 1 to 5), (17) Value for Money (from 1 to 5), (18) Intention to Recommend (Recommended, Not Recommended).
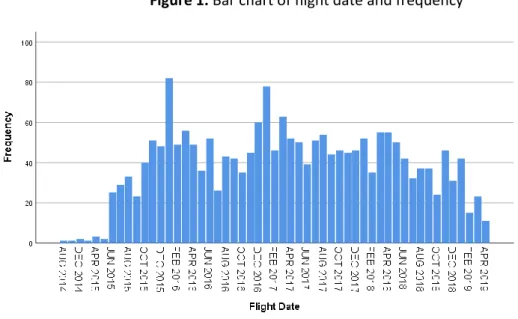
More than half of reviews (57.3%) are comments on China Southern Airlines, 18.7 per cent of Air China, 12.7 per cent of China Eastern Airlines and 11.3 per cent of Hainan Airlines. The flight dates that passengers evaluated are from August of 2014 until April of 2019. Most cases are fom June 2015 onwards (Figure 1).
9
Figure 1. Bar chart of flight date and frequency
The reviews were written by travellers from 62 countries. More than seven in ten reviews were written by passengers from Eastern Asia (27%), North America (26%) and Europe (20%). Approximately 23% of authors were from China.
Table 1. Statistics of airline reviews by passenger residence
Variable Category Frequency (%)
Region Eastern Asia 544 26.73
Southern and South-Eastern Asia 140 6.88
Central and Western Asia 17 0.84
Europe 413 20.29
North America 539 26.49
Latin America and the Caribbean 11 0.54
Oceania 367 18.03
Africa 4 0.20
Total 2035 100.00
3.2 Methods
In order to identify the relationship between overall satisfaction and service quality attributes, multiple linear regression method was used, with “overall rating” as the dependent variable. Moreover, the determinants of the dependent variable, passengers’ intention to recommend, were investigated resorting to logistic regression. The determinants of quality perception and intention to recommend resorted in previous studies (Chang & Yeh, 2002; Chou et al, 2011;
10
Bogicevic et al, 2017; Gupta, 2018; Korfiatis et al, 2019). The variables of seat comfort, cabin staff service, food and beverages, inflight entertainment, ground service and value for money were included as independent variables for the two regressions.
As for the quantitative analysis, cases were divided into four groups based on traveller type (solo leisure, couple leisure, family leisure and business travellers), since the impact of type is significant (F = 7.231; p = 0.000) on overall perception and on the recommendation. Different type of travellers has different perception of service quality, and the effects of determinants varied.
For the purpose of analysing passenger reviews, content analysis was performed to calculate the frequency of words related to travel experience and to draw a concept map of passenger perception, using the Leximancer software.
CHAPTER 4 - RESULTS AND ANALYSIS
The quantitative analysis is divided into two parts: (1) the analysis of overall service perception using the multiple linear regression method, and (2) the analysis of intention to recommend, adopting logistic regression. In order to account for possible heterogeneity, the results of the analysis are estimated by traveller type as solo leisure, couple leisure, family leisure and business. In the section of qualitative analysis, a content analysis was performed including word frequency analysis and concept mapping.
4.1. General Description
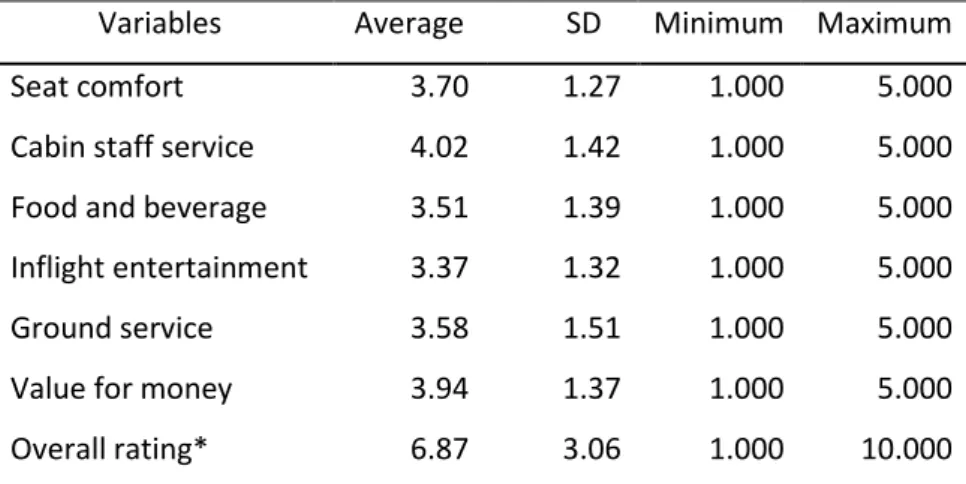
First, the numerical characteristics of the sample were explored by performing a descriptive analysis. Table 2 presents summary statistics for dependent and independent variables. Service attributes are measured on a scale ranging from 1 to 5 and the “overall rating” in a scale ranging from 1 to 10. Passengers grade highest “cabin staff service” (4.02) on average than “value for money” (3.94) while the average for “inflight entertainment” received the lowest score (3.37). Besides, the average for “overall rating” is 6.87 (S.D.=3.06).
11
Table 2- Descriptive statistics of dependent and independent variables
Variables Average SD Minimum Maximum Seat comfort 3.70 1.27 1.000 5.000 Cabin staff service 4.02 1.42 1.000 5.000 Food and beverage 3.51 1.39 1.000 5.000 Inflight entertainment 3.37 1.32 1.000 5.000 Ground service 3.58 1.51 1.000 5.000 Value for money 3.94 1.37 1.000 5.000 Overall rating* 6.87 3.06 1.000 10.000 Note: *Overall rating was measured on a 10-point scale (1-10). All other attributes on a 5-point scale (1-5).
Figure 2 shows the distribution of “overall rating” as being left-skewed (skewness = -0.94), with most travellers’ ratings being in the range of 7 to 9.
Figure 2 - Histogram of the overall rating
As for traveller type, approximately half (47%) of the passengers travel alone for leisure, which more than twice higher than couple leisure (17%), family leisure (15%), and business travellers (21%).
Table 3 - Descriptive statistics by traveller type
Type of Traveller Frequency % Solo Leisure 950 46.68 Couple Leisure 343 16.86 Family Leisure 310 15.23
Business 432 21.23
12
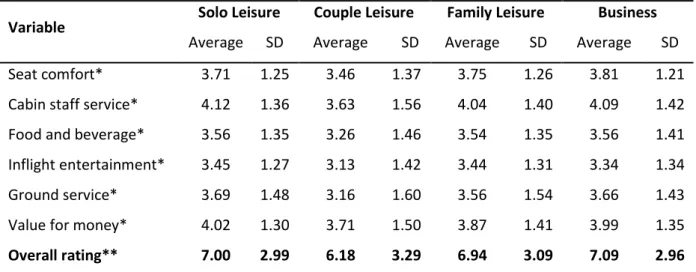
Differences between the four groups are summarized in Table 4. The results of the non-parametric test One Way ANOVA revealed that the “overall rating” varies according to the traveller type (F=7.231; p=0.000). Business travellers showed a highest value (7.1) and couple leisure the lowest (6.2). Couple leisure travellers held the lowest averages in all service attributes and overall rating. Solo leisure passengers evaluate service quality, in all dimensions, with higher average score, than total average. In contrast, the average scores from couples are lower in all dimensions. The averages for “ground service” and “value for money” from family leisure group are below the average for all travellers, while business travellers score less in “inflight entertainment”.
Table 4 – Descriptive data for variables by traveller type
Variable Solo Leisure Couple Leisure Family Leisure Business
Average SD Average SD Average SD Average SD Seat comfort* 3.71 1.25 3.46 1.37 3.75 1.26 3.81 1.21 Cabin staff service* 4.12 1.36 3.63 1.56 4.04 1.40 4.09 1.42 Food and beverage* 3.56 1.35 3.26 1.46 3.54 1.35 3.56 1.41 Inflight entertainment* 3.45 1.27 3.13 1.42 3.44 1.31 3.34 1.34 Ground service* 3.69 1.48 3.16 1.60 3.56 1.54 3.66 1.43 Value for money* 4.02 1.30 3.71 1.50 3.87 1.41 3.99 1.35
Overall rating** 7.00 2.99 6.18 3.29 6.94 3.09 7.09 2.96
Note: *Assessed with a 5-point scale (1-5); ** Assessed with a 10-point scale (1-10)
More than two thirds (73.6%) of all passengers intended to recommend the airline company. The results of the Chi-square test of independence revealed the existence of association between the intention to recommend and traveller type (Χ2=21.799; p=0.000). Table 5
compares also the proportion (63.9%) of couple leisure travellers who intended to recommend, which is below other groups, while business travellers are more likely to recommend than others.
13
Table 5 - Descriptive data for recommendation by traveller type
Rcommendation
Solo Leisure Couple Leisure Family Leisure Business Total
N % N % N % N % N %
Not Recommend
231 24.3 125 36.4 79 25.5 102 23.6 537 26.4 Recommend 719 75.7 218 63.6 231 74.5 330 76.4 1498 73.6
4.2 Determinants of overall service quality perception
This section presents the results of multiple linear regression in order to test the impact of determinants (i.e., service attributes) on overall perception. Besides, different results between traveller types are analysed and discussed.
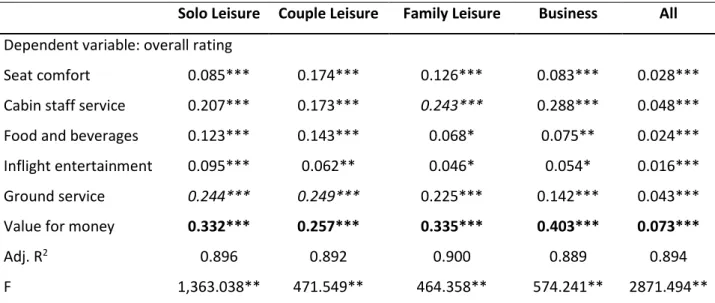
According to the ANOVA tests of the four multiple linear regression models based on traveller type and ANOVA of all samples, at least one of the independent variables has a significant impact on overall service perception. The attributes explain approximately 90 per cent of differences in overall service quality perception, on all samples (89.4%), solo leisure (89.6%), couple leisure (89.2%), family leisure (90%) and business travellers (88.9%). Therefore, in order to estimate the significance of each independent variable, coefficients are analysed (Table 6).
Table 6 - Standardized coefficients of multiple linear regression
Solo Leisure Couple Leisure Family Leisure Business All
Dependent variable: overall rating
Seat comfort 0.085*** 0.174*** 0.126*** 0.083*** 0.028*** Cabin staff service 0.207*** 0.173*** 0.243*** 0.288*** 0.048*** Food and beverages 0.123*** 0.143*** 0.068* 0.075** 0.024*** Inflight entertainment 0.095*** 0.062** 0.046* 0.054* 0.016*** Ground service 0.244*** 0.249*** 0.225*** 0.142*** 0.043*** Value for money 0.332*** 0.257*** 0.335*** 0.403*** 0.073***
Adj. R2 0.896 0.892 0.900 0.889 0.894
F 1,363.038** 471.549** 464.358** 574.241** 2871.494** Note: *Significant at 10%; **significant at 5%; ***significant at 1%
14
rating”. However, there are differences between traveller type groups. For solo and couple leisure travellers, all six service attributes are statistically significant at the 5% significance level; they positively influence the overall perception (all estimates are positive), as expected. The attribute “inflight entertainment” is not statistically significant for family leisure type as well as the business group. Interestingly, the “food and beverages” quality did not show any significant impact in terms of family travellers. “Value for money” has the most critical and positive influence on evaluating overall service quality in all four groups and all samples. However, the second most important attribute (in terms of average impact) vary. For solo leisure and couple leisure is “ground service”, while for family leisure and business is “cabin staff service”.
Meanwhile, the least significantly influential attribute for all observations is “inflight entertainment”, for solo leisure traveller is “seat comfort”, for couple leisure is “inflight entertainment”, and for family and business passengers is “food and beverages”.
In summary, all six independent variables are significant determinants in all samples, solo leisure and couple leisure travellers’ overall perception. For family leisure travellers, five variables are significant: seat comfort, cabin staff service, inflight entertainment, ground service and value for money. While for business travellers, only “food and beverages” attribute is not significant.
4.3 Determinants of recommendation
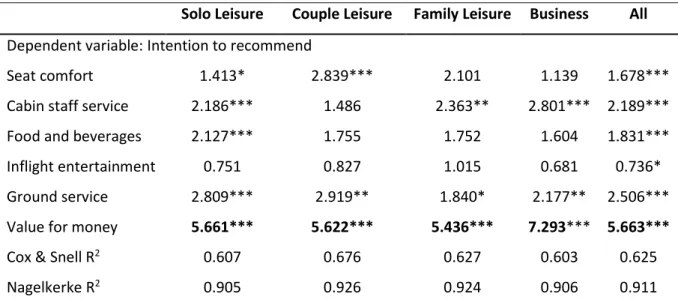
In this section, the results of logistic regression by traveller type are presented for the purpose of investigating the significant determinants of passengers’ intention to recommend. The regression models of four traveller types and of all observations are significant, which means that at least one of the independent variables determines passengers’ intention to recommend.
As described in Table 7, only the attribute of “inflight entertainment” is not significant for all samples. While the significant determinants for each traveller type are different. However, “value for money” significantly and positively determines passengers’ intention to recommend in all four types and in all samples (Exp(B)solo leisure= 5.661, Exp(B)couple leisure = 5.622,
Exp(B)family leisure = 5.436, Exp(B)business = 7.293, Exp(B)all samples =5.633). In other words, passengers
who evaluated “value for money” with higher scores, are more likely to recommend the airline brand.
15
samples. Moreover, “cabin staff service” quality significantly impacts recommendation, except for couple leisure passengers. “Ground service” quality is significant for all types, except family leisure. Only for couple leisure travellers, the “seat comfort” attribute is statistically significant. “Food and beverages” quality merely influence solo leisure passengers. Consequently, it suggests that Chinese airlines should pay special attention to “value for money”, “inflight staff service” and “ground service” quality in terms of boosting passenger recommendation.
Table 7 – Coefficients of logistic regression
Solo Leisure Couple Leisure Family Leisure Business All
Dependent variable: Intention to recommend
Seat comfort 1.413* 2.839*** 2.101 1.139 1.678*** Cabin staff service 2.186*** 1.486 2.363** 2.801*** 2.189*** Food and beverages 2.127*** 1.755 1.752 1.604 1.831*** Inflight entertainment 0.751 0.827 1.015 0.681 0.736* Ground service 2.809*** 2.919** 1.840* 2.177** 2.506*** Value for money 5.661*** 5.622*** 5.436*** 7.293*** 5.663***
Cox & Snell R2 0.607 0.676 0.627 0.603 0.625
Nagelkerke R2 0.905 0.926 0.924 0.906 0.911
Note: *Significant at 10%; **significant at 5%; ***significant at 1%
In brief, all service attributes except “inflight entertainment” are statistically significant for all samples on the recommendation. For solo leisure there are four significant determinants: value for money, ground service, cabin staff service, food and beverages. There are three significant attributes for couple leisure: value for money, ground service, and seat comfort. Only value for money and cabin staff service are significant for family leisure type. Value for money, cabin staff service, and ground service are significant for business travellers.
4.4 Content analysis of passenger reviews
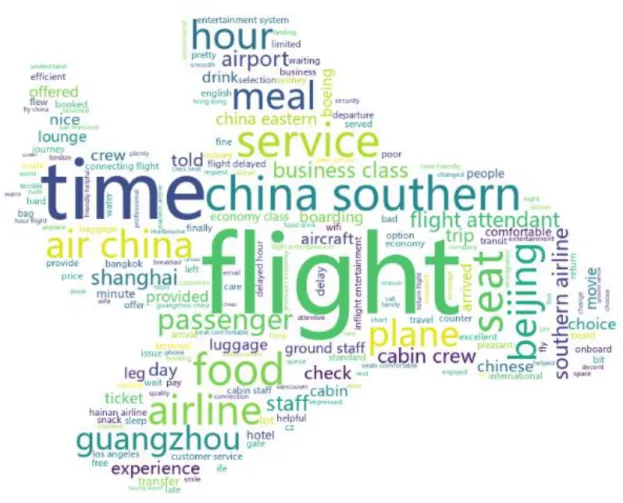
In this section, the results of the content analysis of 2035 passenger reviews are presented. Figure 3 illustrates a word cloud of the two hundred most frequent words of all comments. As can be seen, the most frequent concepts are, for example, “flight,” “time,” and “service”.
16
17
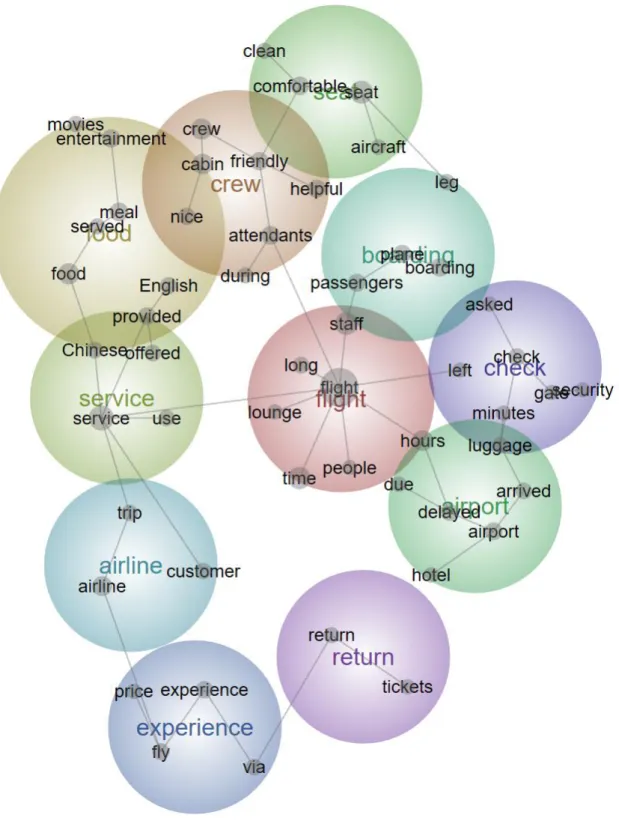
Figure 4 shows the words of themes and the relevant concepts summarized from reviews. There are eleven themes sorted by theme scale: “flight”(relevance = 100%), “food”(29%), “crew”(25%), “service”(44%), “experience”(18%), “seat”(36%), “boarding”(15%), “airline”(28%), “airport”(14%), “check”(12%), and “return”(8%). Besides, several concepts are included in each theme.
18
4.4.1 Theme of “flight”
The theme of “flight” is regarded as the most relevant theme, which is the core service of airlines. This theme consists of seven concepts: “flight” (count = 3943; relevance = 100%),
“staff” (1215; 31%), “time”(1253; 32%), “hours” (915; 23%), “long” (366; 9%), “lounge” (226; 6%), and “people”(171; 4%).
4.4.2 Theme of “food”
There are seven concepts of the second theme: “food”(1131; 29%), “meal”(701; 18%), “entertainment” (684; 17%), “provided” (526; 13%), “English” (461; 12%), “served” (323; 8%), and “movies” (341; 9%), which are related to the inflight supplementary services of full service airlines. A majority of passengers evaluated inflight supplementary services. There are “[T]his flight was nice, but you just want to be finished with the long trip, so I do not remember much of this 4[-]hour flight. Air China had a nice special price for this trip,
without the price I would have taken another option, with a much shorter transit stop.”
aaaa (Norway, Air China) “We sat in the lounge from 6[pm] to 2:30[am] before [the] flight took off at 3:00[am]. To
my most surprise, after 10:30[pm], there was no staff in the lounge and there were no snacks or food anymore.” (China, China Eastern Airlines) “[We had] a four[-]hour transit time which we needed, as the international long haul flights we took all required bus transfers from the plane to the terminal and reverse. The China Southern lounge covers two floors - the lower part is the catering area and offers hot and cold foods as well as hot/cold beverages and limited alcoholic drinks.
(New Zealand, China Southern Airlines) “Tokyo Haneda to San Jose via Beijing. I have flown quite a bit and was curious to try out a 5-star Chinese airline. The ticket was a good deal and I had the chance to have a few hours in Beijing during my layover.” (US, Hainan Airlines)
19 comments, for example:
4.4.3 Theme of “crew”
In this theme, concepts of “crew” (997; 25%), “cabin” (842; 21%), “attendants” (637; 16%), “friendly” (578; 15%), “helpful” (522; 13%), “nice” (501; 13%), “during” (283; 7%) are presented. The theme of “crew” is considered as passenger perception of airline staff service.
4.4.4 Theme of “service”
The Theme of “service” is made up of four concepts: “service” (1748; 44%), “Chinese” (414; 10%), “offered” (422; 11%), and “use” (404; 10%).
“Good entertainment, [t]hey have Hindi and English movies. OK food.”
(US, China Southern Airlines) “The in-flight entertainment had a lot of good [A]merican films but not so much tv shows.” (US, China Eastern Airlines) “Great food and drink[s], [two] mean meals and [a] free light meal between these with snacks.” (US, Hainan Airlines) “This has to be the worst service/food/treatment I've ever experienced. First the food was terrible. I couldn't even eat any of it and it seems that was a common thing for the people around me.” (US, Air China)
“The staff in Amsterdam was nice and helpful. From Amsterdam to Guangzhou airplane
was A330, [the] cabin crew was friendly.” (China, China Southern Airlines) “Cabin crew on the international flights cannot communicate in any other language than
Chinese. At the same time [,] you would not find them neither attentive nor friendly nor pleasant at [the] occasion.” (Poland, Air China) “Both customer service office[s] in Melbourne and [in] Sydney were very helpful. [...] Crew Very professional in all flights.” (Australia, China Eastern Airlines) “Hainan Airline[s] not only surprise me with how great their service was, but also let me fe[el] how important a well-trained flight attendant was for a customer with acrophobia, for the first time.” (China, Hainan Airlines)
20
4.4.5 Theme of “experience”
In this theme, passengers’ travel experiences are demonstrated with the concepts of “experience” (707; 18%), “fly” (647; 16%), “via” (892; 23%), and “price” (278; 7%).
4.4.6 Theme of “seat”
The theme of “seat” consists principally of the following concepts: “seat” (1402; 36%), “comfortable” (652; 17%), “clean” (306; 8%), “aircraft” (274; 7%), which are related to cabin facilities.
“The greatest improvement I realised is that mobile phones are allowed to use in flight mode, no longer having to switch off.” (Australia, China Southern Airlines) “However, refills were offered more than twice. Wines were only Chinese or substandard European brands [;] beers onboard only Yanjing was provided.” (Denmark, Air China) “They offered no accommodation, no apologies, despite it being their issue. I spent 300 AUD on accommodation out of my own pocket.” (Australia, China Eastern Airlines) “We were immediately offered a welcome drink (including a choice of Champagne) and [we] were warm-heartedly taken care of, with help in stowing our belongings etc. This went on for the entire flight.” (Austria, Hainan Airlines)
“Overall, this experience confirms no price can justify such low quality, I will definitely never fly with them again.” (Netherland, China Eastern Airlines) “But given the experience, bonuses and price, I would fly China Southern [Airlines] again.” (Netherland, China Southern Airlines) “I will fly again with Hainan Airlines, maybe next time, I will invest in [the] business seat[s], as I've heard [that] it [was] awesome.” (China, Hainan Airlines) “Bearing in mind the price of the flights I can't see what people complain about. Bearing in mind the overall standard and price I would fly again.” (UK, Air China)
“The aircraft was quite new and clean. The seat was very comfortable.” (China, Hainan Airlines) “The seats were comfortable and had a good recline.” (Ireland, China Eastern Airlines)
21
4.4.7 Theme of “boarding”
In this theme, travellers’ evaluation relating to “boarding” (572; 15%), “plane” (534; 14%), “passengers” (541; 14%), and “leg” (351; 9%) are assumed.
4.4.8 Theme of “airline”
This theme shows traveller perception of airline brands with the concepts of “airline” (1085; 28%), “trip” (448; 11%), and “customer” (346; 9%).
“Boarding and [out]boarding in Shanghai was always by bus, so boarding time was 1 h[our] before take off.” (France, Air China) “For CAN-SFO leg, boarding was chaotic slightly as there a number of wheel-chair bound elderly passengers and airport assistants shouting and checking out using walkie-talkie before confirming with the shuttle bus that all were on[ ]board to the plane.”
(Malaysia, China Southern Airlines) “This makes the Shanghai to Yantai leg a domestic flight. Seven passengers including my mother w[ere] denied boarding.” (United Arab Emirates, China Eastern Airlines) “Boarding with too much checking, keeping people in a long line outside the plane (before going up the stairs, taken to the plane by bus) and then checking again when entering the plane. Though I could hear the movies loud enough on a low volume, crew messages were very quiet and could not be heard properly.” (US, Hainan Airlines)
“Worst experience with this airline. Poor customer service round trip from the helpless crew in [John F. Kennedy International Airport] to the rude and lost in Shanghai.”
(US, China Eastern Airlines) “I ran into lots of trouble[s] on this trip, and it ended up costing me much more than if I had flown with a more reputable company [or] with better customer policies. I ended up paying lots of money for a very frustrating experience, not even able to take my trip after all.” (Japan, Air China) “[W]e boarded our flight back to Vancouver on a very old fashion plane where the seats were hard and uncomfortable.” (Canada, Air China) “I was pleasantly surprised with the quality of the aircraft, service and staff. Aircraft was clean and well maintained with very comfortable seats.” (US, China Southern Airlines)
22
4.4.9 Theme of “airport”
The theme of “airport” is the evaluation related to ground service, with the concepts: “airport” (551; 14%), “delays” (441; 11%), “arrived” (384; 10%), “luggage” (336; 9%), “due” (181; 5%) and “hotel” (225; 6%).
“The issue was when I arrived Shanghai my luggage was still in Guangzhou. I need to stay at the airport 3 hours to pick up it otherwise I need to pay the bill for delivering my luggage
to the hotel.” (US, China Southern Airlines) “China Eastern Airlines lost our luggage on the way, so that the nightmare continued [...]
To sum up, we arrived in Tokyo after a 38 hours trip and nearly 19 hours delay.”
(France, China Eastern Airlines) “Two legs delayed by an hour[.] [A]t least one was due to air traffic control restrictions which is not Air China's fault as such, but something you have to consider if you choose to transit through any airport in PRC. Also[,] worth knowing is that they will put you up in a cheap hotel [near] the airport if you have an overnight layover but you have to know to ask.” (Switzerland, Air China) “My negative comment is during my transfer in Beijing airport, where I had just over two hours to transfer, someone that I believe was an employee of Hainan airlines [who] requested money for helping me take my luggage from terminal (arrival) to terminal (departure). I accepted due to politeness of employee and the fact I was nervous about this transfer and welcomed assistance, but I wonder whether I could have received same assistance without need to pay, as Hainan Airlines kiosks were located along the route.” (China, Hainan Airlines) “It was, actually, beyond our expectations. We fly a lot and have been on a lot of airlines, but this was certainly one of the nicest experiences we had (if you ignore the poor lounge-performance). Highly recommended!” (Austria, Hainan Airlines) “I have no complaints regarding China Southern [Airlines], you get what you pay for. If you want more legroom, a better quality of food and a larger selection of movies[,] then pay double the price for a better[-]known airline.” (UK, China Southern Airlines)
23
4.4.10 Theme of “check”
This theme is composed of “check” (454; 12%), “asked” (232; 6%), “minutes” (200; 5%), “gate” (177; 4%), “left” (162; 4%), and “security” (130; 3%).
4.4.11 Theme of “return”
In the last theme, only two concepts are presented, which are “return” (322; 8%) and “tickets” (242; 6%).
“It would have been nice to have been able to check my baggage at [Taiwan Taoyuan International Airport] much earlier and still take a train to visit a nearby area for example like Zhongli. I arrived at the airport 5 hours before the flight since I had to check out of my hotel anyway. But then I had to wait until about 2.5 hours before departure before I was allowed to actually check my bag in, so I ended up spending a long time just sitting at the airport.” (Germany, Air China) “We were guided to the transfer desk, security check and the pointed to the next departure gate. All done in 20 mins.” (US, Hainan Airlines) “It took me more than 90 minutes of my two-hour transfer time to get through [customs] and security on the way to Beijing, and only slightly less on the way back. The whole process is chaotic after passport control on the way into China, you have to queue to get a golf cart to domestic departures, where you're left with no signage or directions at all.” (Australia, China Southern Airlines) “One was received the next day but another one got held at [Shanghai Pudong International Airport] for security check. I was asked if the staff at [Shanghai Pudong International Airport] actually can destroy my lock (my suitcase is Commodore brand, meaning if they did, the whole suitcase would be destroyed!)”
(Taiwan China, China Eastern Airlines)
“The ticket only states that [if] rebooking they will recalculate fees so that leaves them free to charge what they want. I could have booked a cheaper ticket on the spot going to Expedia but then they were going to cancel my return flight and I was returning with my friend which was already there.” (US, Air China) “We purchased our return tickets to Phuket from Vancouver for only $679 which was the
24
CHAPTER 5 – CONCLUSIONS, LIMITATIONS AND SUGGESTIONS FOR FUTURE RESEARCH
5.1 Conclusions
This dissertation has discussed the impact of airlines’ service attributes (seat comfort, cabin staff service quality, food and beverages, inflight entertainment, ground service, value for money) on passengers’ overall perception and their intention to recommend. Moreover, travellers’ e-WOM was also be investigated and presented as themes and concepts.
The results of this investigation show that, to begin with, for solo and couple leisure travellers, the six service attributes are all statistically significant in terms of passengers’ overall quality perception, but the attribute of inflight entertainment is not significant for family leisure and business passengers, besides, for family leisure passengers, food and beverages service quality is also not significant. Second, value for money is the most important attribute for all types of travellers in both overall service quality perception and passengers’ intention to recommend, while, inflight entertainment has the least impact. Third, in terms of intention to recommend, four attributes (cabin staff service, food and beverage, ground service, value for money) are significant for solo leisure travellers. Only ground service and value for money are statistically significant, and for family leisure and business passengers, only cabin staff service and value for money. Last but not least, content analysis revealed eleven mind themes (“flight”, “food”, “crew”, “service”, “experience”, “seat”, “boarding”, “airline”, “airport”,
“We purchased our return tickets to Phuket from Vancouver for only $679 which was the only bright side of this flight. Our flight from Vancouver to Nanjing was cramped and the seats were way too small for two adult men who are 5’10 and 6’2.”
(Canada, China Eastern Airlines) “My flight was one way from Seattle to Bangkok, and at first[,] they would not let me check[-]in, indicating I needed a return ticket. This is actually normal. I was a bit frustrated and[,] in my panic[,] neglected to say I had a visa.” (New Zealand, Hainan Airlines) “Recently I flew from Guangzhou to Amsterdam with China Southern Airlines in economy class, and I will fly back again in January. The price of the return ticket was acceptable because of some holiday discount from the official website.”
25
“check” and “return”) of passengers’ reviews related to their overall experience.
5.2 Implications
These findings may have managerial implications for Chinese airlines to understand and confirm customer needs and their perception of service quality, which provide a possibility to improve customer experience and to develop brand preference. Moreover, these findings have important implications for developing customer recommendation through electronic word-of-mouth.
First of all, according to the Annual Reports (2019) of Air China, China Eastern Airlines, Hainan Airlines, and China Southern Airlines, all four airlines are committed to develop an international strategy. Nevertheless, the “Passenger Load Factor” and “average Revenue per Passenger Kilometre” of international routes are below domestic routes. Hence, it is important for Chinese airlines to improve brand preference through increasing passenger satisfaction. Since the ratings and reviews are written by passengers from 62 countries, the results of this investigation provide Chinese airlines with better understanding of international customer perception of service quality and the determinants of their satisfaction. Second, the perception of “value for money” is nothing but crucial for all types of traveller. Passengers express their satisfaction and intention to recommend when they evaluated value for money high. The evidence from the dissertation suggests that Chinese airlines are supposed to give close attention to value for money in terms of service quality.
5.3 Limitations and suggestions for future research
Finally, a number of limitations need to be considered. First, due to the small observation number of couple leisure, family leisure and business travellers, the results may have limited generalizability. Second, only ratings and reviews of Air China, China Southern Airlines, China Eastern Airlines and Hainan Airlines were included in the analysis, which may not represent the passenger perception of Chinese airline industry. Third, the data was extracted from the website of Skytrax, and the reviews are in English, which indicates that the results not include the reviews of many Chinese passengers. Finally, only six attributes were included in analysis, nevertheless, other variables (e.g., brand, route and flight type, cabin WIFI and connectedness) may have impact on dependent variables.
Furthermore, there are some suggestions for futher research. The data of Chinese passengers and reviews of more chinese airline brands from Chinese online travel platforms such as Ctrip and Fliggy can be gathered and analysed. Finally, more variables can be included in the
26
analysis, and other advanced data analysis methods can be used.
27
References
Books:
Clow, K.E. & Baack, D. (2018). Integrated Advertising, Promotion and Marketing Communications. 8th Edition. Global Edition. London: Pearson Education.
Doyle, P. & Stern, F. (2006). Marketing Management and Strategy. 4th Edition. London: Pearson Prentice Hall.
Foster, S.T. (2017). Managing Quality: Integrating the Supply Chain. 6th Edition. Global Edition. London: Pearson Education.
Keller, K.L. (2013). Strategic Brand Management. 4th Edition. London: Pearson Education. Kotler, P. & Keller, K.L. (2009). Marketing Management. 13th Edition. New Jersey: Pearson Prentice Hall.
Kotler, P., Kartajaya, H. & Setiawan, I. (2017). Marketing 4.0: Moving from Traditional to Digital. 1st Edition. New Jersey: John Wiley & Sons.
Kotler, P. & Armstrong, G. (2018). Principles of Marketing. 17th Edition. London: Pearson Education.
Lovelock, C. & Wirtz, J. (2016). Services Marketing: People, Technology, Strategy. 8th Edition. London: Pearson Education.
Solomon, M.R. (2018). Consumer Behavior: Buying, Having, and Being. 12th Edition. Global Edition. London: Person Education.
Articles:
Abubakar, A. M., Ilkan, M., Al-Tal, R.M. & Eluwoled, K.K. (2017). eWOM, revisit intention, destination trust and gender. Journal of Hospitality and Tourism Management, 31, 220-227. Ali, F., Dey, B.L. & Filieri, R. (2015). An assessment of service quality and resulting customer satisfaction in Pakistan International Airlines: Finding from foreigners and overseas Pakistani customers. International Journal of Quality & Reliability Management, 32 (5), 486-520. Anderson, S., Pearo, L.K. & Widener, S.K. (2008). Drivers of Service Satisfaction: Linking Customer Satisfaction to the Service Concept and Customer Characteristics. Journal of Service
28 Research, 10(4), 365-381.
Basfirinci, C. & Mitra, A. (2015). A cross cultural investigation of airlines service quality through integration of SERVQUAL and the Kano model. Journal of Air Transport Management, 42, 239-248.
Bogicevic, V., Yang, W., Bujisic, M. & Bilgihan, A. (2017). Visual Data Mining: Analysis of Airline Service Quality Attributes. Journal of Quality Assurance in Hospitality & Tourism, 18(4), 509-530.
Brochado, A., Rita, P., Oliveira, C. & Oliveira, F. (2019). Airline passengers’ perceptions of service quality: themes in online reviews. International Journal of Contemporary Hospitality Management, 31(2), 855-873.
Brochado, A. & Paulo R. (2018). Exploring heterogeneity among backpackers in hostels. Current Issues in Tourism, 21(13), 1502-1520.
Brodie, R.J., Whittome, J.R.M. & Brush, G.J. (2009). Investigating the service brand: A customer value perspective. Journal of Business Research, 62, 345-355.
Chang, Y.H. & Yeh, C.H. (2002). A survey analysis of service quality for domestic airlines. European Journal of Operational Research, 139, 166-177.
Chen, C.F. & Chang, Y.Y. (2008). Airline brand equity, brand preference, and purchase intentions—The moderating effects of switching costs. Journal of Air Transport Management, 14, 40-42.
Chen, S.J., Chen, M.H. & Wei, H.L. (2017). Financial performance of Chinese airlines: Does state ownership matter? Journal of Air Transport Management, 33, 1-10.
Chen, L., Li, Y.Q. & Liu, C.H. (2019). How airline service quality determines the quantity of repurchase intention - Mediate and moderate effects of brand quality and perceived value. Journal of Air Transport Management, 75, 185-197.
Chou, C.C., Liu, L.J., Huang, S.F., Yih, J.M. & Han, T.C. (2011). An evaluation of airline service quality using the fuzzy weighted SERVQUAL method. Applied Soft Computing, 11, 2117-2128. Chow, C.K.W. (2014). Customer satisfaction and service quality in the Chinese airline industry. Journal of Air Transport Management, 35, 102-107.
29
Chinese airline industry. Journal of Air Transport Management, 47, 39-47.
Díaz, E. & Martín-Consuegra, D. (2016). A latent class segmentation analysis of airline based on website evaluation. Journal of Air Transport Management, 55, 20-40.
Dirsehan, T. & Kurtulus, S. (2018). Measuring brand image using a cognitive approach: Representing brands as a network in the Turkish airline industry. Journal of Air Transport Management, 67, 85-93.
Finn, A., Wang, L. and Frank, T. (2009). Attributes perceptions, customer satisfaction and intention to recommend e-services. Journal of Interactive Marketing, 23, 209-220.
Gupta, H. (2018). Evaluating service quality of airline industry using hybrid best worst method and VIKOR. Journal of Air Transport Management, 68, 35-47.
Hosany, S. & Prayag, G. (2015). Patterns of tourists’ emotional responses, satisfaction, and intention to recommend. Journal of Business Research, 66(6), 730-737.
Jeeradist, T., Thawesaengskulthai, N. & Sangsuwan, T. (2016). Using TRIZ to enhance passengers' perceptions of an airline's image through service quality and safety. Journal of Air Transport Management, 53, 131-139.
Jiang, H. & Zhang, Y. (2016). An investigation of service quality, customer satisfaction and loyalty in China's airline market. Journal of Air Transport Management, 57, 80-88.
Kim, S., Kandampully, J. & Bilgihan, A. (2018). The influence of eWOM communications: An application of online social network framework. Computers in Human Behavior, 80, 243-254. Korfiatis, N., Stamolampros, P. & Kourouthanassis, P. (2019). Measuring service quality from unstructured data: A topic modeling application on airline passengers’ online reviews. Expert Systems with Applications, 116, 472-486.
Kurtulmusoglu, F.B., Can, J.F. & Tolon, M. (2016). A voice in the skies: Listening to airline passenger preferences. Journal of Air Transport Management, 57, 130-137.
Laczniak, R.N., DeCarlo, T.E. & Ramaswami, S.N. (2001). Consumers’ responses to negative word-of-mouth communication: An attribution theory perspective. Journal of Consumer Psychology, 11(1), 57-73.
Laming, C. & Laming, K. (2014). Customer experience—An analysis of the concept and its performance in airline brands. Research in Transportation Business & Management, 10,