RESEARCH
Accuracy of the clinical pulmonary infection
score to differentiate ventilator-associated
tracheobronchitis from ventilator-associated
pneumonia
Alexandre Gaudet
1,2, Ignacio Martin‑Loeches
3,4, Pedro Povoa
5,6, Alejandro Rodriguez
7,8, Jorge Salluh
9,
Alain Duhamel
10,11, Saad Nseir
1,12*and TAVeM study group
Abstract
Background: Differentiating Ventilator‑Associated Tracheobronchitis (VAT) from Ventilator‑Associated Pneumonia (VAP) may be challenging for clinicians, yet their management currently differs. In this study, we evaluated the accu‑ racy of the Clinical Pulmonary Infection Score (CPIS) to differentiate VAT and VAP.
Methods: We performed a retrospective analysis based on the data from 2 independent prospective cohorts. Patients of the TAVeM database with a diagnosis of VAT (n = 320) or VAP (n = 369) were included in the derivation cohort. Patients admitted to the Intensive Care Centre of Lille University Hospital between January 1, 2016 and December 31, 2017 who had a diagnosis of VAT (n = 70) or VAP (n = 139) were included in the validation cohort. The accuracy of the CPIS to differentiate VAT from VAP was assessed within the 2 cohorts by calculating sensitivity and specificity values, establishing the ROC curves and choosing the best threshold according to the Youden index. Results: The areas under ROC curves of CPIS to differentiate VAT from VAP were calculated at 0.76 (95% CI [0.72–0.79]) in the derivation cohort and 0.67 (95% CI [0.6–0.75]) in the validation cohort. A CPIS value ≥ 7 was associated with the highest Youden index in both cohorts. With this cut‑off, sensitivity and specificity were respectively found at 0.51 and 0.88 in the derivation cohort, and at 0.45 and 0.89 in the validation cohort.
Conclusions: A CPIS value ≥ 7 reproducibly allowed to differentiate VAT from VAP with high specificity and PPV and moderate sensitivity and NPV in our derivation and validation cohorts.
Keywords: Mechanical ventilation, Lower respiratory tract infection, Tracheobronchitis, Pneumonia, CPIS
© The Author(s) 2020. This article is licensed under a Creative Commons Attribution 4.0 International License, which permits use, sharing, adaptation, distribution and reproduction in any medium or format, as long as you give appropriate credit to the original author(s) and the source, provide a link to the Creative Commons licence, and indicate if changes were made. The images or other third party material in this article are included in the article’s Creative Commons licence, unless indicated otherwise in a credit line to the material. If material is not included in the article’s Creative Commons licence and your intended use is not permitted by statutory regulation or exceeds the permitted use, you will need to obtain permission directly from the copyright holder. To view a copy of this licence, visit http://creat iveco mmons .org/licen ses/by/4.0/.
Background
Ventilator-Associated Lower Respiratory Tract Infections (VA-LRTI), including Ventilator-Associated Tracheo-bronchitis (VAT) and Ventilator-Associated Pneumonia (VAP), are the most frequent infectious complications in Intensive Care Units (ICU), concerning about 25% of critically ill subjects undergoing mechanical ventilation
[1]. Their diagnosis currently relies on symptoms of lower respiratory tract infection in patients intubated for more than 48 h with a positive culture of lower respira-tory microbiological sampling. In addition to these crite-ria, the presence of a new infiltrate on chest radiography allows to make the diagnosis of VAP. By contrast, VAT is characterized by the combination of the above-men-tioned criteria without new radiographic infiltrates [2].
The occurrence of VAP is associated with increased mortality, longer duration of mechanical ventilation and length of stay in the ICU. On the other hand, the
Open Access
*Correspondence: s‑nseir@chru‑lille.fr
1 Department of Intensive Care Medicine, Critical Care Centre, CHU Lille, Lille 59000, France
diagnosis of VAT seems to be linked with lower levels of mortality than VAP, even though being associated with increased length of mechanical ventilation and ICU stay [1]. The management of VAP currently relies on anti-microbial therapy, whereas current guidelines do not recommend the administration of antibiotics in VAT, making the distinction between these two entities a cru-cial point [2].
Although theoretically based on clearly defined crite-ria, differentiating VAT and VAP may sometimes be chal-lenging for the physician. Indeed, chest radiographies performed in the context of ICU often lead to multiple artefacts, additionally to numerous causes of non-infec-tious radiological opacities making the diagnosis of VAP tricky. In addition, a lack of sensitivity of chest radiog-raphy has been reported for the detection of VAP, thus leading to a likely underestimation of this diagnosis in mechanically ventilated patients [3–5].
Several tools have been developed to improve the detection of VAP. Amongst them, the Clinical Pulmonary Infection Score (CPIS) is a daily routine parameter-based score with moderate to good accuracy in the detection of VAP. This score, originally described by Pugin et al, has been declined in a simplified version, allowing its easier appliance by physicians at patient’s bedside [6, 7]. Based on the results of a single study, recent guidelines on the management of Hospital-Acquired Pneumonia and VAP suggest that a CPIS score ≤ 6 should lead to the early dis-continuation of antimicrobial therapy, being associated with a low probability of pneumonia [2, 8].
Considering these observations, the use of the CPIS in patients with microbiologically confirmed VA-LRTI might be proposed as a helpful tool for the early detec-tion of VAP. However, to the best of our knowledge, the evaluation of the CPIS in this indication has never been reported yet and would be of significant interest. Fur-thermore, such an evaluation should be preferentially performed in 2 independent cohorts to assess its repro-ducibility, given the heterogeneity in the performances of CPIS for the diagnosis of VAP in ventilated patients [9], and because this score was not initially developed to dis-tinguish VAT from VAP.
Therefore, we aimed in this study to evaluate the accu-racy of the CPIS to differentiate VAT from VAP in 2 independent cohorts of patients with microbiologically confirmed VA-LRTI.
Methods
Study design and patients
This is a retrospective study based on the analysis from the TAVeM database [1] and of a cohort of patients admitted in a single mixed ICU during a 2-year period.
The TAVeM study is a large prospective multinational observational study conducted in 114 ICUs in Europe and South America. Details about the design and patients of the TAVeM study have been previously published [1].
In our study, patients from the TAVeM database with a diagnosis of VA-LRTI were included in the derivation cohort.
Patients admitted in the single mixed ICU of the Lille University Hospital between 1 January 2016 and 31 December 2017 and with a diagnosis of VA-LRTI were included in the validation cohort.
Data collection
Patient demographic characteristics, severity scores, comorbidities, primary diagnoses, and prior antibiotic exposure were recorded at baseline for all patients. Fur-ther, data about clinical, biological and radiological diag-nostic criteria for VA-LRTI, microbiological diagdiag-nostic procedures, bacteriological findings, degree of severity on the onset of infection, antibiotic use and clinical out-comes were obtained.
Definitions VA‑LRTI
The diagnosis of VA-LRTI was based on the presence of at least 2 of the following criteria: body temperature of more than 38.5 °C or less than 36.5 °C, leucocyte count greater than 12,000 cells per μL or less than 4 000 cells per μL, and purulent endotracheal aspirate. Microbiolog-ical confirmation was needed for all episodes of infection, with the isolation in the endotracheal aspirate of at least 105 CFU per mL, or in bronchoalveolar lavage of at least
104 CFU per mL.
VAT was defined with the above-mentioned criteria with no radiographical signs of new pneumonia. Con-versely, VAP was defined by the presence of new or pro-gressive infiltrates on chest radiograph.
CPIS
A modified version of the CPIS was used in this study, as previously published in the literature (Additional file 1) [7]. Notably, we did not consider cultures of tracheal aspirate; leucocyte categories were reduced to two; three categories were used for the aspect of sputum; tracheal secretions were classified as few, moderate, large, and purulent. The CPIS score was calculated at the time of microbiological sampling for clinical suspicion of VA-LRTI by retaining for each variable the maximal attribut-able number of points over the 24 past hours.
Outcomes
The primary aim of this study was to evaluate the accu-racy of the CPIS to differentiate VAT from VAP in patients with microbiologically confirmed VA-LRTI.
Statistical analysis
Categorical variables were expressed as numbers (per-centages) and compared using Chi square test or Fisher’s exact test, as appropriate. Normality of distribution of continuous variables was checked graphically and using the Shapiro–Wilk test. Skewed continuous variables were presented as medians (interquartile ranges), and compared using Mann–Whitney U tests. Normally dis-tributed continuous variables were presented as means (SD), and compared using Student’s t tests. Correlations between skewed continuous variables were assessed using Spearman’s rank correlation tests, and regres-sion lines were displayed using simple linear regresregres-sion method.
To assess the diagnostic ability of CPIS to differenti-ate VAT from VAP, we performed a Receiver Operating Characteristics (ROC) analysis for the diagnosis of VAP in both derivation and validation cohorts. We computed the area under the ROC curve (AUC) and the sensitivity, specificity, positive and negative predictive values (PPV and NPV) as well as positive and negative likelihood
ratios for different cut-off values. The best cut-off for the discrimination between VAP and VAT was determined according to the Youden index.
All statistical tests were two-tailed and p values < 0.05 were considered statistically significant. Statistics Department of Lille University Hospital performed all data analyses using SAS software package, release 9.4 (SAS Institute, Cary, NC, USA).
Results
Three hundred twenty patients with VAT and 369 patients with VAP were included in the derivation cohort. Seventy patients with VAT and 136 patients with VAP were included in the validation cohort.
Percentage of male and percentage of cirrhosis were higher, whilst age was lower in patients with VAP com-pared to patients with VAT in the derivation cohort. SOFA score was higher and percentage of heart failure was lower in patients with VAP compared to patients with VAT in the validation cohort. Appropriate ini-tial antimicrobial therapy was more frequent in VAP than in VAT in the derivation cohort, and less frequent in VAP compared to VAT in the validation cohort (Table 1). Comparisons of baseline patients characteris-tics between derivation and validation cohorts are shown in Additional file 2.
Table 1 Baseline characteristics of patients
Data are presented as number (%) or mean (SD)
COPD Chronic obstructive pulmonary disease, SAPS Simplified acute physiology score, SOFA Sequential organ failure assessment, VAP Ventilator-associated
pneumonia, VAT Ventilator-associated tracheobronchitis
p value < 0.05 is indicated in italic characters
Derivation cohort P value Validation cohort P value
VAT (n = 320) VAP (n = 369) VAT (n = 70) VAP (n = 136)
Sex Male 199 (62%) 264 (72%) 51 (73%) 102 (75%) Female 121 (38%) 105 (28%) 0.009 19 (27%) 34 (25%) 0.74 Age (years) 61.20 (16.25) 57.74 (18.46) 0.009 55.26 (16.1) 54.98 (16.36) 0.89 SAPS II 48.85 (18.12) 49.89 (17.80) 0.45 54.6 (19.46) 59.97 (16.68) 0.079 SOFA 7.64 (3.79) 8.07 (3.63) 0.13 7.19 (4.34) 8.9 (4.04) 0.008 Admission category Medical 175 (55%) 218 (59%) 57 (81%) 117 (86%) Surgical 145 (45%) 151 (41%) 0.25 13 (19%) 19 (14%) 0.39 COPD 64 (20%) 61 (17%) 0.24 6 (10%) 21 (15%) 0.17 Diabetes mellitus 66 (21%) 69 (19%) 0.53 14 (20%) 26 (20%) 0.88 Immunocompromised patients 24 (8%) 31 (8%) 0.66 7 (10%) 23 (17%) 0.18
Chronic heart failure 27 (8%) 19 (5%) 0.085 16 (23%) 16 (12%) 0.037
Chronic respiratory failure 35 (11%) 27 (7%) 0.098 3 (4%) 7 (5%) 0.78
Cirrhosis 8 (2%) 23 (6%) 0.018 3 (4%) 10 (7%) 0.38
Previous antibiotic use 210 (66%) 232 (63%) 0.45 60 (86%) 107 (79%) 0.3 Appropriate initial antimicrobial therapy 174 (54%) 257 (70%) < 0.001 40 (57%) 55 (40%) 0.023
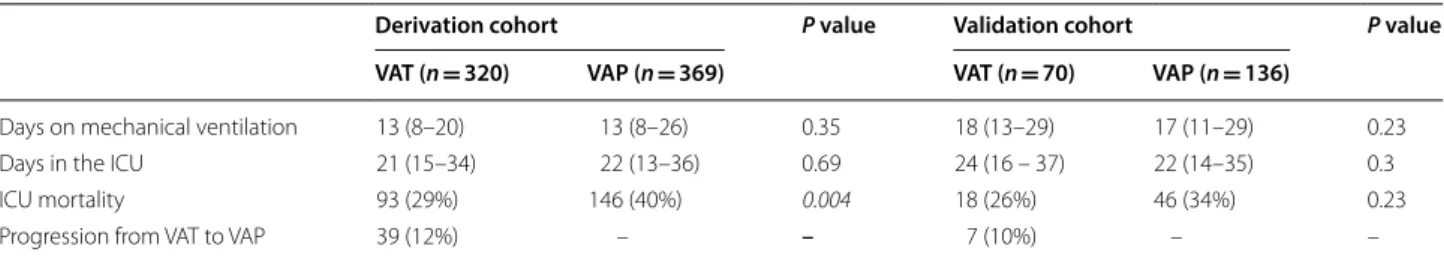
Clinical outcomes in the derivation and validation cohorts are shown in Table 2 and Additional file 3. ICU mortality was higher in patients with VAP compared to patients with VAT in the derivation cohort.
The analysis of microbiological findings revealed a higher frequency of Enterobacter spp. in patients with VAP compared to patients with VAT in the validation cohort. Conversely, Citrobacter freundii was found more frequently in VATs than in VAPs in the validation cohort (Table 3). Comparisons of microbiological findings between derivation and validation cohorts are shown in Additional file 4. CPIS values ranged from 0 to 10 for patients with VAT and from 0 to 11 for patients with VAP in the derivation cohort. In the validation cohort, CPIS values ranged from 2 to 10 for patients with VAT and from 1 to 10 for patients with VAP.
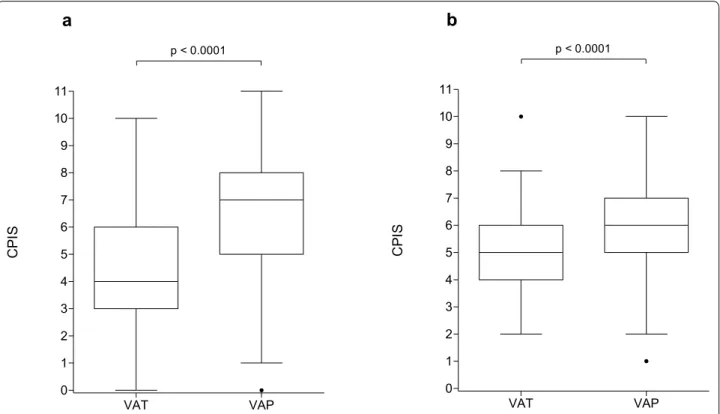
The distribution of CPIS values was significantly lower in patients with VAT than in those with VAP in the deri-vation cohort with median values of 4 (3–6) vs 7 (5–8) (p < 0.0001) as well as in the validation cohort (5 (4–6) vs 6 (5 –7) (p < 0.0001)) (Fig. 1).
ROC analysis showed AUCs at 0.76 (95% CI [0.72– 0.79]) in the derivation cohort and 0.67 (95% CI [0.6– 0.75]) in the validation cohort (Fig. 2).
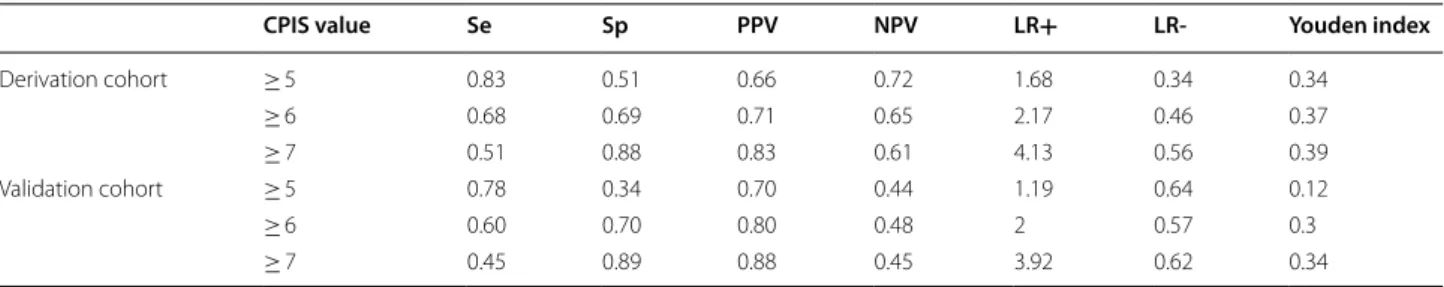
Performances of the CPIS for the diagnosis of VAP at different cut-offs are summarized in Table 4. A CPIS value ≥ 7 was associated with the highest Youden index in both cohorts. With this cut-off, sensitivity and speci-ficity were respectively found at 0.51 and 0.88 in the derivation cohort, and at 0.45 and 0.89 in the validation cohort. A CPIS value ≥ 7 was found in 225 patients of the validation cohort and amongst them, 187 were true VAPs (PPV = 0.83). In the derivation cohort, 69 patients had
Table 2 Clinical outcomes of patients
Data are presented as number (%) or median (interquartile range)
ICU Intensive Care Unit; VAP Ventilator-Associated Pneumonia; VAT Ventilator-Associated Tracheobronchitis p values < 0.05 are indicated in italics characters
Derivation cohort P value Validation cohort P value
VAT (n = 320) VAP (n = 369) VAT (n = 70) VAP (n = 136)
Days on mechanical ventilation 13 (8–20) 13 (8–26) 0.35 18 (13–29) 17 (11–29) 0.23
Days in the ICU 21 (15–34) 22 (13–36) 0.69 24 (16 – 37) 22 (14–35) 0.3
ICU mortality 93 (29%) 146 (40%) 0.004 18 (26%) 46 (34%) 0.23
Progression from VAT to VAP 39 (12%) – – 7 (10%) – –
Table 3 Microbiological findings
Data are presented as number (%) or mean (SD)
COPD Chronic obstructive pulmonary disease, MSSA Methicillin-sensitive Staphylococcus Aureus, MRSA Methicillin-resistant Staphylococcus Aureus, SAPS Simplified
acute physiology score, SOFA Sequential organ failure assessment, VAP Ventilator-associated pneumonia, VAT Ventilator-associated tracheobronchitis
p values < 0.05 are indicated in italic characters
Derivation cohort P value Validation cohort P value
VAT (n = 320) VAP (n = 369) VAT (n = 70) VAP (n = 136)
Streptococcus pneumoniae 16 (5%) 24 (7%) 0.41 2 (3%) 5 (4%) 1 Stenotrophomonas maltophila 19 (6%) 12 (3%) 0.09 4 (6%) 6 (4%) 0.74 MRSA 8 (2%) 8 (2%) 0.77 1 (1%) 1 (1%) 1 MSSA 66 (21%) 80 (22%) 0.73 6 (9%) 21 (15%) 0.17 Serratia marcescens 12 (4%) 16 (4%) 0.69 3 (4%) 5 (4%) 1 Pseudomonas aeruginosa 79 (25%) 89 (24%) 0.86 20 (29%) 29 (21%) 0.25 Proteus mirabilis 15 (5%) 14 (4%) 0.56 3 (4%) 5 (4%) 1 Klebsiella pneumoniae 48 (15%) 53 (14%) 0.81 9 (13%) 30 (22%) 0.11 Haemophilus influenzae 32 (10%) 25 (7%) 0.12 4 (6%) 6 (4%) 0.74 Escherichia coli 37 (12%) 40 (11%) 0.76 5 (7%) 9 (7%) 1 Enterobacter spp. 35 (11%) 46 (12%) 0.53 4 (6%) 21 (15%) 0.043 Citrobacter freundii 7 (2%) 6 (2%) 0.58 4 (6%) 1 (1%) 0.047 Acinetobacter baumannii 14 (4%) 27 (7%) 0.10 0 (0%) 2 (1%) 0.55
VAT VAP 0 1 2 3 4 5 6 7 8 9 10 11 p < 0.0001 CP IS VAT VAP 0 1 2 3 4 5 6 7 8 9 10 11 p < 0.0001 CP IS
a
b
Fig. 1 Values of CPIS in patients with VAT and VAP in the derivation (a) and validation (b) cohorts. Box plot shows the median (horizontal line)
and IQR (25th 75th percentile) (box). The whiskers show the lowest data within 1.5 IQR of the lower quartile and highest data within 1.5 IQR of the upper quartile. Data outside 1.5 IQR of the upper or lower quartiles are depicted with a dot. CPIS Clinical Pulmonary Infection Score; VAP Ventilator‑Associated Pneumonia; VAT Ventilator‑Associated Tracheobronchitis
0 50 100 0 50 100
1 - Specificity (%)
)
%(
ytivi
tis
ne
S
0 50 100 0 50 1001 - Specificity (%)
Se
ns
itiv
ity
(%
)
a bFig. 2 ROC curves of CPIS for the diagnosis of VAP amongst patients with VA LRTI in the derivation (a) and validation (b) cohorts. A sensitivity
analysis was performed for the accuracy of CPIS in diagnosing VAP amongst patients with VA LRTI and ROC curves were computerized in derivation and validation cohorts. CPIS Clinical pulmonary infection score, VAP Ventilator‑associated pneumonia, VAT Ventilator‑associated tracheobronchitis,
a CPIS value ≥ 7 and amongst them 61 were true VAPs (PPV = 0.83) (Fig. 3).
In the derivation cohort, inappropriate antimi-crobial therapy was associated with a longer dura-tion of mechanical ventiladura-tion in patients with a CPIS value ≥ 7, whilst no difference between groups was found in subjects with a CPIS value < 7 (Table 5 ). Com-parisons of clinical outcomes according to the appro-priateness of antimicrobial therapy in VAT and VAP in derivation and validation cohorts are shown in Addi-tional file 5.
Discussion
In this study, a CPIS value ≥ 7 appeared as the best cut-off according to the Youden index, with a high speci-ficity and a moderate sensitivity, with similar results in both derivation and validation cohorts.
As far as we know, this is the first study to explore the accuracy of CPIS for the diagnosis of VAP amongst patients with VA-LRTI. CPIS has been widely described as a helpful tool, with a moderate accuracy for the diag-nosis of VAP, a best cut-off value of 6 in most studies, and pooled estimates for sensitivity and specificity at 0.65 and 0.64, respectively [9].
The question of early identifying patients who will develop a diagnosis of VAP may be critical, as thera-peutic managements of VAT and VAP currently dif-fer. Indeed, current guidelines recommend that VAP
Table 4 Performances of CPIS for the diagnosis of VAP in patients with VA-LRTI
CPIS Clinical pulmonary infection score, Se Sensitivity, Sp Specificity, PPV Positive predictive value, NPV Negative predictive value, LR + Positive likelihood ratio, LR-
Negative likelihood ratio
CPIS value Se Sp PPV NPV LR+ LR- Youden index
Derivation cohort ≥ 5 0.83 0.51 0.66 0.72 1.68 0.34 0.34 ≥ 6 0.68 0.69 0.71 0.65 2.17 0.46 0.37 ≥ 7 0.51 0.88 0.83 0.61 4.13 0.56 0.39 Validation cohort ≥ 5 0.78 0.34 0.70 0.44 1.19 0.64 0.12 ≥ 6 0.60 0.70 0.80 0.48 2 0.57 0.3 ≥ 7 0.45 0.89 0.88 0.45 3.92 0.62 0.34 VAT VAP 0 1 2 3 4 5 6 7 8 9 10 11 CP IS VAT VAP 0 1 2 3 4 5 6 7 8 9 10 11 CP IS
a
b
Fig. 3 Scatter dot plots of CPIS in patients with VAT and VAP in the derivation (a) and validation (b) cohorts relatively to the 7‑point cut‑off. The CPIS
value is depicted as a single dot for each patient. Dash lines separate patients with a CPIS value ≥ 7 from those with a CPIS value < 7. CPIS Clinical pulmonary infection score, VAP Ventilator‑associated pneumonia, VAT Ventilator‑associated tracheobronchitis
should be treated with appropriate antimicrobial ther-apy, by contrast with VAT for which such a treatment remains not recommended [2, 10]. In that view, con-sidering a CPIS value ≥ 7 as a criterion for the early initiation of antimicrobial therapy may appear clini-cally relevant, as this cut-off was associated with good specificities and PPVs > 0.8 in both cohorts. Further-more, a CPIS value ≥ 7 was found in 187/369 (51%) and 61/136 (45%) patients with VAPs in our derivation and validation cohorts, respectively, suggesting that this threshold may allow an early diagnosis in almost half cases of VAP. Conversely, we may note the moderate to poor NPV of the CPIS to exclude the diagnosis of VAP. Accordingly, it appears that using the CPIS in subjects with clinical suspicion of VA-LRTI and positive micro-biological sampling should mostly be considered for the early initiation of antibiotics in patients with a CPIS value ≥ 7.
However, these considerations must be taken with cau-tion. First, because appropriate antimicrobial therapy in patients with CPIS ≥ 7 was poorly associated with favour-able outcomes in our cohorts, yet this result might be a consequence of the differences in characteristics between patients receiving appropriate and inappropriate antibi-otic treatments. Second, the question of initiating anti-biotic treatments in patients with VAT remains unclear. Indeed, a continuum between VAT and VAP cannot be ruled out, as a higher risk of pneumonia was reported in patients with VAT in the TAVeM study [1]. In addition, data from this cohort suggest that the risk of progression from VAT to VAP would be reduced in patients receiving antibiotic treatment. On the other hand, current French and international guidelines do not address the initiation of antibiotics in VAT, because of a lack of evidence sup-porting this strategy [2]. Thus, further investigations are
warranted to clarify whether patients with VAT should benefit or not from antimicrobial therapy.
One apparently surprising result of our study was the 25% rate of patients with CPIS values ≥ 6 in VATs. This might be explained by the fact that our study was restricted to patients with symptoms of lower respira-tory tract infections. This is likely to have resulted in overall greater CPIS values in our population than usu-ally reported, especiusu-ally in patients without VAP [9]. As a consequence, a more intense clinical presentation seems required to accurately segregate VAPs from VATs than to distinguish VAPs from patients without respiratory infections. This might partly explain the optimal cut-off found at 7 in our study, which is higher than the 6 points threshold usually reported in the literature [9].
In contrast, we report CPIS values found at 0 or 1 in several patients with VAPs and VATs in both cohorts. This result is actually reflecting the uncomplete clini-cal presentations initially observed in some patients. In these, the symptoms could initially include a mild increase of body temperature without reaching 38.5 °C, the appearance of few tracheal secretions, or a moder-ate worsening of the PaO2/FiO2 ratio without falling
below 240, thus motivating the respiratory microbio-logical sampling, although the CPIS was still calculated at 0 or 1 by then. However, all these patients eventually reached the criteria for VA-LRTI, with a worsening of their symptoms, thus completing their clinical presenta-tion. This frequent progression at the initial stage of VA-LRTI raises the question of whether the calculation of CPIS at a single time-point can give enough information to distinguish VAP from VAT. The evaluation of the rela-tionship between CPIS calculated at the time of clinical suspicion of VA-LRTI and variations of CPIS over 24 h before that time-point (Delta CPIS) in our derivation
Table 5 Comparisons of clinical outcomes according to the value of CPIS and appropriateness of antimicrobial therapy
Data are presented as number (%) or median (interquartile range)
ICU Intensive care unit; CPIS Clinical pulmonary infection score p values < 0.05 are indicated in italic characters
CPIS value Derivation cohort Validation cohort
Appropriate antimicrobial therapy (n = 431) Inappropriate antimicrobial therapy (n = 258) P value Appropriate antimicrobial therapy (n = 95) Inappropriate antimicrobial therapy (n = 111) P value Days on mechanical ventilation < 7 14 (8–26) 13 (8–24) 0.59 17.5 (11–32.5) 19 (12–28) 0.82 ≥ 7 14 (8–26) 18 (12–29.5) 0.03 16 (11–33) 17 (11–26.5) 0.72
Days in the ICU < 7 21 (13–31) 21.5 (14–36) 0.37 24 (14.5–36) 25 (14–36.5) 0.76
≥ 7 19 (13–32) 25 (15–40.5) 0.052 20 (13–30) 20 (15–41) 0.77
ICU mortality < 7 88 (33%) 65 (34%) 0.93 19 (30%) 23 (32%) 0.82
cohort brings some interesting insights about that ques-tion. This analysis reveals that nearly all patients with a CPIS value ≥ 7 also had a Delta CPIS ≥ 0 and that CPIS was subsequently correlated to Delta CPIS in VAT and in VAP (Additional file 6). Furthermore, Delta CPIS does not seem to show greater accuracy than CPIS to differ-entiate VAT from VAP (Additional file 7). These results convey the idea that subjects with greater CPIS are not only exhibiting marked features of respiratory infection, but are also worsening their symptoms, thus supporting the reliability of the CPIS measured at a single time-point to discriminate VATs from VAPs.
Other parameters than the CPIS might be proposed to improve the early diagnosis of VAP. VAP seemed to be associated with a higher mortality in ICU than VAT, yet this result was not statistically significant in the valida-tion cohort. This result suggests that a diagnosis of VAP might be associated with more severe organ failures, and especially with more severe levels of hypoxaemia. This hypothesis is supported by the results of the TAVeM study, showing that significantly more patients with VAP had an episode of worsening gas exchange than did those with VAT [1]. Therefore, severity scores like SOFA, cal-culated at the time of the clinical suspicion of VA-LRTI, could help to improve the early detection of VAP, par-ticularly through evaluation of the respiratory SOFA. A similar strategy has already been developed through the Infection Probability Score, although this score does not apply specifically to VAP but to nosocomial infections in general [11]. Furthermore, such a strategy has never been evaluated specifically for VA-LRTI.
Routine biomarkers like CRP and PCT have been evaluated for the identification of VAP, with variable diagnostic performances. Luyt et al. reported a poor accuracy of PCT for the diagnosis of VAP, with ROC AUCs respectively found at 0.51 and 0.62 for D-1 PCT and PCT increase. To be noted that adjunction of PCT did not significantly improve the accuracy of the CPIS for the diagnosis of VAP in this study, with an AUC ris-ing from 0.68 for CPIS alone to 0.69 for CPIS combined with PCT [12]. In another report, Charles et al. showed good performances of PCT variations for the diagnosis of nosocomial infections, with AUCs > 0.8 in ROC analysis and similar results for the diagnosis of VAP. In this work, PCT variations were above all associated with a good specificity and high PPVs [13]. On the other hand, Povoa et al. showed a moderate performance of CRP for the diagnosis of VAP, with AUCs > 0.7 for variations of CRP in their ROC analysis [14]. Furthermore, at the day of VAP diagnosis, they observed that a single measurement of CRP was useful in particular for the exclusion of VAP diagnosis. Beside these routine biomarkers, some authors have investigated the potential usefulness of sTREM-1,
yet with disappointing results showing very poor accu-racy for the diagnosis of VAP [15, 16].
These data underline the potential utility of these bio-markers in differentiating VAT from VAP. However, their moderate accuracy when taken as single parameter high-lights the hypothetical interest of a mixed evaluation integrating one or several of these variables in a CPIS-based score.
The distinction between VAT and VAP currently relies on the presence of at least one new infiltrate on the chest radiography. However, the relevance of this criterion remains questionable, given its low accuracy in diagnos-ing microbiologically confirmed VAP amongst critically ill subjects undergoing mechanical ventilation [3]. This inaccuracy mainly results from the difficulties to distin-guish infiltrates of infectious cause from other aetiolo-gies, like pleural effusions, cardiac overload or atelectasis, which are frequently present in ICU patients [4]. In that view, lung ultrasound has been proposed as a promising tool for the diagnosis of VAP, and could thus be consid-ered to distinguish VAT from VAP, yet its utility remains limited because of its poor inter-operator reproducibility [17]. Computed tomography (CT) could also be proposed to enhance the detection of lung infiltrates. Indeed, Self et al. reported that only 43.5% of the patients presenting to ED with opacities on CT had images of pneumonia detected on chest radiography [18]. Therefore, CT could allow a better differentiation between VAT and VAP. However, its greater cost, associated with the necessity to transport patients, and higher exposure to radiations limit its use in routine clinical practice. All these tools could improve the accuracy of the CPIS and should prob-ably be assessed in a future updated version of this score.
Our study has several limitations. First, this was a retrospective analysis, thus limiting the parameters that could be studied in our cohorts. Above all, study-ing the accuracy of inflammation biomarkers like CRP or PCT would have been interesting, but could not be performed because these parameters were not meas-ured in a sufficient number of patients in our validation cohort. Second, this study was performed in patients with microbiologically confirmed VA-LRTI, limiting the applicability of our results at the patient’s bedside, because of the frequent delay between processing of the microbiological sampling and culture positivity. Third, evaluating the CPIS to distinguish VAT from VAP might appear questionable in our study, as the radio-graphic criterion is part of the items required for the calculation of this score. Nevertheless, it must be noted that the CPIS was calculated once for all at the time of microbiological sampling in the respiratory tract, which corresponded to the moment of the clinical suspicion of VA-LRTI. This is to oppose the methods
used to retrospectively classify patients between VAT and VAP, with all the biological, clinical and radiologi-cal data available to make a final diagnosis. This last point must be considered regarding the frequency of uncomplete initial presentation with initial absence of radiographic signs, representing more than 60% of VAP in the study performed by Ramirez et al. [5]. Fourth, the population of our study included a lower percent-age of surgical admissions in the validation cohort than in the derivation cohort. This might have interfered with our results, as a poor accuracy of CPIS has been reported in surgical patients, because non-infectious causes of lung injury may represent a confounder in this population [19, 20]. Fifth, the rates of appropriate initial antibiotic treatments were significantly different between VAPs and VATs in both cohorts. Accordingly, we could not draw any conclusion regarding the benefit of appropriate antimicrobial therapy in patients with a CPIS value ≥ 7. Sixth, ROC analysis showed a lower AUC of CPIS in our validation cohort, thus under-lining a weaker overall accuracy in this population. Finally, lung infiltrates were probably missed in some patients with VAP, given the reported lack of sensitiv-ity of chest radiography for the detection of pneumonia [3, 4]. However, the use of chest radiography allowed us to diagnose VAT and VAP using the same criteria than in the TAVeM study. Accordingly, our definitions of VAP and VAT are consistent with those in which a difference in mortality rates was reported [1]. Further explorations in a larger prospective multicentre study are needed to confirm our findings.
Conclusions
In patients with evidence of VA-LRTI, a CPIS value ≥ 7 allowed the early diagnosis of half cases of VAP with specificity and PPV above 80% in our derivation and validation cohorts. The CPIS might thus be considered as a helpful tool to drive the early initiation of antimi-crobial therapy in patients with VA-LRTI.
Supplementary information
Supplementary information accompanies this paper at https ://doi.
org/10.1186/s1361 3‑020‑00721 ‑4.
Additional file 1: Description of the clinical pulmonary infection score.
Additional file 2: Comparison of baseline characteristics in derivation and
validation cohorts.
Additional file 3: Comparison of clinical outcomes in derivation and
validation cohorts.
Additional file 4: Comparison of microbiological findings in derivation
and validation cohorts.
Additional file 5: Comparison of clinical outcomes according to the
appropriateness of antimicrobial therapy in VAT and VAP in derivation and validation cohorts.
Additional file 6: Relationship between Delta CPIS and CPIS at the time of
microbiological sampling in patients with VAT and VAP, respectively, in the derivation cohort. a Dot plots of Delta CPIS and CPIS value at the time of microbiological sampling. b Scatter plots of Delta CPIS vs CPIS at the time of microbiological sampling. Spearman’s correlation tests were performed for VATs (rs = 0.42 (95% CI 0.32 –0.51), p < 10−3) and VAPs (rs = 0.39 (95% CI 0.3–0.48), p < 10−3). Delta CPIS was calculated as the difference between CPIS value 24 h before microbiological sampling and CPIS value at the time of microbiological sampling. Data for calculation of Delta CPIS were not available in the validation cohort. CPIS Clinical pulmonary infection score, VAP Ventilator‑associated pneumonia, VAT Ventilator‑associated tracheobronchitis.
Additional file 7: Performances of Delta CPIS for the diagnosis of VAP in
patients with VA LRTI in the derivation cohort.
Abbreviations
AUC : Area under the curve; CPIS: Clinical pulmonary infection score; CT: Computed tomography; ICU: Intensive care unit; NPV: Negative predictive value; PPV: Positive predictive value; ROC: Receiver operating characteristics; VA‑LRTI: Ventilator‑associated lower respiratory tract infections; VAP: Ventilator‑ associated pneumonia; VAT: Ventilator‑associated tracheobronchitis.
Acknowledgements
None.
Authors’ contributions
AG, IM‑L, PP, AR, JS and SN contributed to acquisition of data for the work. AG, AD and SN contributed to analysis of data for the work. AG and SN contrib‑ uted to interpretation of data for the work. All authors have revised this work critically for important data, given their final approval of the version to be published and agree to be accountable for all aspects of the work in ensuring that questions related to the accuracy or integrity of any part of the work are appropriately investigated and resolved. All authors read and approved the final manuscript.
The TAVeM study group included the following contributors:Ignacio Martín‑ Loeches, Alejandro Rodriguez, Daniel Curcio, Rubén Oscar Fernández, Jorge Arroyo, Maria Gabriela, Rodriguez Alvarez, Alex Tamayo Reyes, Christian Del‑ lera, Francisco Molina, Daniel Molano Franco, Edwin Giovanny Chapeta Parada, Estuardo Salgado Yepez, Fernando Paredes Oña, Diego Morocho Tutillo, Diego Barahona, Francisco Alvarez Lerma, Ana Abella Álvarez, Jose Manuel Allegue Gallego, Francisco José Fuentes Morillas, Antonio Luis Ruiz Aguilar, María Lourdes Cordero Lorenzana, Rafael Sanchez Iniesta, Jordi Almirall, Antonio Albaya, Sergio Ruiz Santana, Carmen Fernandez, Miguel Angel Blasco Naval Potro, Pablo Vidal Cortes, Belen Jimenez, Rafael Sierra, Maria Del Valle Ortiz, Nieves Cruza, Pedro Maria Olaechea, Ana Carolina Caballero Zirena, Pilar Posada Gonzalez, Teresa Recio Gomez, Lorenzo Socias Crespi, Paula Ramírez Galleymore, Ricard Jordà Marcos, César Palazón, Bernardo Gil Rueda, Juan Carlos Ballesteros, Maria Pilar Gracia Arnilla, Antonia Socias, Joaquin Amador, Esperanza Molero Silvero, Laura Macaya Redín, Mónica Zamora Elson, Luis Cabré Pericas, Joaquín Álvarez Rodríguez, Mercedes Nieto, Antoni Torres, Elena Molinos, Ana Josefina, Nuno Catorze, Pedro Póvoa, Carlos Candeias, Luis Coelho, Paulo André, José Andrade Gomes, Elisa Vedes, Antero Fernandes, Miguel Ángel García, Catalina Sanchez Ramirez, Milagros Calizaya, Angel Estella, Adrià Albis, Gerardo Aguilar, Eva Torrents, Marta Gurpegui Puente, Angel Gabriel Sanchez, Thiago Lisboa, Pedro Azambuja, Marcos Freitas Knibel, Otavio Ranzani, Laura Darriba W. Camargo, Antonio Paulo Nassar Junior, Cesar Biselli Ferreira, Suzana Lobo, Ligia Rabello, Marcelo Park, Alexandre Guilherme Ribeiro de Carvalho, Mauricio Valencia, Alejandro Gonzalez Castro, Adoración Alcalá López, José María Castillo Caballero, Saad Nseir, Karim Jaffal, Erika Parmentier‑Decrucq, Sébastien Préau, Chloé Rousselin, Caroline Blazejewski, Juliette Masse, Laurent Robriquet, Léa Satre‑Buisson, Jean‑Paul Mira, Nathalie Martin, Raphael Lepecq, Hervé Mentec, Christophe Girault, Antoine Marchalot, Jonathan Messika, Jean‑Damien Ricard, Philppe Seguin, Bruno Mégarbane, Sandrine Valade, Elie Azoulay, Nicolas Boussekey, Olivier Leroy, Jean Reignier, Marc Clavel, Nicolas Pichon, Thomas Baudry, Laurent Argaud, Pascal Beuret,
Ali Ait‑Hssain, Martine Nyunga, Isabelle Alves, Florent Dewavrin, Guillaume Brunin, Stéphane Mérat, Pierre Pasquier, Frédéric Brun, Aurore Palud, Benoit Voisin, Romaric Grenot, Nicolas Van Grunderbeeck, Didier Thévenin, Benoit Misset, François Philippart, Jean‑Pierre Frat, Rémi Coudroy, Philippe Cabaret, Marie Ledein, Fethi Zoheir Hadj Slimane, Romain Miguel‑Montanes, Nicolas Weiss, Francis Bolgert, Bernard Just.
Funding
None.
Availability of data and materials
The datasets used and analyzed during the current study are available from the corresponding author on reasonable request.
Ethics approval and consent to participate
Centers participating to the TAVeM study either received ethics approval from their institutions or ethics approval was waived (institutional review board number 2013515).
Consent for publication
Not applicable.
Competing interests
SN reports personal fees from MSD, Pfizer, Gilead, Bio Rad, and Biomerieux, outside the submitted work; other authors have no competing interest to disclose. The authors declare that they have no competing interests.
Author details
1 Department of Intensive Care Medicine, Critical Care Centre, CHU Lille, Lille 59000, France. 2 Univ. Lille, CNRS, Inserm, CHU Lille, Institut Pasteur de Lille, U1019‑UMR9017‑CIIL‑Centre d’Infection et d’Immunité de Lille, Lille, France. 3 Department of Intensive Care Medicine, Multidisciplinary Intensive Care Research Organization (MICRO), St. James’s Hospital, St James Street, Dublin 8, Dublin, Ireland. 4 Hospital Clinic, IDIBAPS, Universidad de Barcelona, Ciberes, Barcelona, Spain. 5 Polyvalent Intensive Care Unit, São Francisco Xavier Hospi‑ tal, Centro Hospitalar de Lisboa Ocidental, Lisbon, Portugal. 6 NOVA Medical School, New University of Lisbon, Lisbon, Portugal. 7 Hospital Universitari Joan XXIII, Critical Care Medicine, Rovira & Virgili University, Rovira, Tarragona, Spain. 8 Centro de Investigación Biomédica en Red de Enfermedades Respiratorias, Instituto de Salud Carlos III, Bunyola, Mallorca, Spain. 9 Department of Criti‑ cal Care and Graduate Program in Translational Medicine, Programa de Pós‑Graduação em Clínica Médica, D’Or Institute for Research and Education, Rio de Janeiro, Brazil. 10 Univ. Lille, CHU Lille, ULR 2694 METRICS‑ Evaluation des technologies de santé et des pratiques médicales, 59000 Lille, France. 11 CHU Lille, Unité de Méthodologie, Biostatistiques et Data Management, Lille 59000, France. 12 Université de Lille, INSERM U995, Lille Inflammation Research Inter‑ national Center E2, Lille 59000, France.
Received: 21 May 2020 Accepted: 20 July 2020
References
1. Martin‑Loeches I, Povoa P, Rodríguez A, Curcio D, Suarez D, Mira J‑P, et al. Incidence and prognosis of ventilator‑associated tracheobronchitis (TAVeM): a multicentre, prospective, observational study. Lancet Respir Med. 2015;3:859–68.
2. Torres A, Niederman MS, Chastre J, Ewig S, Fernandez‑Vandellos P, Han‑ berger H, et al. International ERS/ESICM/ESCMID/ALAT guidelines for the management of hospital‑acquired pneumonia and ventilator‑associated pneumonia: Guidelines for the management of hospital‑acquired pneu‑ monia (HAP)/ventilator‑associated pneumonia (VAP) of the European Respiratory Society (ERS), European Society of Intensive Care Medicine (ESICM), European Society of Clinical Microbiology and Infectious Diseases (ESCMID) and Asociación Latinoamericana del Tórax (ALAT). Eur Respir J. 2017;50.
3. Butler KL, Sinclair KE, Henderson VJ, McKinney G, Mesidor DA, Katon‑ Benitez I, et al. The chest radiograph in critically ill surgical patients is
inaccurate in predicting ventilator‑associated pneumonia. Am Surg. 1999;65:805–9 discussion 809-810.
4. Graat ME, Choi G, Wolthuis EK, Korevaar JC, Spronk PE, Stoker J, et al. The clinical value of daily routine chest radiographs in a mixed medical‑ surgical intensive care unit is low. Crit Care Lond Engl. 2006;10:R11. 5. Ramirez P, Lopez‑Ferraz C, Gordon M, Gimeno A, Villarreal E, Ruiz J, et al.
From starting mechanical ventilation to ventilator‑associated pneumo‑ nia, choosing the right moment to start antibiotic treatment. Crit Care. 2016;20:169.
6. Pugin J, Auckenthaler R, Mili N, Janssens JP, Lew PD, Suter PM. Diagnosis of ventilator‑associated pneumonia by bacteriologic analysis of broncho‑ scopic and nonbronchoscopic “blind” bronchoalveolar lavage fluid. Am Rev Respir Dis. 1991;143:1121–9.
7. Luna CM, Blanzaco D, Niederman MS, Matarucco W, Baredes NC, Desmery P, et al. Resolution of ventilator‑associated pneumonia: prospective evaluation of the clinical pulmonary infection score as an early clinical predictor of outcome. Crit Care Med. 2003;31:676–82.
8. Singh N, Rogers P, Atwood CW, Wagener MM, Yu VL. Short‑course empiric antibiotic therapy for patients with pulmonary infiltrates in the intensive care unit. A proposed solution for indiscriminate antibiotic prescription. Am J Respir Crit Care Med. 2000;162:505–11.
9. Shan J, Chen H‑L, Zhu J‑H. Diagnostic accuracy of clinical pulmonary infection score for ventilator‑associated pneumonia: a meta‑analysis. Respir Care. 2011;56:1087–94.
10. Kalil AC, Metersky ML, Klompas M, Muscedere J, Sweeney DA, Palmer LB, et al. Management of Adults With Hospital‑acquired and Ventilator‑ associated Pneumonia: 2016 Clinical Practice Guidelines by the Infectious Diseases Society of America and the American Thoracic Society. Clin Infect Dis Off Publ Infect Dis Soc Am. 2016;63:e61–111.
11. Peres Bota D, Mélot C, Lopes Ferreira F, Vincent J‑L. Infection Probability Score (IPS): a method to help assess the probability of infection in criti‑ cally ill patients. Crit Care Med. 2003;31:2579–84.
12. Luyt C‑E, Combes A, Reynaud C, Hekimian G, Nieszkowska A, Tonnellier M, et al. Usefulness of procalcitonin for the diagnosis of ventilator‑associated pneumonia. Intensive Care Med. 2008;34:1434–40.
13. Charles PE, Kus E, Aho S, Prin S, Doise J‑M, Olsson N‑O, et al. Serum procal‑ citonin for the early recognition of nosocomial infection in the critically ill patients: a preliminary report. BMC Infect Dis. 2009;9:49.
14. Póvoa P, Martin‑Loeches I, Ramirez P, Bos LD, Esperatti M, Silvestre J, et al. Biomarker kinetics in the prediction of VAP diagnosis: results from the BioVAP study. Ann Intensive Care. 2016;6:32.
15. Palazzo SJ, Simpson TA, Simmons JM, Schnapp LM. Soluble triggering receptor expressed on myeloid cells‑1 (sTREM‑1) as a diagnostic marker of ventilator‑associated pneumonia. Respir Care. 2012;57:2052–8. 16. Oudhuis GJ, Beuving J, Bergmans D, Stobberingh EE, ten Velde G, Linssen
CF, et al. Soluble triggering receptor expressed on myeloid cells‑1 in bronchoalveolar lavage fluid is not predictive for ventilator‑associated pneumonia. Intensive Care Med. 2009;35:1265–70.
17. Bouhemad B, Dransart‑Rayé O, Mojoli F, Mongodi S. Lung ultrasound for diagnosis and monitoring of ventilator‑associated pneumonia. Ann Transl Med. 2018;6:418.
18. Self WH, Courtney DM, McNaughton CD, Wunderink RG, Kline JA. High discordance of chest x‑ray and computed tomography for detection of pulmonary opacities in ED patients: implications for diagnosing pneumo‑ nia. Am J Emerg Med. 2013;31:401–5.
19. Croce MA, Swanson JM, Magnotti LJ, Claridge JA, Weinberg JA, Wood GC, et al. The futility of the clinical pulmonary infection score in trauma patients. J Trauma. 2006;60:523–7 discussion 527-528.
20. Pieracci FM, Rodil M, Haenel J, Stovall RT, Johnson JL, Burlew CC, et al. Screening for ventilator‑associated pneumonia in the surgical intensive care unit: a single‑institution analysis of 1,013 lower respiratory tract cultures. Surg Infect. 2015;16:368–74.
Publisher’s Note
Springer Nature remains neutral with regard to jurisdictional claims in pub‑ lished maps and institutional affiliations.