SWARD STRUCTURE AND NUTRITIVE VALUE OF UROCHLOA RUZIZIENSIS UNDER NITROGEN AND POTASSIUM FERTILISATION
Texto
Imagem


Documentos relacionados
Recebido em 19 de setembro de 2016; recebido para revisão em 21 de fevereiro de 2017; aceito em 28 de março de 2017; disponível on-line em 19 de abril de 2017. PALAVRAS CHAVE:
Este trabalho apresentou um Sistema de Dissemina¸c˜ao como uma proposta para modifica¸c˜ao da aplica¸c˜ao BitTorrent em MANETs para melhoria do desempenho diante da
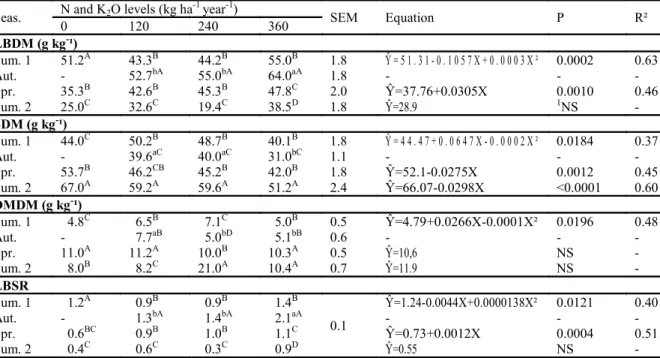
These results are due to the fact that, at the sites of the same signal grass sward with overgrazing, low forage mass was observed, including leaf blade and green stems (Table
The forage mass, sward structure, the ingestive and grazing behavior and forage intake by goats grazing on Tanzania-grass at 22 and 37 days of regrowth were evaluated.. A
Nitrogen-fertilized Tifton 85 pastures increase the quantity of forage biomass and volume density of forage with significant effect on stocking rate and weight gain when used
The total forage mass consumed and the ingestion rate presented a cubic function in relation to the sward height, with higher values for the height of 50 cm (Figure 3), when
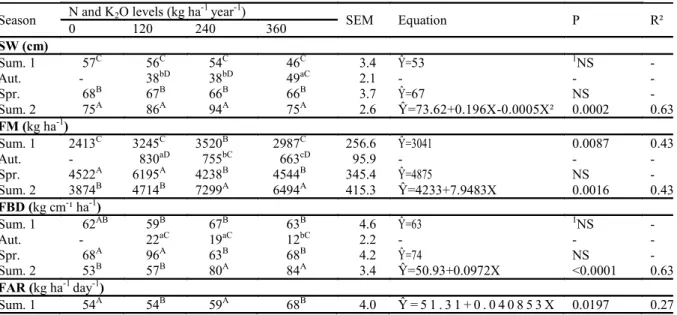
Changes caused by different N levels on tiller density, mass of leaves and stems, leaf:stem ratio, density of dead material in the 10-20 cm strata and the ratio between leaf and
Box plots of the Normalized Difference Vegetation Index (NDVI) and Forage Accumulation Rate (FAR) distribution observed under conditions of moderate forage supply in the four
