Quantitative assessment oF soil PhysiCal Quality in
northern China Based on s-theory
dejun yang(1)*, Zhengfu Bian(1), Kefeng Zhang(2), Jibing Xiong(1) and shaogang lei(1)
(1) China University of Mining and Technology, School of Environment Science and Spatial Informatics, Xuzhou, China. (2) Zhejiang University, Ningbo Institute of Technology, Ningbo, China.
* Corresponding author.
E-mail: dejunyang@cumt.edu.cn
aBstraCt
Quantitative assessment of soil physical quality is of great importance for eco-environmental pollution and soil quality studies. in this paper, based on the S-theory, data from 16 collection sites in the haihe river Basin in northern China were used, and the effects of soil particle size distribution and bulk density on three important indices of the S-theory were investigated on a regional scale. the relationships between unsaturated hydraulic conductivity Ki at the inflection point and S values (S/hi) were also studied using
two different types of fitting equations. The results showed that the polynomial equation
was better than the linear equation for describing the relationships between -log Ki and -log S, and -log Ki and -log (S/hi)2; and clay content was the most important factor affecting the soil physical quality index (S). the variation in the S index according to soil clay content
was able to be fitted using a double-linear-line approach, with decrease in the S index being
much faster for clay content less than 20 %. in contrast, the bulk density index was found to be less important than clay content. the average S index was 0.077, indicating that soil physical quality in the haihe river Basin was good.
Keywords: friability, hard-setting, S index, soil water retention curve.
resumo: AvAliAção QuAntitAtivA dA QuAlidAde FísicA do solo no norte dA chinA, com BAse nA teoriA s
A avaliação quantitativa da qualidade física do solo é de grande importância para a poluição ambiental e qualidade do solo. neste trabalho, com base na teoria s, dados de 16 locais da bacia do rio haihe, china, foram usados para investigar os efeitos do teor de argila e da densidade do solo em
introduCtion
The Haihe River Basin is a very important industrial center for China, and produces about 10 % of the country’s total grain output. People living in this basin account for 10 % of the total Chinese population (Weng et al., 2010). Climate change and human activities cause severe eco-environmental problems, such as soil erosion, land degradation, decreased streamflow capacity, subsidence of the land surface, degradation of lakes and wetlands, and a fall in groundwater tables (Bao et al., 2012; Xing et al., 2014). Soil physical quality, which is of great importance for eco-environmental pollution and soil quality assessment, has not been assessed comprehensively and systematically in this region.
Soil quality is usually considered to consist of three components: soil physical quality, soil chemical quality, and soil biological quality (Dexter, 2004a). Soil physical quality has big effects on soil chemical and biological processes and, therefore, it plays a central role in the study of soil quality (Dexter, 2004b) and forms an integral part of all considerations of total soil quality (Dexter, 2004a).
Although numerous studies on soil quality have been conducted by scientists in many research areas, the three components controlling soil quality have usually been examined individually (Dexter and Bird, 2001; Reynolds et al., 2002, 2009; Dexter, 2004a,b,c,d; Dexter and Birkas, 2004; Dexter et al., 2007; Dexter and Czyż, 2007; Dexter and Richard, 2009; Asgarzadeh et al., 2011). Many parameters and index have been proposed and used in assessing soil physical quality, such as air capacity, plant-available water capacity, relative field capacity, macroporosity, bulk density, organic carbon content, the structural stability index, total soil porosity, porosity of the soil matrix domain, air capacity of the soil matrix, field capacity, and permanent wilting point (Reynolds et al., 2002, 2009). However, the soil physical status for soils of different texture are not comparable by these parameters and index.
The s-theory, first proposed by Dexter (2004b), can be used to predict a range of soil physical properties (Dexter, 2004b,c,d), and the s index is
the core index of this theory. The theory shows how soil texture, bulk density, and organic matter content affect s, and how root ability in soil fits qualitatively with a given value of s (Dexter, 2004c). The effects of soil friability, soil break-up by tillage, and hard-setting on s were also explained (Dexter, 2004d). Further, it was illustrated that unsaturated hydraulic conductivity at the inflection point is positively correlated with s (Dexter, 2004d). Three indices, s, F (index for friability), and h (index for hardsetting) were introduced by Dexter (2004b,c,d), and s = 0.035 was defined as the boundary between good and poor soil physical conditions.
The s-theory offers a feasible and accurate method for quantifying and assessing soil physical quality; it is widely used in the areas of soil science and soil physics. Based on the soil water retention curve, methods were proposed for predicting the optimum content and the range of soil water content for tillage (Dexter and Bird, 2001). As the growth of plant roots ceased at about s = 0.02, this led to the assumption that s may be related to penetration resistance, and 1/s was used as a measure of the degree of soil compaction. A method for prediction of soil penetration resistance was put forward, and the usage of 1/s made it applicable to soils of different textures at different bulk densities (Dexter et al., 2007). The amount clods producedat optimum water content was shown to be linearly and negatively correlated with the s index (Dexter and Birkas, 2004). The s index expressed with h as an independent variable significantly increased the relevance of the analysis (Santos et al., 2011), compared to the range of the s index as it was originally proposed by Dexter (Dexter, 2004b). S-theory was also adopted to study soil tillage in relation to bi-modal pore size distributions (Dexter and Richard, 2009) and the integral energy of conventional available water, least limiting water range, and integral water capacity (Asgarzadeh et al., 2011). s-theory was also able to be used to identify areas of land where physical degradation or amelioration were taking place, and to evaluate management practices that would provide for sustainable land use (Dexter and Czyż, 2007). Moreover, values of s were able to be used to obtain quantitative estimates of saturated and unsaturated
três importantes índices da teoria s em escala regional. As relações entre a condutividade hidráulica
não saturada Ki no ponto de inflexão e o valor de S (S/hi) foram também estudados, usando dois tipos
diferentes de equações. os resultados evidenciaram que a equação polinomial foi melhor que a linear para
descrever as relações entre -log Ki e -log S; e -log Ki e -log (S/hi)2, e o teor de argila foi mais importante
em influenciar o índice de qualidade do solo (S). A variação do índice S com base no teor de argila foi
adequado para ajuste usando uma linha linear dupla, com o decréscimo no índice s muito mais rápido para teor de argila menor que 20 %. A densidade do solo, entretanto, foi o índice de menor importância comparativamente ao teor de argila. o índice s médio foi 0,077, indicando que a qualidade física do solo da bacia do rio haihe estava boa.
hydraulic conductivity, the optimum water content for tillage, soil friability, the degree of soil break-up during tillage, penetration resistance, the ability of the soil to store plant-available water, root growth, and soil stability (Dexter and Czyż, 2007).
Previous studies have reported the effects of texture, bulk density, and organic matter content on the s value; the relationships between soil friability and hard-setting of soil and s; and the positive correlation between unsaturated hydraulic conductivity at the inflection point and s (Dexter 2004b,c,d). However, the data on a farm scale used in previous studies makes the s-theory seem site-dependent. van lier (2014) revisited the S-index for soil physical quality and its use in Brazil. He found that as an absolute indicator, the value of s alone has proved to be incapable of predicting of soil physical quality, while as a relative indicator, it has no additional value over bulk density or total porosity (Van Lier, 2014). And more, whether s-theory can be validated by data on a regional scale is in doubt. How the index of soil physical quality for the s-theory is affected by soil bulk density and particle size distribution on a regional scale is still unknown.
The objectives of this paper were therefore to quantitatively assess soil physical quality from data collected in the Haihe River Basin, investigate the effects of soil particle size distribution and bulk density on the indices of s-theory, and establish the relationships between the unsaturated hydraulic conductivity at the inflection point and s (s/hi) on a regional scale in northern China.
material and methods
the region under study and data collection
The Haihe River Basin (35° to 43° N; 112° to 120° E) is located in northern China and it has two major rivers: the Haihe River and the Luanhe River (including their tributaries). The area of the basin is about 318,800 km2, of which 189,000 km2 is mountainous and the rest is a flood plain, with a range in elevation from 0 to 3,059 m. It includes Beijing, Tianjin, and more than 20 large and medium-size cities in Hebei, Shandong, Shanxi, and Henan provinces. The Haihe River Basin is characterized by a semi-humid climate in the monsoon region of the East Asia Warm Temperate Zone. Annual mean temperature is 9.6 oC and average annual pluvial precipitation is 530.3 mm (1951-2007), with approximately 75-85 % of rainfall occurring from June to September (Weng et al., 2010; Bao et al., 2012; Xu et al., 2014).
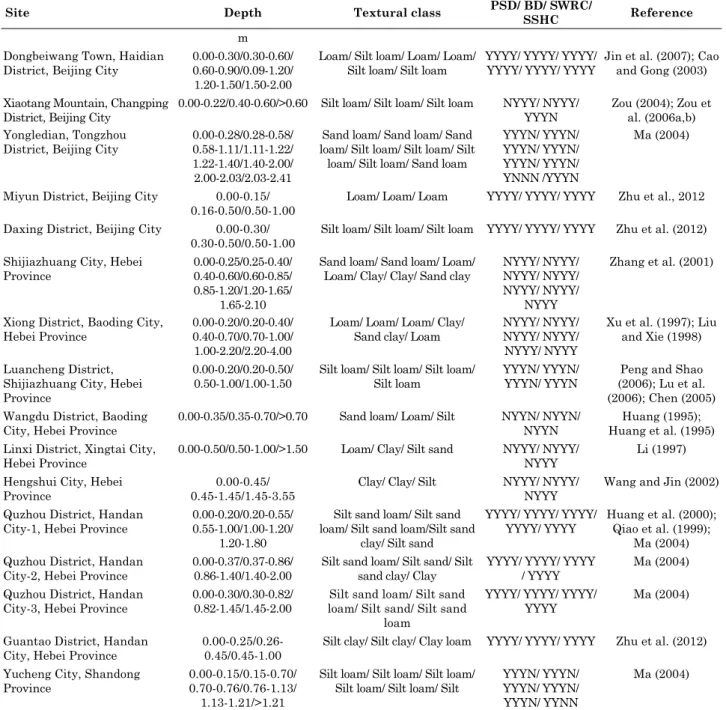
Numerous investigations on soil physical and hydraulic properties have been carried out in this region, and the data used in this study were from
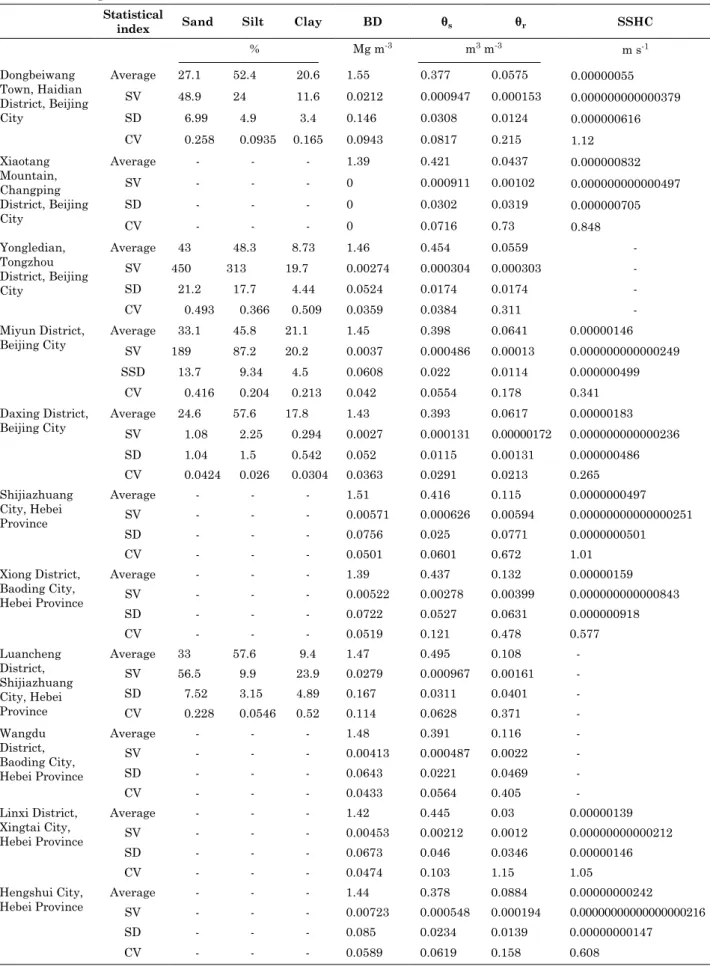
previous studies (Huang, 1995; Huang et al., 1995, 2000; Li, 1997; Xu et al., 1997; Liu and Xie, 1998; Qiao et al., 1999; Zhang et al., 2001; Wang and Jin, 2002; Cao and Gong, 2003; Ma, 2004; Zou, 2004; Chen, 2005; Lu et al., 2006; Peng and Shao, 2006; Zou et al., 2006a,b; Jin et al., 2007; Zhu et al., 2012). The collected data for the soil water retention curve and soil physical parameters are listed in table 1. Part of the data for particle size distribution and soil saturated hydraulic conductivity are not available. It is clear that most of the soil in this region is loam type. In previous studies (Huang, 1995; Huang et al., 1995, 2000; Li, 1997; Xu et al., 1997; Liu and Xie, 1998; Qiao et al., 1999; Zhang et al., 2001; Wang and Jin, 2002; Cao and Gong, 2003; Ma, 2004; Zou, 2004; Chen, 2005; Lu et al., 2006; Peng and Shao, 2006; Zou et al., 2006a,b; Jin et al., 2007; Zhu et al., 2012), soil saturated hydraulic conductivity was obtained by the constant head method or the horizontal soil column method, and the parameters describing the soil water retention curve were obtained by fitting the data of soil water content against the soil pressure head based on different curve fitting methods. Both soil saturated hydraulic conductivity and the parameters of the soil water retention curve were able to be obtained by pedotransfer functions based on soil physical properties, which have proven to be a good predictor for missing soil hydraulic characteristics (Wösten et al., 2001). The descriptive statistical index for the data collected from 16 sites in the Haihe River Basin are in table 2. In this paper, it is reasonable to assume that the parameters obtained from the methods mentioned above are comparable on a regional scale in this study.
theory
s-theory is based on the van Genuchten equation (van Genuchten, 1980) for the soil water retention curve. The van Genuchten equation is expressed as:
θ= θ −θ + α − +θ
( sat res)[ ( ) ]
n m res
h
1 Eq. 1
K Ks m m
( )θ = Θ0 5.[ −( −Θ1/ ) ]2
1 1 Eq. 2
where Θ is the relative degree of saturation; h (m) is the soil water potential; θsatand θres (kg kg-1) are the saturated and residual soil gravimetric water content, respectively; α (m-1), m and n are the shape parameters of the retention and conductivity functions, m = 1 - 1/n; and Ks (m s-1) is the soil saturated hydraulic conductivity.
The van Genuchten equation can be plotted as the curve of θ against log h, and the inflection point of the curve is defined as:
d
d h
mn nh h h m nh
sat res
n n n m n n n
2
2
11 1 1
θ
θ θ α α α
ln ( ) { [ ( ) ] ( )
= − − − + −−+ − − −−1[1+(αh) ]n−m−2}h=0
h m
i
n
=1 1
1
α[ ] Eq. 4
θi θsat θres m θ res
m
=( − )[1+ 1]− + Eq. 5
where hi (m) and θi(kg kg-1) are the modulus of soil water potential and soil water content at the inflection point, respectively.
The slope si at the inflection point, also called the s index, can be calculated using the following equation:
S n
m
i sat res
m)
= − − + − +
(θ θ )[ ]1 1 (1
Eq. 6 The soil physical parameter, si, was defined as the index for soil physical quality by Dexter in his series of papers (Dexter, 2004b,c,d), which was shown to be comparable among soils of different textures. The descriptive categories of soil physical quality in terms of the corresponding value of si were proposed as follows: si≥0.050 very good, 0.050>si≥0.035 good, 0.035>si≥0.020 poor, 0.02>si very poor (Dexter 2004d; Dexter and Czyż, 2007; table 1. data collected in the haihe river Basin in northern China
site depth textural class Psd/ Bd/ sWrC/
sshC reference
m Dongbeiwang Town, Haidian
District, Beijing City
0.00-0.30/0.30-0.60/ 0.60-0.90/0.09-1.20/ 1.20-1.50/1.50-2.00
loam/ Silt loam/ loam/ loam/ Silt loam/ Silt loam
YYYY/ YYYY/ YYYY/ YYYY/ YYYY/ YYYY
Jin et al. (2007); Cao and Gong (2003)
Xiaotang Mountain, Changping District, Beijing City
0.00-0.22/0.40-0.60/>0.60 Silt loam/ Silt loam/ Silt loam NYYY/ NYYY/ YYYN
Zou (2004); Zou et al. (2006a,b) Yongledian, Tongzhou
District, Beijing City
0.00-0.28/0.28-0.58/ 0.58-1.11/1.11-1.22/ 1.22-1.40/1.40-2.00/ 2.00-2.03/2.03-2.41
Sand loam/ Sand loam/ Sand loam/ Silt loam/ Silt loam/ Silt
loam/ Silt loam/ Sand loam
YYYN/ YYYN/ YYYN/ YYYN/ YYYN/ YYYN/ YNNN /YYYN
Ma (2004)
Miyun District, Beijing City 0.00-0.15/ 0.16-0.50/0.50-1.00
loam/ loam/ loam YYYY/ YYYY/ YYYY Zhu et al., 2012
Daxing District, Beijing City 0.00-0.30/ 0.30-0.50/0.50-1.00
Silt loam/ Silt loam/ Silt loam YYYY/ YYYY/ YYYY Zhu et al. (2012)
Shijiazhuang City, Hebei Province
0.00-0.25/0.25-0.40/ 0.40-0.60/0.60-0.85/ 0.85-1.20/1.20-1.65/
1.65-2.10
Sand loam/ Sand loam/ loam/ loam/ Clay/ Clay/ Sand clay
NYYY/ NYYY/ NYYY/ NYYY/ NYYY/ NYYY/
NYYY
Zhang et al. (2001)
Xiong District, Baoding City, Hebei Province
0.00-0.20/0.20-0.40/ 0.40-0.70/0.70-1.00/ 1.00-2.20/2.20-4.00
loam/ loam/ loam/ Clay/ Sand clay/ loam
NYYY/ NYYY/ NYYY/ NYYY/ NYYY/ NYYY
Xu et al. (1997); Liu and Xie (1998)
luancheng District, Shijiazhuang City, Hebei Province
0.00-0.20/0.20-0.50/ 0.50-1.00/1.00-1.50
Silt loam/ Silt loam/ Silt loam/ Silt loam
YYYN/ YYYN/ YYYN/ YYYN
Peng and Shao (2006); Lu et al. (2006); Chen (2005) Wangdu District, Baoding
City, Hebei Province
0.00-0.35/0.35-0.70/>0.70 Sand loam/ loam/ Silt NYYN/ NYYN/ NYYN
Huang (1995); Huang et al. (1995) linxi District, Xingtai City,
Hebei Province
0.00-0.50/0.50-1.00/>1.50 loam/ Clay/ Silt sand NYYY/ NYYY/ NYYY
li (1997)
Hengshui City, Hebei Province
0.00-0.45/ 0.45-1.45/1.45-3.55
Clay/ Clay/ Silt NYYY/ NYYY/ NYYY
Wang and Jin (2002)
Quzhou District, Handan City-1, Hebei Province
0.00-0.20/0.20-0.55/ 0.55-1.00/1.00-1.20/
1.20-1.80
Silt sand loam/ Silt sand loam/ Silt sand loam/Silt sand
clay/ Silt sand
YYYY/ YYYY/ YYYY/ YYYY/ YYYY
Huang et al. (2000); Qiao et al. (1999);
Ma (2004) Quzhou District, Handan
City-2, Hebei Province
0.00-0.37/0.37-0.86/ 0.86-1.40/1.40-2.00
Silt sand loam/ Silt sand/ Silt sand clay/ Clay
YYYY/ YYYY/ YYYY / YYYY
Ma (2004)
Quzhou District, Handan City-3, Hebei Province
0.00-0.30/0.30-0.82/ 0.82-1.45/1.45-2.00
Silt sand loam/ Silt sand loam/ Silt sand/ Silt sand
loam
YYYY/ YYYY/ YYYY/ YYYY
Ma (2004)
Guantao District, Handan City, Hebei Province
0.00-0.25/0.26-0.45/0.45-1.00
Silt clay/ Silt clay/ Clay loam YYYY/ YYYY/ YYYY Zhu et al. (2012)
Yucheng City, Shandong Province
0.00-0.15/0.15-0.70/ 0.70-0.76/0.76-1.13/ 1.13-1.21/>1.21
Silt loam/ Silt loam/ Silt loam/ Silt loam/ Silt loam/ Silt
YYYN/ YYYN/ YYYN/ YYYN/ YYYN/ YYNN
Ma (2004)
table 2. descriptive statistical index for the data collected in the haihe river Basin in northern China statistical
index sand silt Clay Bd θs θr sshC
% Mg m-3 m3 m-3 m s-1
Dongbeiwang Town, Haidian District, Beijing City
Average 27.1 52.4 20.6 1.55 0.377 0.0575 0.00000055 Sv 48.9 24 11.6 0.0212 0.000947 0.000153 0.000000000000379
SD 6.99 4.9 3.4 0.146 0.0308 0.0124 0.000000616
Cv 0.258 0.0935 0.165 0.0943 0.0817 0.215 1.12 Xiaotang
Mountain, Changping District, Beijing City
Average - - - 1.39 0.421 0.0437 0.000000832
Sv - - - 0 0.000911 0.00102 0.000000000000497
SD - - - 0 0.0302 0.0319 0.000000705
Cv - - - 0 0.0716 0.73 0.848
Yongledian, Tongzhou District, Beijing City
Average 43 48.3 8.73 1.46 0.454 0.0559
-Sv 450 313 19.7 0.00274 0.000304 0.000303
-SD 21.2 17.7 4.44 0.0524 0.0174 0.0174
-Cv 0.493 0.366 0.509 0.0359 0.0384 0.311
-Miyun District, Beijing City
Average 33.1 45.8 21.1 1.45 0.398 0.0641 0.00000146 Sv 189 87.2 20.2 0.0037 0.000486 0.00013 0.000000000000249 SSD 13.7 9.34 4.5 0.0608 0.022 0.0114 0.000000499
Cv 0.416 0.204 0.213 0.042 0.0554 0.178 0.341 Daxing District,
Beijing City
Average 24.6 57.6 17.8 1.43 0.393 0.0617 0.00000183 Sv 1.08 2.25 0.294 0.0027 0.000131 0.00000172 0.000000000000236 SD 1.04 1.5 0.542 0.052 0.0115 0.00131 0.000000486 Cv 0.0424 0.026 0.0304 0.0363 0.0291 0.0213 0.265 Shijiazhuang
City, Hebei Province
Average - - - 1.51 0.416 0.115 0.0000000497
Sv - - - 0.00571 0.000626 0.00594 0.00000000000000251
SD - - - 0.0756 0.025 0.0771 0.0000000501
Cv - - - 0.0501 0.0601 0.672 1.01
Xiong District, Baoding City, Hebei Province
Average - - - 1.39 0.437 0.132 0.00000159
Sv - - - 0.00522 0.00278 0.00399 0.000000000000843
SD - - - 0.0722 0.0527 0.0631 0.000000918
Cv - - - 0.0519 0.121 0.478 0.577
luancheng District, Shijiazhuang City, Hebei Province
Average 33 57.6 9.4 1.47 0.495 0.108
-Sv 56.5 9.9 23.9 0.0279 0.000967 0.00161
-SD 7.52 3.15 4.89 0.167 0.0311 0.0401
-Cv 0.228 0.0546 0.52 0.114 0.0628 0.371
-Wangdu District, Baoding City, Hebei Province
Average - - - 1.48 0.391 0.116
-Sv - - - 0.00413 0.000487 0.0022
-SD - - - 0.0643 0.0221 0.0469
-Cv - - - 0.0433 0.0564 0.405
-linxi District, Xingtai City, Hebei Province
Average - - - 1.42 0.445 0.03 0.00000139
Sv - - - 0.00453 0.00212 0.0012 0.00000000000212
SD - - - 0.0673 0.046 0.0346 0.00000146
Cv - - - 0.0474 0.103 1.15 1.05
Hengshui City, Hebei Province
Average - - - 1.44 0.378 0.0884 0.00000000242
Sv - - - 0.00723 0.000548 0.000194 0.00000000000000000216
SD - - - 0.085 0.0234 0.0139 0.00000000147
Cv - - - 0.0589 0.0619 0.158 0.608
Reynolds et al., 2009). si= 0.035 was suggested for the reference value as the boundary between good and poor soil structural quality (Dexter, 2004b).
By assuming that a soil with a greater degree of hard-setting at θi had the same effect at any other water content, Dexter (2004c) introduced an equation for measuring hard-setting, h, which was based on the rate of change of effective stress (estimated as Θh) with unit change of gravimetric water content, θ :
H d h
d
= ( Θ)
θ Eq. 7
At the inflection point:
H h
S
i i
sat i
i
=[ ][ + ]
θ θ
1 Eq. 8
where hiis the index for hard-setting.
Dexter (2004c) also showed that the friability index, Fi, was highly correlated with si, and Fi varied with si in the following equation:
Fi=15 00. Si
Eq. 9 where Fi is the friability index, and 0.5 is the reference value defining soil structural quality as good or poor.
Soil unsaturated hydraulic conductivity, Ki, at the inflection point can be derived by combining equations 2, 4, and 5.
results and disCussion
Based on s-theory, we will discuss interaction between the indices of s-theory and different soil parameters on a regional scale as follows: s index vs. clay content, log hvs. clay content, s index vs. bulk density, log hvs. bulk density, -log Kivs. -log s, and -log Kivs. -log (s/h)2. The effect of clay content on the s and h index, collected at different depths in Yongledian, Beijing City, were also discussed. s, F, and h values of s-theory and statistical indicators of 16 sites were calculated for quantitatively assessing the soil physical quality of the Haihe River Basin in northern China.
the effects of clay content on the index for soil physical quality
The effect of clay content on the s index in the Haihe River Basin is in figure 1a. It reveals that with an increase in clay content, the value of the s index generally decreases. Such a phenomenon is likewise seen in a previous study on Swedish soils (Dexter, 2004b). Clay content for most soils in the Haihe River Basin is between 15 and 35 %, which leads to an s index in the range of 0.0359 to 0.1000. The maximum and minimum values of the s index in the Haihe River Basin are 0.242 and 0.0359, respectively, both of which are above the critical value of 0.035. The average value of the s index is 0.077, indicating that soil physical quality in the
Continuation Quzhou District, Handan City-1, Hebei Province
Average 6.8 68.1 25.1 1.39 0.452 0.0781 0.00000215 Sv 21.8 173 204 0.00047 0.000398 0.000247 0.00000000000225
SD 4.67 13.1 14.3 0.0217 0.02 0.0157 0.0000015
Cv 0.687 0.193 0.569 0.0156 0.0442 0.201 0.698 Quzhou
District, Handan City-2, Hebei Province
Average 6.57 66.8 26.6 1.4 0.495 0.0965 0.000000788 Sv 28 431 635 0.0000667 0.000366 0.00241 0.000000000000531 SD 5.29 20.8 25.2 0.00816 0.0191 0.0491 0.000000729 Cv 0.805 0.311 0.947 0.00583 0.0386 0.509 0.925 Quzhou
District, Handan City-3, Hebei Province
Average 6.91 78.3 14.8 1.42 0.485 0.0715 0.000000765 Sv 20.6 167 165 0.00263 0.000097 0.0000029 0.000000000000235 SD 4.54 12.9 12.9 0.0512 0.00985 0.0017 0.000000485 Cv 0.657 0.165 0.87 0.036 0.0203 0.0238 0.634 Guantao
District, Handan City, Hebei Province
Average 9.55 47.7 42.8 1.49 0.442 0.0894 0.000000572
Sv 119 52.5 177 0.0012 0.00117 0.000126 0.0000000000000000268 SD 10.9 7.25 13.3 0.0346 0.0342 0.0112 0.00000000517 Cv 1.14 0.152 0.311 0.0232 0.0774 0.125 0.00904 Yucheng City,
Shandong Province
Average 9.48 76.2 14.3 1.47 0.5 0.12
-Sv 16.9 59.3 90.9 0.00359 0.00824 0.00949
-SD 4.11 7.7 9.53 0.0599 0.0908 0.0974
-Cv 0.434 0.101 0.668 0.0407 0.182 0.815
Haihe River Basin is very good. The coefficient of determination of the fitting curve is low, 0.3144, which may be attributed to the spatial variation of soil physical quality.
With the increase in clay content at different intervals, the value of the s index generally decreases at a different rate of change. The attempt was made to use double linear lines to fit the data of the S index against clay content. The dividing point separating the two lines was found at the clay content of 20 %. We designate the zone for clay content less than 20 % as ‘the steep-changing zone’, and the zone for clay content greater than 20 % as ‘the steady-changing zone’ (figure 1b). The slopes of the fitting lines for the two zones are -0.004 and -0.0005, respectively. This suggests that the s index in the steep-changing zone decreases much faster with an increase in clay content than the s index in the steady-changing zone.
Generally, log h increases with increasing clay content, implying that the higher the clay content in the soil, more probably the hard-setting of soil will occur (Figure 2a). The low R2 value and equation 8 indicates that the h index is affected by more variables than just the clay content used in this
study. The maximum and minimum values of the h index in the Haihe River Basin are 16503 and 267, respectively, whereas most of the h index is between 2000 and 6000, and the average value of the h index is 4169. The steep-changing zone and the steady-changing zone were also able to be identified (Figure 2b), with the clay content of 20 % as the critical value as well. The h index increases faster with increasing clay content when clay content is less than 20 % than when clay content is greater than 20 %.
Figure 3 shows the effect of clay content on the s (figure 3a) and h (figure 3b) index in Yongledian, Tongzhou District, Beijing City. Seven soil samples from depths ranging from 0 to 2.41 m were obtained at the same site. Clay content at this site is between 0 and 20 %, which is in the steep-changing zone. Relationships between the s index vs. clay content, and the h index vs. clay content at this site received a higher R2, which were shown in Dexter’s study (Dexter, 2004b,c,d). for these relationships on the regional scale (figures 1a and 2a), the relatively lower R2 for the relationships between the s index
vs. clay content, and the h index vs. clay content is mainly attributed to spatial variation in soil physical quality and sampling of different depths.
the effects of bulk density on the index for soil physical quality
(a)
ŷ = 0.1656 x-0,323 R² = 0.3144
(b) 0.30 0.30
0.25
0.20
0.15
0.10
0.05
0.00
ŷ = 0.1336 - 0.004 x R2
= 0.1804
ŷ = 0.07 - 0.0005 x R2
= 0.3882 0.25
Clay ≤20 % Clay >20 %
Linear Fitting Clay ≤20 % Linear Fitting Clay >20 % 0.20
0.10 0.15
0.05
0.00
0 20 40 60 80
S
Inde
x
S
Inde
x
Clay (%)
Figure 1. the effect of clay content on the S index in the haihe river Basin in northern China.
(a)
ŷ = 3.3394 + 0.0099 x R² = 0.1865
(b)
ŷ = 2.9978 + 0.0426 x R2
= 0.4495
ŷ = 3.2498 + 0.01 x R2
= 0.3276 4.5
Clay ≤20 % Clay >20 %
Linear fitting Clay ≤20 % Linear fitting Clay >20 % 4.0
3.0 3.5
2.5
0.0
0 20 40 60 80
4.5
4.0
3.0 3.5
2.5
0.0
log
H
Clay (%)
log H
◊
We attempted a linear correlation between soil bulk density and the s index (Figure 4a), but the low R2 value indicates that such a relationship might not exist, and bulk density is a less important variable for the s index. Most of soil bulk density in the Haihe River Basin is between 1.35 and 1.55 Mg m-3, and the s index in this region is scattered from 0.0359 to 0.100 (figure 4a). As for the log h, figure 4b shows a positive linear correlation with soil bulk density, although the R2 value is very low. From the above, it may be concluded that, compared to clay content, soil bulk density is a less important variable for the indices of s and log h.
soil physical quality at different sites in the haihe river Basin
Because soil physical properties differ at different depths, numerous studies have been conducted to obtain soil samples at different soil depths to get a comprehensive understanding of soil physical quality at the sites studied (Puma et al., 2005; Badía et al., 2013; Penna et al., 2013; Wang et al., 2014). Most sampling depths of the data collected in the Haihe River Basin are within 2.00 m, and all these depths should be considered in assessing soil physical quality. Thus, in this study, we followed the previous studies in analyzing samples from different depths for assessment of soil physical quality. for layered
sampling sites, the soil physical quality indices were calculated using the weighted average method.
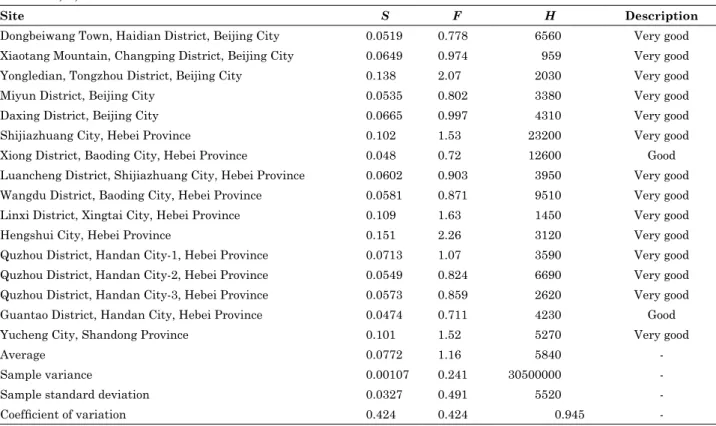
The coefficient of variation (CV) for the s index is 0.424, much smaller than the Cv of 0.945 for the h index (Table 3). This suggests that the change in the s index among different sites is not as great as that in the h index in the Haihe River Basin (figure 5). This is mainly due to the fact that the h index is affected by more variables than the s index, as discussed above.
Hydraulic conductivity at the inflection point and its relationships to S and S/hi
It has been reported that the value of s at the inflection point was related to unsaturated hydraulic conductivity of soil at the inflection point, and thus the inflection point was able to be used as a ‘‘matching point’’ in studying unsaturated hydraulic conductivity (Dexter, 2004d). Figure 6a shows the relationship between -log Ki, and -log s using the linear and polynomial equations for fitting. The fitting linear equation is (-log Ki) = -5.57 + 2.56(-log s). Dexter (2004d) used the same type of equation to fit the data to Polish and Dutch soils and obtained (-log Ki) = -4.39 + 2.28(-log s), with R2 = 0.50 for the Polish soil, and (-log Ki) = -3.69 + 3.05(-log s), with R2 = 0.50, for the Dutch soil.
Figure 3. the effect of clay content on the S and H index in yongledian, tongzhou district, Beijing City.
0.00 0.05 0.10 0.15 0.20 0.25 0.30
0 1 2 3 4 5 6
1.0 1.2 1.4 1.6 1.8
(a)
(b)
R² = 0.0199
S Inde
x
S
Linear Fitting
ŷ
ŷ = 0.2094 - 0.0885 x
= 1.454 + 1.4164 x R² = 0.0799
log
H
Bulk density (Mg m-3)
log H Linear Fitting
Figure 4. the effect of bulk density on the index for soil physical quality in the haihe river Basin in northern China.
(a)
(b)
ŷ = 0.2153 - 0.0112 x R² = 0.509
0.00 0.05 0.10 0.15 0.20 0.25 0.30
S
Inde
x
ŷ = 2.322 + 0.118 x R² = 0.7559
2.0 2.5 3.0 3.5 4.0 4.5
0 5 10 15 20
log
H
Clay (%)
The three fitted lines for different data sets are plotted in figure 7. It is clear that the three lines have a similar slope, although the intercepts of the three equations are different. The difference in the slope is mainly caused by clay content in the soil, which plays an important role in soil physical quality. Ranges and mean clay content for the three data sets are as follows: 0.02 to 0.24 kg kg-1 and 0.091 kg kg-1 for the Polish soil, 0.01 to 0.56 kg kg-1 and 0.0166 kg kg-1 for the Dutch soil, and 0.0192 to 0.6072 kg kg-1 and 0.1876 kg kg-1 for the Haihe Basin soil. The mean clay content controls the slope of the fitted line. A linear equation can also be used for fitting the relationship between -log Ki, and -log (s/hi)2, as shown in figure 6b.
In order to improve the R2 value, we tried to use the polynomial equation for fitting the same data sets (figures 6a and 6b). Higher R2 values were achieved in fitting the relationships between -log Ki, and -log s, and -log Ki, and -log (s/hi)2. The polynomial equation fitting indicates there are extreme maximum values of -log Ki (Figures 6a and 6b), which are both located at the extreme point of the two polynomial equations. When -log s = -0.954, the extreme maximum value of -log Ki is -8.01 (Figure 6a), whereas when -log (s/hi)2 = -5.947, the extreme value is -8.03 (figure 6b). Different variables are used for -log Ki , and its relationships to -log s and -log (s/hi)2 in the Haihe River Basin (Figures 6a and 6b). However, approximately the same number for extreme value for -log Ki is obtained when calculating two fitting
table 3. S, F, and H index and statistical indicators from 16 sites in the haihe river Basin in northern China
site S F H description
Dongbeiwang Town, Haidian District, Beijing City 0.0519 0.778 6560 very good Xiaotang Mountain, Changping District, Beijing City 0.0649 0.974 959 very good Yongledian, Tongzhou District, Beijing City 0.138 2.07 2030 very good
Miyun District, Beijing City 0.0535 0.802 3380 very good
Daxing District, Beijing City 0.0665 0.997 4310 very good
Shijiazhuang City, Hebei Province 0.102 1.53 23200 very good
Xiong District, Baoding City, Hebei Province 0.048 0.72 12600 Good luancheng District, Shijiazhuang City, Hebei Province 0.0602 0.903 3950 very good Wangdu District, Baoding City, Hebei Province 0.0581 0.871 9510 very good linxi District, Xingtai City, Hebei Province 0.109 1.63 1450 very good
Hengshui City, Hebei Province 0.151 2.26 3120 very good
Quzhou District, Handan City-1, Hebei Province 0.0713 1.07 3590 very good Quzhou District, Handan City-2, Hebei Province 0.0549 0.824 6690 very good Quzhou District, Handan City-3, Hebei Province 0.0573 0.859 2620 very good Guantao District, Handan City, Hebei Province 0.0474 0.711 4230 Good
Yucheng City, Shandong Province 0.101 1.52 5270 very good
Average 0.0772 1.16 5840
-Sample variance 0.00107 0.241 30500000
-Sample standard deviation 0.0327 0.491 5520
-Coefficient of variation 0.424 0.424 0.945
-S index
Dongbeiwang Town
0.16
0.08 0.1 0.12 0.14
0.06 S
0.04 0.02 0
Miyun District Daxing District
Shijiazhuang City
Xiong District
Luancheng District
Wangdu District
Linxi District
Guantao District
Yucheng City
Quzhou District-1 Quzhou District-2 Quzhou District-3
Hengshui City
Yongledian
Xiaotang Mountain
H index
Dongbeiwang Tow
n
25,000 (b) (a)
15,000 20,000
10,000 H
5,000
0
Miyun District Daxing District
Shijiazhuang City
Xiong District
Luancheng District
Wangdu District
Linxi District
Guantao District
Yucheng City
Quzhou District-1 Quzhou District-2 Quzhou District-3
Hengshui City
Yongledian
Xiaotang Mountain
equations for two relationships. The non-monotonous polynomial equation is better than the linear equation for fitting the relationships between -log Ki, and -log s, and -log Ki, and -log (s/hi)2.
ConClusions
Clay content is the most important factor that affects the soil physical quality indices of s, F, and h on the regional scale in northern China. Two different zones, the steep-changing zone and the steady-changing zone, were identified, with clay content of 20 % as the dividing value.
A negative linear correlation between bulk density and the s index, and a positive linear correlation between bulk density and the h index were found. Bulk density is a less important index compared to clay content.
The average s index of 0.077 indicates that soil physical quality in the Haihe River Basin is very good. The Cv for the s index is 0.424, smaller than the Cv of 0.945 for the h index, indicating that the s index does not vary significantly among different sites as compared to the h index in the Haihe River Basin.
Two different type equations, the linear equation and the polynomial equation, were used for fitting the relationships between -log Ki and -log s, and -log Ki and -log (s/hi)2. The polynomial equation with a higher r2provides a better fit than the linear equation for fitting the above two relationships.
aCKnoWledGments
This study was funded by the 973 Program (No.2013CB227904), the National Natural Science foundation of China (No.U1361214), and the fundamental Research funds for the Central Universities (No. 2012QNB10). The authors are grateful to the scholars cited for providing the data used in this study.
reFerenCes
Asgarzadeh H, Mosaddeghi MR, Mahboubi AA, Nosrati A, Dexter AR. Integral energy of conventional available water, least limiting water range and integral water capacity for better characterization of water availability and soil physical quality. Geoderma. 2011;166:34-42.
Badía D, Aguirre JA, Martí C, Márquez MA. Sieving effect on the intensity and persistence of water repellency at different soil depths and soil types from NE-Spain. Catena. 2013;108: 44-9. Bao Z, Zhang J, Wang G, Fu G, He R, Yan X, Jin J, Liu Y, Zhang A. Attribution for decreasing streamflow of the Haihe River basin, northern China: climate variability or human activities. J Hydrol. 2012;460-461:117-29.
Cao Q, Gong Y. Simulation and analysis of water balance and nitrogen leaching using Hydrus-1D under winter wheat crop. Plant Nutr Fert Sci. 2003;9:139-45. (In Chinese)
Chen J. Characteristics of soil temperature and soil water for winter wheat with no-tillage and effect on winter wheat growth in North China Plain [thesis]. Beijing: China Agricultural University, 2005. (In Chinese).
Figure 6. Hydraulic conductivity at the inflection
point and its relationships to S and S/hi in the haihe river Basin in northern China.
(a)
(b)
ŷ = -5.5712 + 2.558 x R² = 0.2915 ŷ = -12.426 - 9.2459 x - 4.8447 x2
R² = 0.5621
-16 -14 -12 -10 -8 -6 -4 -2 0
-3 -2 -1
0
-l
og Ki
-log S
log Ki Liner Fitting Polynomial Fitting
log Ki Liner Fitting Polynomial Fitting ŷ = -3.6713 + 0.7042 x
R² = 0.2902 ŷ = -18.411 - 3.4971 x - 0.294 x2
R² = 0.4686
-16 -14 -12 -10 -8 -6 -4 -2 0 -15 -10 -5
0
-l
og Ki
-log (S/hi)2
Figure 7. Three fitted lines for different data sets.
-14 -12 -10 -8 -6 -4 -2 0
-3 -2 -1
0
-l
og Ki
-log S
Haihe
Polish
Dexter AR. Soil physical quality. Soil Till Res. 2004a;79:129-30. Dexter AR. Soil physical quality. Part 1. Theory, effects of soil texture, density, and organic matter, and effects on root growth. Geoderma. 2004b;120:201-14.
Dexter AR. Soil physical quality Part 2. friability, tillage, tilth and hardsetting. Geoderma. 2004c;120:215-25.
Dexter AR. Soil physical quality Part 3: Unsaturated hydraulic conductivity and general conclusions about S-theory. Geoderma. 2004d;120:227-39.
Dexter AR, Bird NRA. Methods for predicting the optimum and the range of soil water contents for tillage based on the water retention curve. Soil Till Res. 2001;57:203-12.
Dexter AR, Birkas M. Prediction of the soil structures produced by tillage. Soil Till Res. 2004;79:233-8.
Dexter AR, Czyż EA. Applications of S-Theory in the study of soil physical degradation and its consequences. land Degrad Dev. 2007;18:369-81.
Dexter AR, Czyż EA, Gate OP. A method for prediction of soil penetration resistance. Soil Till Res. 2007;93:412-9.
Dexter AR, Richard G. Tillage of soils in relation to their bi-modal pore size distributions. Soil Till Res. 2009;103:113-8.
Huang G. Dynamic random simulation to unsaturated soil flow and study of water production function for crop [thesis]. Wuhan [China]: University of Hydraulic and Electric Engineering; 1995. (In Chinese). Huang G, Shen R, Zhang Y, Zhang H, Hou Z. Simulating evaporation and transpiration and forecasting soil moisture regime under conditions of crop growth. J Wuhan Univ Hydr Elect Eng. 1995;28:481-7. (In Chinese).
Huang Q, Zhang f, Xue Y, Qi W. Characteristics and taxonomic classification of soil in Quzhou, Hebei. J China Agric Univ. 2000;5:67-73. (In Chinese).
Jin L, Hu K, Li B, Gong Y. Coupled simulation on crop growth and soil water-heat-nitrogen transport 2. Model validation and application. Shuili Xuebao. 2007;38:972-80. (In Chinese). Li H. Research on water transport, crop growth dynamic simulation and application in irrigation forecast in SPAC [thesis]. Wuhan [China]: University of Hydraulic and Electric Engineering; 1997. (In Chinese).
Liu Q, Xie S A study on field soil water balance for summer corn in north China plain. Shuili Xuebao. 1998; 1:62-8. (In Chinese) Lu X, Jin M, Wang B. Discussion on the soil water characteristic Curve of the Agricultural Eco-System Experiment Station in luancheng, Hebei Province. China Rural Water Hydrop. 2006; 12:30-2. (In Chinese).
Ma J. Development of transfer function model and numerical prediction on nitrate-nitrogen leaching risk at field scale [thesis]. Beijing [China]: China Agricultural University; 2004. (In Chinese).
Peng J, Shao A. Determination of the parameters of VG model based on Matlab. Hydrogeol Eng Geol. 2006;6:25-8. (In Chinese). Penna D, Brocca L, Borga M, Fontana GD. Soil moisture temporal stability at different depths on two alpine hillslopes during wet and dry periods. J Hydrol. 2013;477:55-71.
Puma MJ, Celia MA, Rodriguez-Iturbe I, Guswa AJ. Functional relationship to describe temporal statistics of soil moisture averaged over different depths. Adv Water Resour. 2005;28:553-66. Qiao Y, Yu Z, Zhang Y, Xin J, Driessen P. Effects of irrigation with light saline water on growth of winter wheat and soil environment in salinized regions. Soils Fert. 1999;4:11-4. (In Chinese).
Reynolds WD, Bowman BT, Drury CF, Tan CS, Lu X. Indicators of good soil physical quality: density and storage parameters. Geoderma. 2002;110:131-46.
Reynolds WD, Drury Cf, Tan CS, fox CA, Yang XM. Use of indicators and pore volume-function characteristics to quantify soil physical quality. Geoderma. 2009;152:252-63.
Santos GG, Silva EM, Marchão RL, Silveira PM, Bruand A, James f, Becquer T. Analysis of physical quality of soil using the water retention curve: validity of the S-index. Comp Rendus Geosci. 2011;343:295-301.
van Genuchten MTh. A closed form equation for predicting the hydraulic conductivity of unsaturated soil. Soil Sci Soc Am J. 1980;44:892-8.
van lier QJ. Revisiting the S-index for soil physical quality and its use in Brazil. R Bras Ci Solo. 2014;38:1-10.
Wang B, Jin M. A two dimensional numerical simulation of the soil water-nutrient salinity in summer maize field. Geol Sci Technol Inf. 2002;21:55-60. (In Chinese).
Wang H, Wang W, Chen H, Zhang Z, Mao Z, Zu Y. Temporal changes of soil physic-chemical properties at different soil depths during larch afforestation by multivariate analysis of covariance. Ecol Evol. 2014;4:1039-48.
Weng SQ, Huang GH, Li YP. An integrated scenario-based multi-criteria decision support system for water resources management and planning-A case study in the Haihe River Basin. Expert Syst Appl. 2010;37:8242-54.
Wösten JHM, Pachepsky YA, Rawls WJ. Pedotransfer functions: bridging the gap between available basic soil data and missing soil hydraulic characteristics. J Hydrol. 2001;251:123-50.
Xing W, Wang W, Shao Q, Peng S, Yu Z, Yong B, Taylor J. Changes of reference evapotranspiration in the Haihe River Basin: present observations and future projection from climatic variables through multi-model ensemble. Global Planet Change. 2014;115:1-15. Xu D, Schmid R, Hermoud A. Comparison and field test of the experimental methods for determining soil hydraulic properties. Shuili Xuebao. 1997;8:49-56. (In Chinese).
Xu X, Yang D, Yang H, lei H. Attribution analysis based on the Budyko hypothesis for detecting the dominant cause of runoff decline in Haihe basin. J Hydrol. 2014;510:530-40.
Zhang X, Zhang l, liu C. On describing the hydraulic properties of unsaturated soil in Piedmont of Mt. Taihang. Acta Agric Boreali-Sinica. 2001;16:75-82. (In Chinese).
Zhu Z, lin l, Xu T. Soil moisture dynamic simulation of different underlying surface in the Hai River Basin. Adv Earth Sci. 2012;27:778-87. (In Chinese).
Zou C. Measurement and analysis on numerical simulation of soil hydraulic properties [thesis]. Wuhan [China]: Wuhan University; 2004. (In Chinese).
Zou C, Xue X, Zhang R. Estimating Brook-Corey model parameters based on soil water infiltration data under two kinds of negative water pressures. Trans Chin Soc Agric Eng. 2006a;22:1-6. (In Chinese)